
Lara’s Weekly: Elliott Wave and Technical Analysis of S&P500 and Gold and US Oil | Charts – October 16, 2020

S&P 500
An upwards week closes as a red doji candlestick.
The short-term invalidation point is moved higher this week.
Summary: The invalidation point is moved up to 3,209.45.
For the very short term, a little more downwards movement to about 3,418 to begin next week looks likely.
The next target is at 4,606.
At this stage, a new high above 3,588.11 would invalidate the second very bearish Elliott wave count, leaving only a bullish Elliott wave count.
The biggest picture, Grand Super Cycle analysis, is here.
Last monthly charts are here. Video is here.
ELLIOTT WAVE COUNTS
FIRST WAVE COUNT
WEEKLY CHART
Click chart to enlarge.
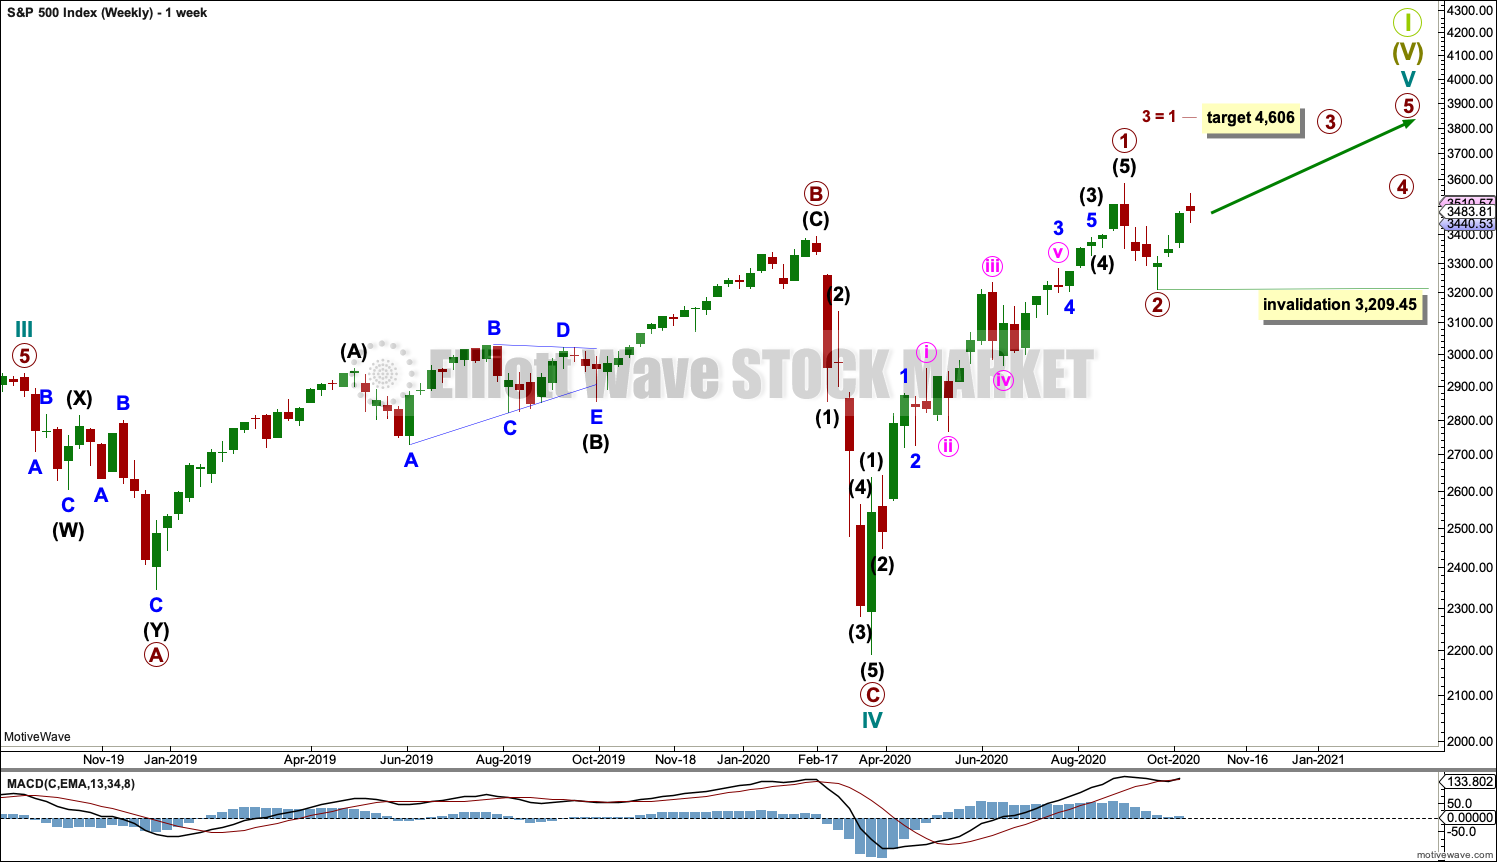
Cycle wave V may last from one to several years. So far it is in its seventh month.
Cycle wave V would most likely subdivide as an impulse. But if overlapping develops, then an ending diagonal should be considered. This chart considers the more common impulse.
Primary waves 1 and 2 may be complete.
Primary wave 3 may have begun. It may only subdivide as an impulse. Intermediate wave (2) within primary wave 3 may not move beyond the start of intermediate wave (1) below 3,209.45.
There is already a Fibonacci ratio between cycle waves I and III within Super Cycle wave (V). The S&P500 often exhibits a Fibonacci ratio between two of its actionary waves but rarely between all three; it is less likely that cycle wave V would exhibit a Fibonacci ratio. The target for Super Cycle wave (V) to end would best be calculated at primary degree, but that cannot be done until all of primary waves 1, 2, 3 and 4 are complete.
DAILY CHART
Click chart to enlarge.
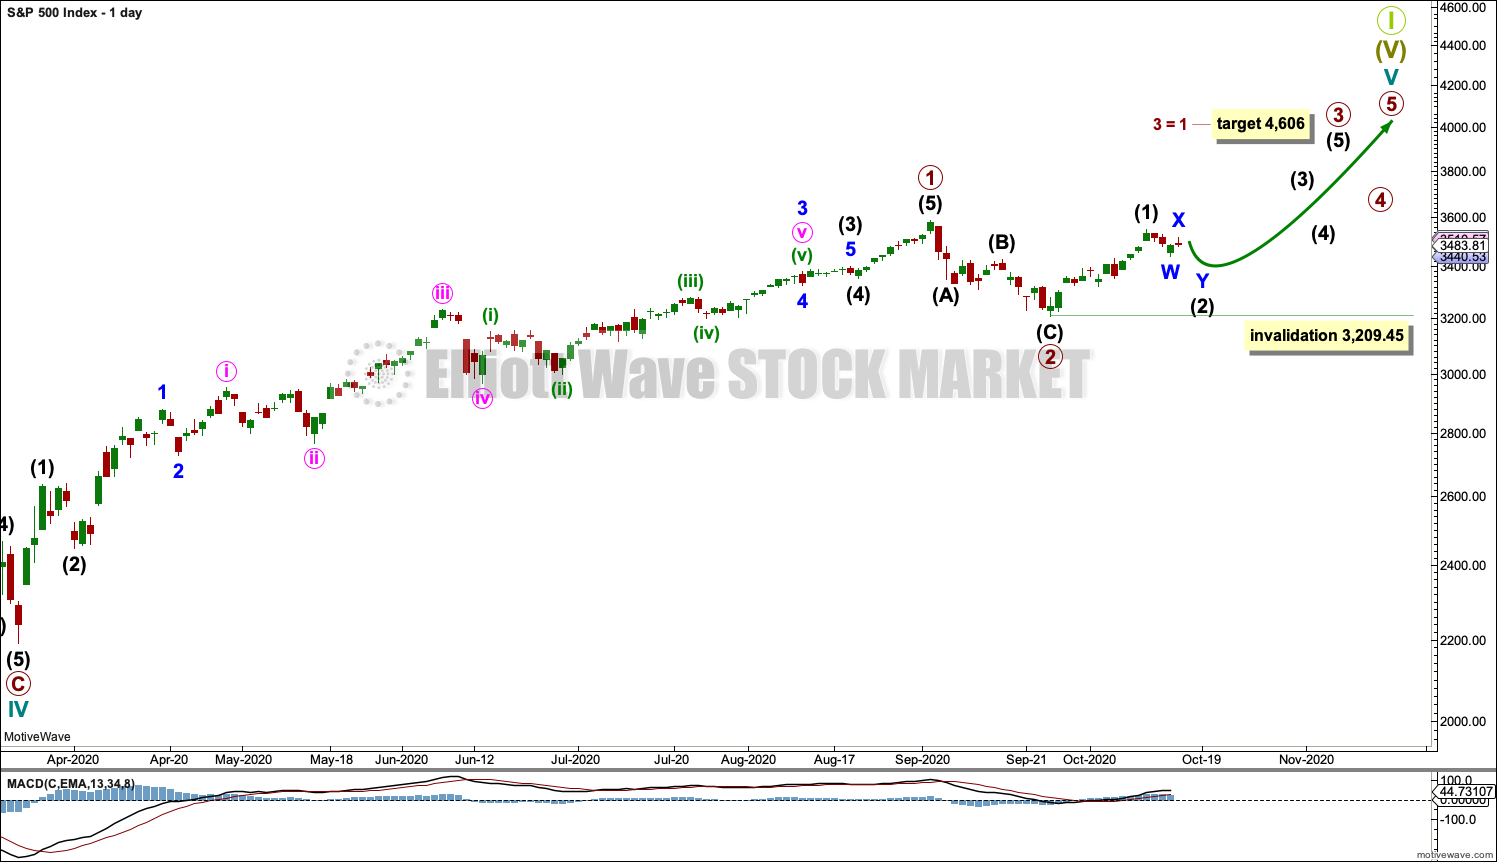
Primary waves 1 and 2 may both be complete. Primary wave 3 may now be underway.
Primary wave 3 may only subdivide as an impulse. Intermediate wave (2) within primary wave 3 may not move beyond the start of intermediate wave (1) below 3,209.45.
Primary wave 1 looks extended. The target for primary wave 3 expects it to also be extended.
SECOND WAVE COUNT
DAILY CHART
Click chart to enlarge.
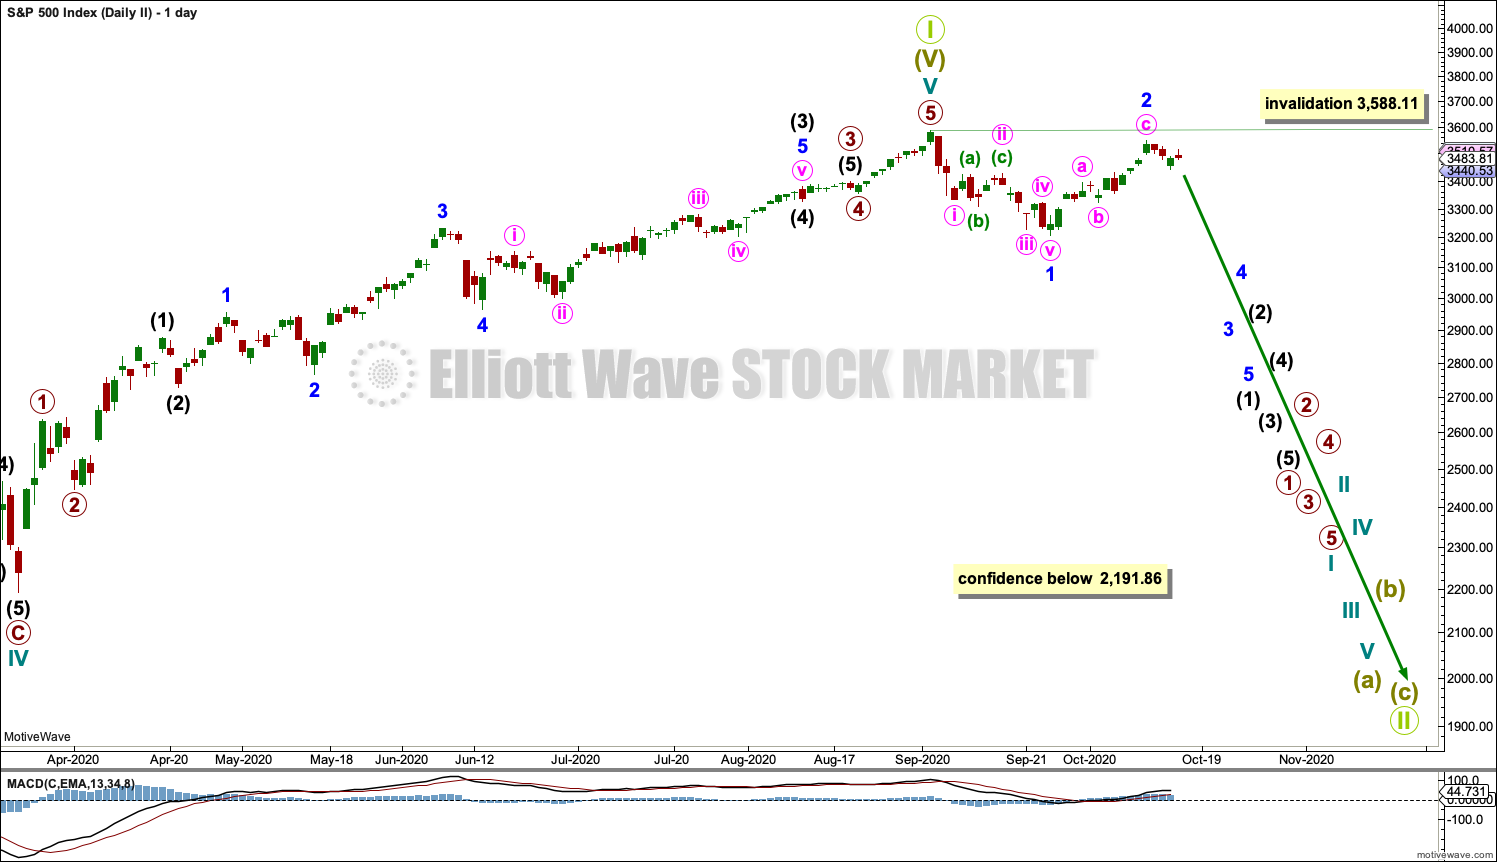
This wave count is the same as the first wave count with the exception of the degree of labelling within cycle wave V. If the degree of labelling is moved up one degree, then it is possible that cycle wave V to end Super cycle wave (V) to end Grand Super Cycle wave I is complete.
A new low below 2,191.86 would add confidence in this wave count. At that stage, the first wave count would be invalidated.
A new bear market at Grand Super Cycle degree may be expected to last over a decade. It may take price below the start of Super Cycle wave (V) at 666.79 in March 2009.
A first five down, labelled minor wave 1, may be complete. Minor wave 2 now also may be complete. A third wave down at minor degree may just have begun. It should exhibit strength if this wave count is correct. So far it has not. This wave count does not have support from technical analysis.
Major new downwards trends for this market usually begin with strength. The lack of any 90% down days or back to back 80% down days reduces the probability of this wave count. Now with the AD line making a new all time high and two back to back 80% upwards days the probability of this wave count has reduced further.
TECHNICAL ANALYSIS
WEEKLY CHART
Click chart to enlarge. Chart courtesy of StockCharts.com.
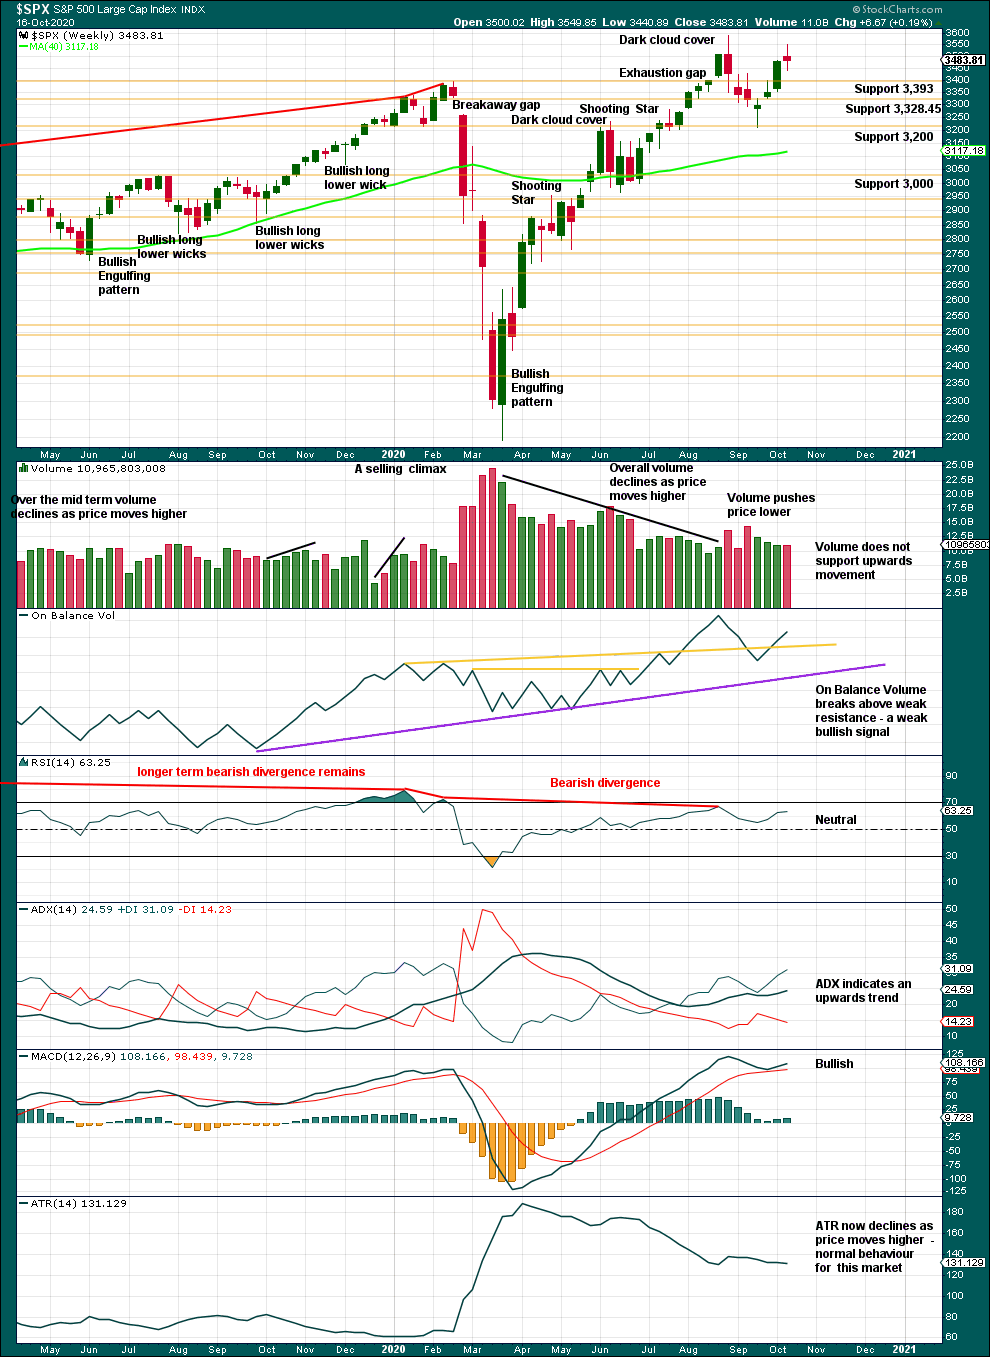
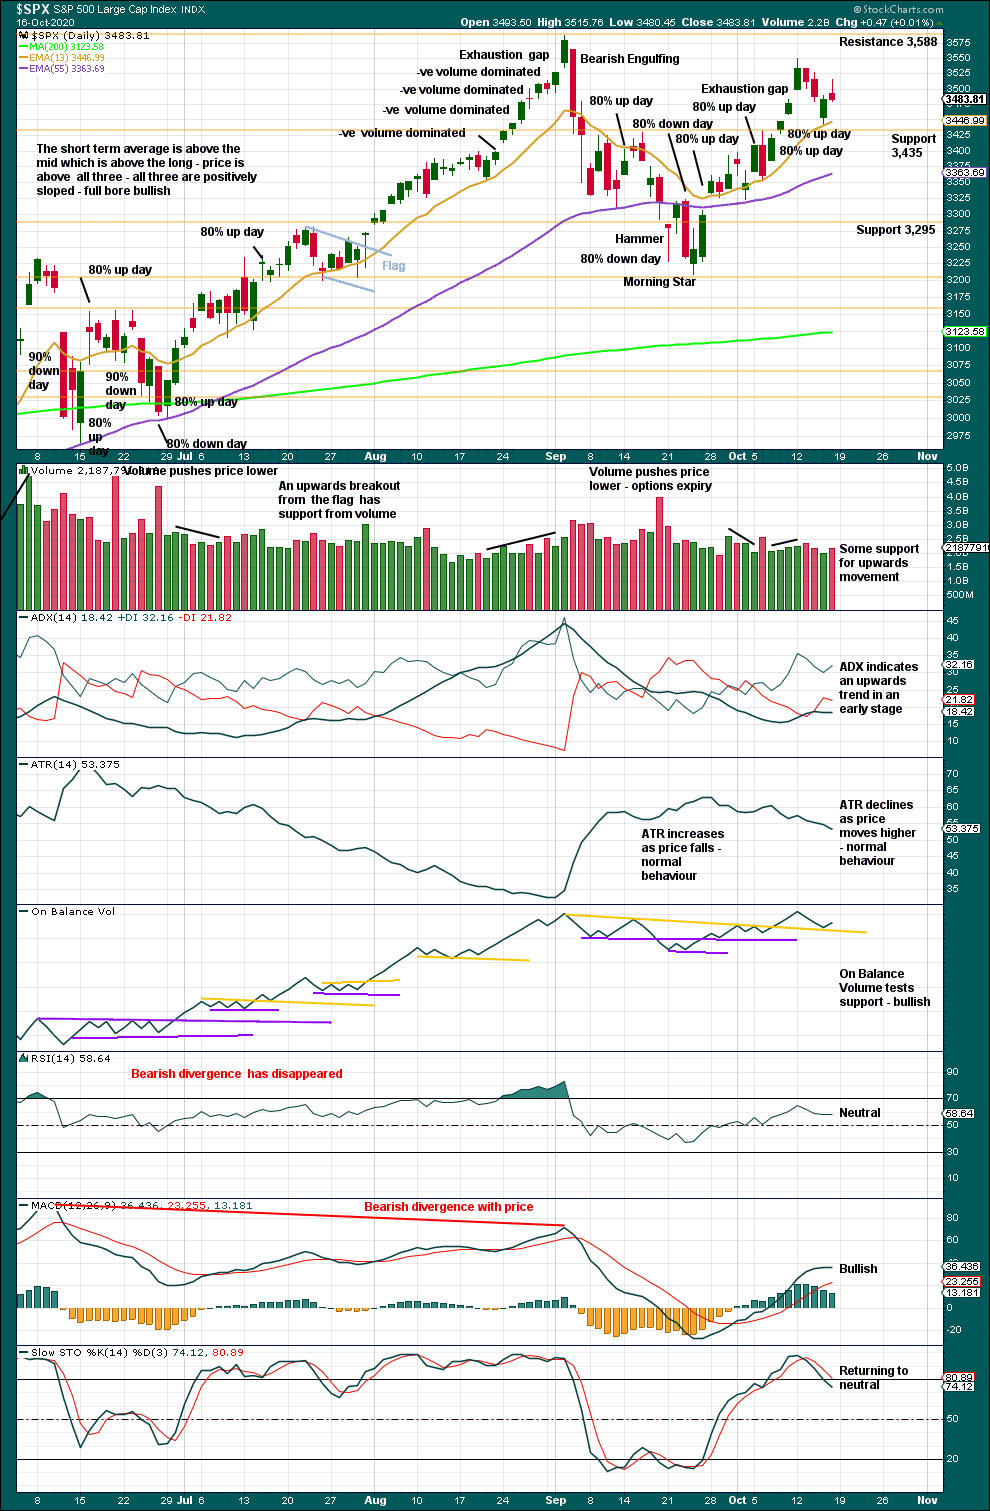
This week closes as a red doji. A doji on its own represents a pause and may occur within an upwards trend; it is on its own not a bearish reversal pattern.
There is an upwards trend in place.
DAILY CHART
Click chart to enlarge. Chart courtesy of StockCharts.com.
There are now two back to back 80% upwards days.
All of On Balance Volume, ADX and MACD are bullish. There is an upwards trend in place.
BREADTH – AD LINE
WEEKLY CHART
Click chart to enlarge. Chart courtesy of StockCharts.com. So that colour blind members are included, bearish signals will be noted with blue and bullish signals with yellow.
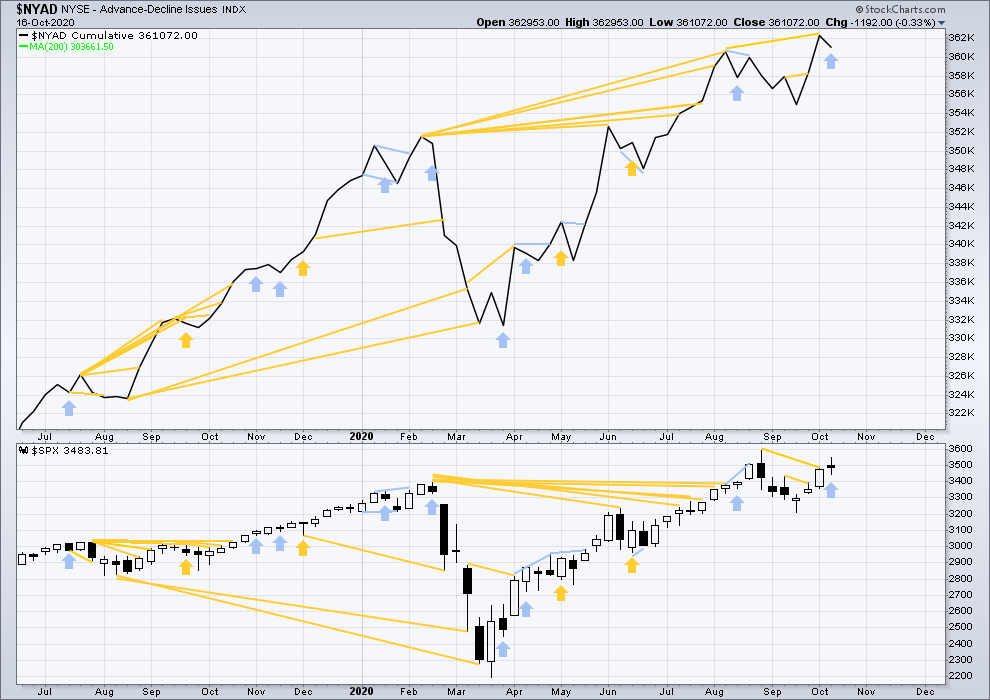
Breadth should be read as a leading indicator.
Lowry’s Operating Companies Only AD line has made a new all time high on the 12th of October. This erases prior bearish divergence with the last all time high in January 2020. With both the NYSE and OCO AD lines making new all time highs, breadth is leading price. This is a strong bullish signal and supports the first Elliott wave count. The second bearish Elliott wave count should now be discarded.
Large caps all time high: 3,588.11 on September 2, 2020.
Mid caps all time high: 2,109.43 on February 20, 2020.
Small caps all time high: 1,100.58 on August 27, 2018.
This rise has been led by large caps, which is a feature of an aged bull market. Above the swing high of the 11th of August, large caps first made a new high now followed by mid caps. Small caps have not yet made a new high above this point.
DAILY CHART
Click chart to enlarge. Chart courtesy of StockCharts.com. So that colour blind members are included, bearish signals will be noted with blue and bullish signals with yellow.
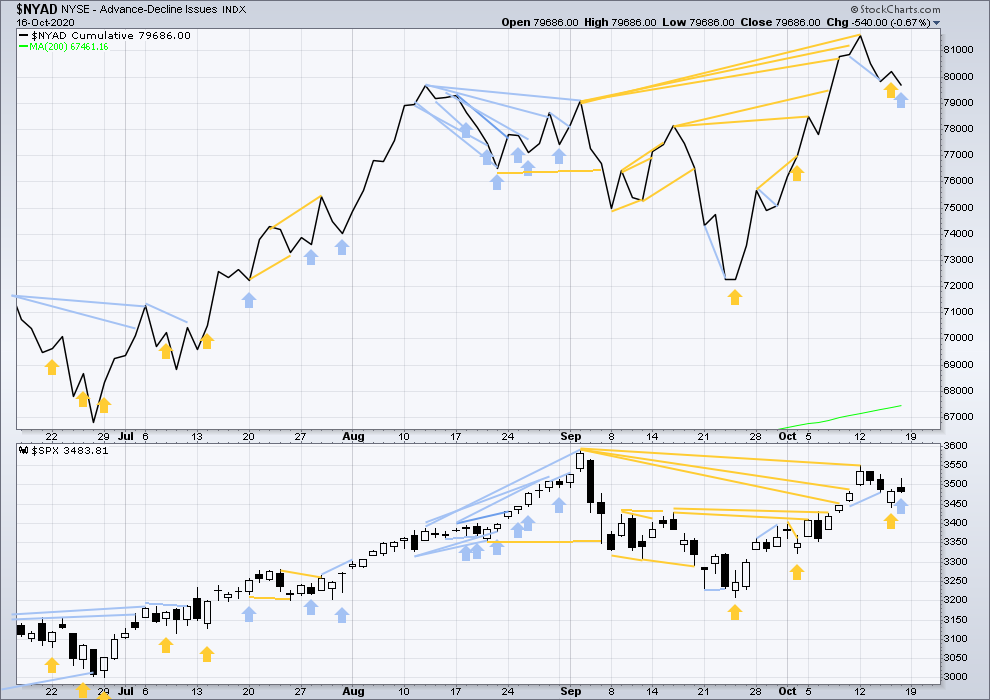
Today price has moved higher, but the AD line has moved lower. This is a single day instance of bearish divergence.
VOLATILITY – INVERTED VIX CHART
WEEKLY CHART
Click chart to enlarge. Chart courtesy of StockCharts.com. So that colour blind members are included, bearish signals will be noted with blue and bullish signals with yellow.
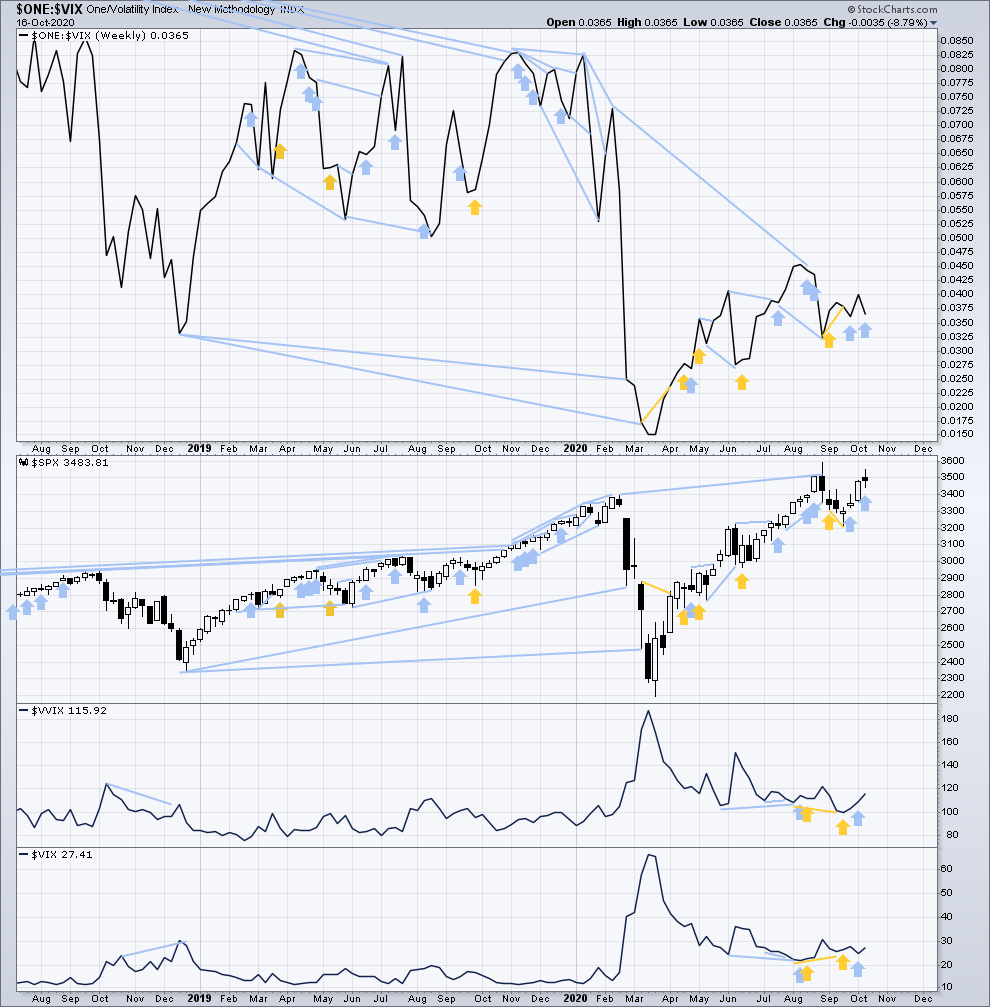
Inverted VIX remains well below all time highs. The all time high for inverted VIX was in the week beginning October 30, 2017. There is nearly 3 years of bearish divergence between price and inverted VIX. There is all of long, mid and short-term bearish divergence.
This week price has moved higher, but inverted VIX has moved lower. This divergence is bearish for the short term.
Comparing VIX and VVIX: This week both VIX and VVIX have moved higher. There is no new short-term divergence.
DAILY CHART
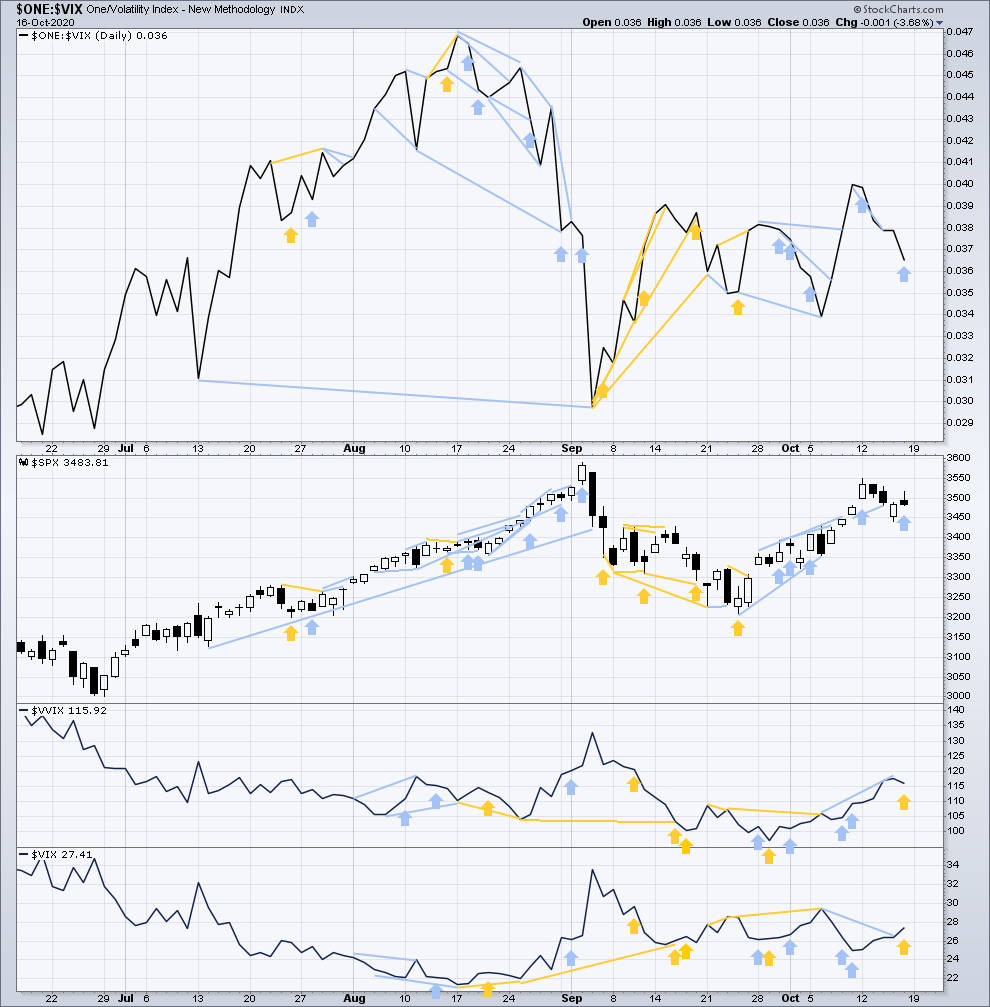
Click chart to enlarge. Chart courtesy of StockCharts.com. So that colour blind members are included, bearish signals will be noted with blue and bullish signals with yellow.
On Friday price has moved higher, but inverted VIX has moved lower. This is short-term bearish divergence.
Comparing VIX and VVIX at the daily chart level: VIX has moved higher, but VVIX has moved lower. This divergence is bullish for price for the short term.
DOW THEORY
Dow Theory still concludes a bear market is in place.
Dow Theory confirmed a bear market with the following lows made on a closing basis:
DJIA: 21,712.53 – a close below this point was been made on the March 12, 2020.
DJT: 8,636.79 – a close below this point was been made on March 9, 2020.
Adding in the S&P and Nasdaq for an extended Dow Theory, a bear market was confirmed:
S&P500: 2,346.58 – a close below this point was made on March 20, 2020.
Nasdaq: 7,292.22 – a close below this point was made on the March 12, 2020.
At this time, to shift Dow Theory from viewing a bear market to confirmation of a new bull market would require new highs made on a closing basis:
DJIA: 29,568.57
DJT: 11,623.58 – closed above on 7th October 2020.
Adding in the S&P and Nasdaq for an extended Dow Theory, confirmation of a bull market would require new highs made on a closing basis:
S&P500: 3,393.52 – closed above on 21st August 2020.
Nasdaq: 9,838.37 – closed above on June 8, 2020.
GOLD
Price has moved a little higher this week, but the candlestick has closed red.
All three Elliott wave counts remain the same.
Summary: The first and second Elliott wave counts expect upwards movement to 2,160.
A target calculated from the classic symmetrical triangle pattern for downwards movement is at 1,712. This aligns with the second alternate Elliott wave count.
The alternate Elliott wave count expects a bounce to end above 2,014.05 but not above 2,070.48 before the downwards trend begins to exhibit strength.
A second alternate wave count looks at the possibility of downwards movement here. Some confidence may be had in this idea with a new low below 1,849.22. A breach of the wide black channel on daily charts would increase the probability of this second alternate wave count.
A new low below 1,764.12 at any time frame would invalidate the first daily chart and add confidence in an alternate daily chart. At that stage, a sustainable high would be in place and a new downwards trend to last months may be underway.
Grand SuperCycle analysis is here.
Last analysis of monthly charts is here with video here.
FIRST ELLIOTT WAVE COUNT
WEEKLY CHART
Click chart to enlarge.
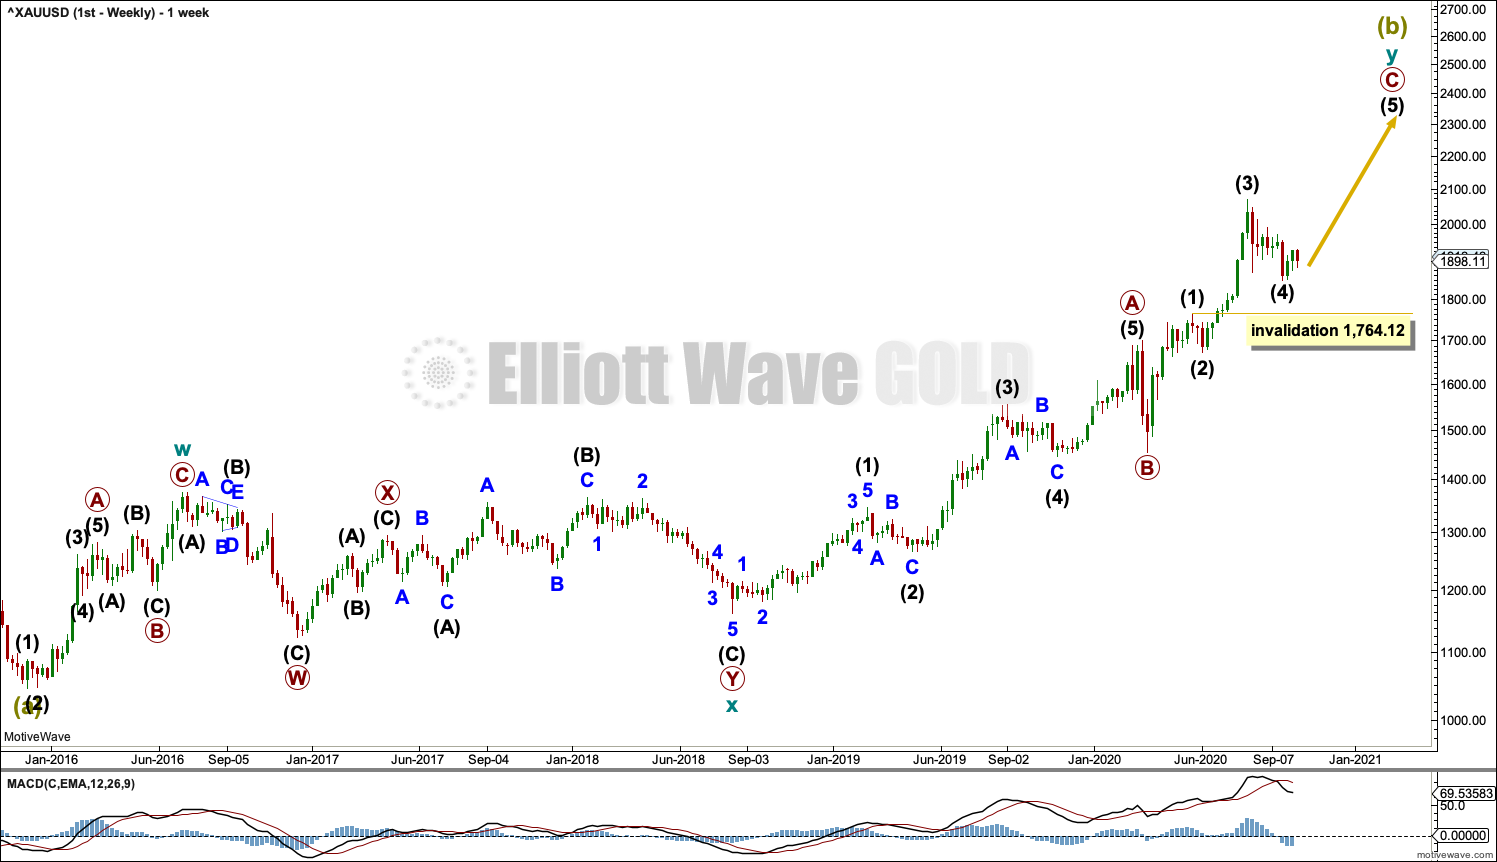
The bigger picture for this first Elliott wave count sees Gold as still within a bear market, in a three steps back pattern that is labelled Grand Super Cycle wave IV on monthly charts. Grand Super Cycle wave IV may be subdividing as an expanded flat pattern. The common range for Super Cycle wave (b) within a flat is from 1 to 1.38 times the length of Super cycle wave (a), giving a range from 1,920.18 to 2,252.27. The target would see Super Cycle wave (b) end within this most common range.
Super Cycle wave (b) within Grand Super Cycle wave IV may be an incomplete double zigzag. When Super Cycle wave (b) may be complete, then this wave count expects Super Cycle wave (c) to begin and to move price below the end of Super Cycle wave (a) at 1,046.27.
The first zigzag in the double is labelled cycle wave w. The double is joined by a three in the opposite direction, a combination labelled cycle wave x. The second zigzag in the double is labelled cycle wave y.
The purpose of the second zigzag in a double is to deepen the correction. Cycle wave y has achieved this purpose.
Primary wave C within cycle wave y may be subdividing as an impulse. Intermediate waves (1) through to (4) within primary wave C may be complete. If it continues any lower, then intermediate wave (4) may not move into intermediate wave (1) price territory below 1,764.12.
We should always assume the trend remains the same until proven otherwise. At this stage, Gold is in a bull market.
DAILY CHART
Click chart to enlarge.
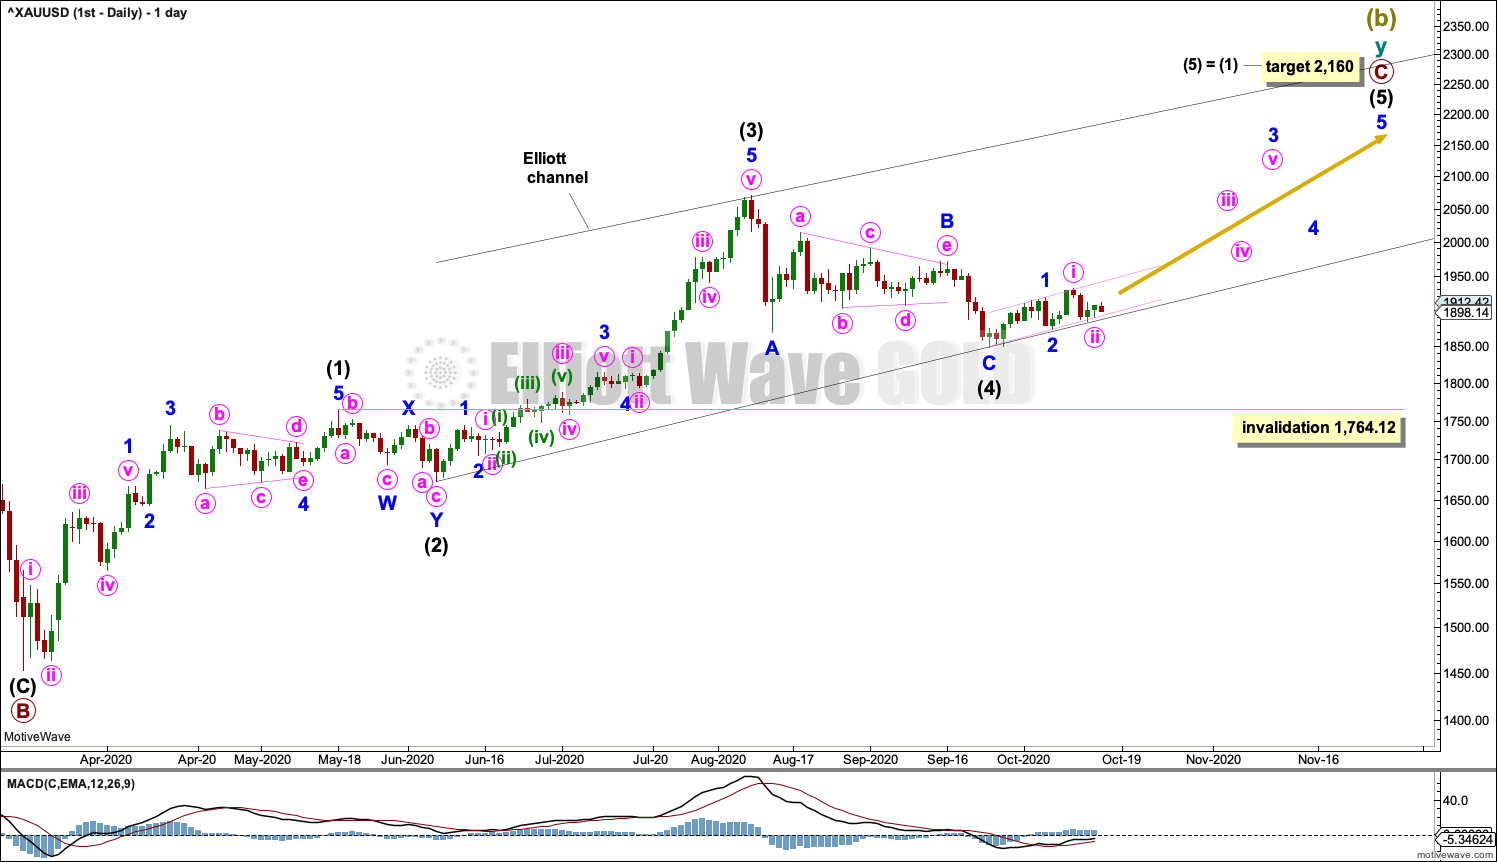
The daily chart shows detail of primary wave C as an incomplete impulse.
Intermediate waves (1) through to (4) within primary wave C may be complete. Intermediate wave (4) may be a complete zigzag.
The channel is redrawn using Elliott’s second technique: the first trend line is drawn from the ends of intermediate waves (2) to (4), then a parallel copy is placed upon the end of intermediate wave (3). Intermediate wave (5) may end either mid way within the channel or about the upper edge. Corrections along the way up may find support about the lower edge. A breach of this channel would reduce the probability of this wave count.
If it continues lower, then intermediate wave (4) may not move into intermediate wave (1) price territory below 1,764.12.
A target is calculated for intermediate wave (5) that expects it to exhibit the most common Fibonacci ratio to intermediate wave (1).
ALTERNATE DAILY CHART
Click chart to enlarge.
It is also possible that a Super Cycle degree trend change has occurred at the last high. However, we should always assume the trend remains the same until proven otherwise. Assume the upwards trend remains in place and the main wave count is correct until the upwards trend is invalidated with a new low below 1,764.12. At that stage, this would become the main wave count.
Intermediate wave (2) may be an incomplete expanded flat correction. Minor wave B within intermediate wave (2) was a 1.14 length of minor wave A, which is within the most common range of 1 to 1.38 times the length of minor wave A.
Minor wave C within intermediate wave (2) would be likely to make a new high above the end of minor wave A at 2,014.05 to avoid a truncation. Intermediate wave (2) may not move beyond the start of intermediate wave (1) above 2,070.48.
Super Cycle wave (c) would be likely to make at least a slight new low below the end of Super Cycle wave (a) at 1,046.27 to avoid a truncation. If price provides confidence in this wave count with a new low below 1,764.12, then a target would be calculated for Super Cycle wave (c) to end.
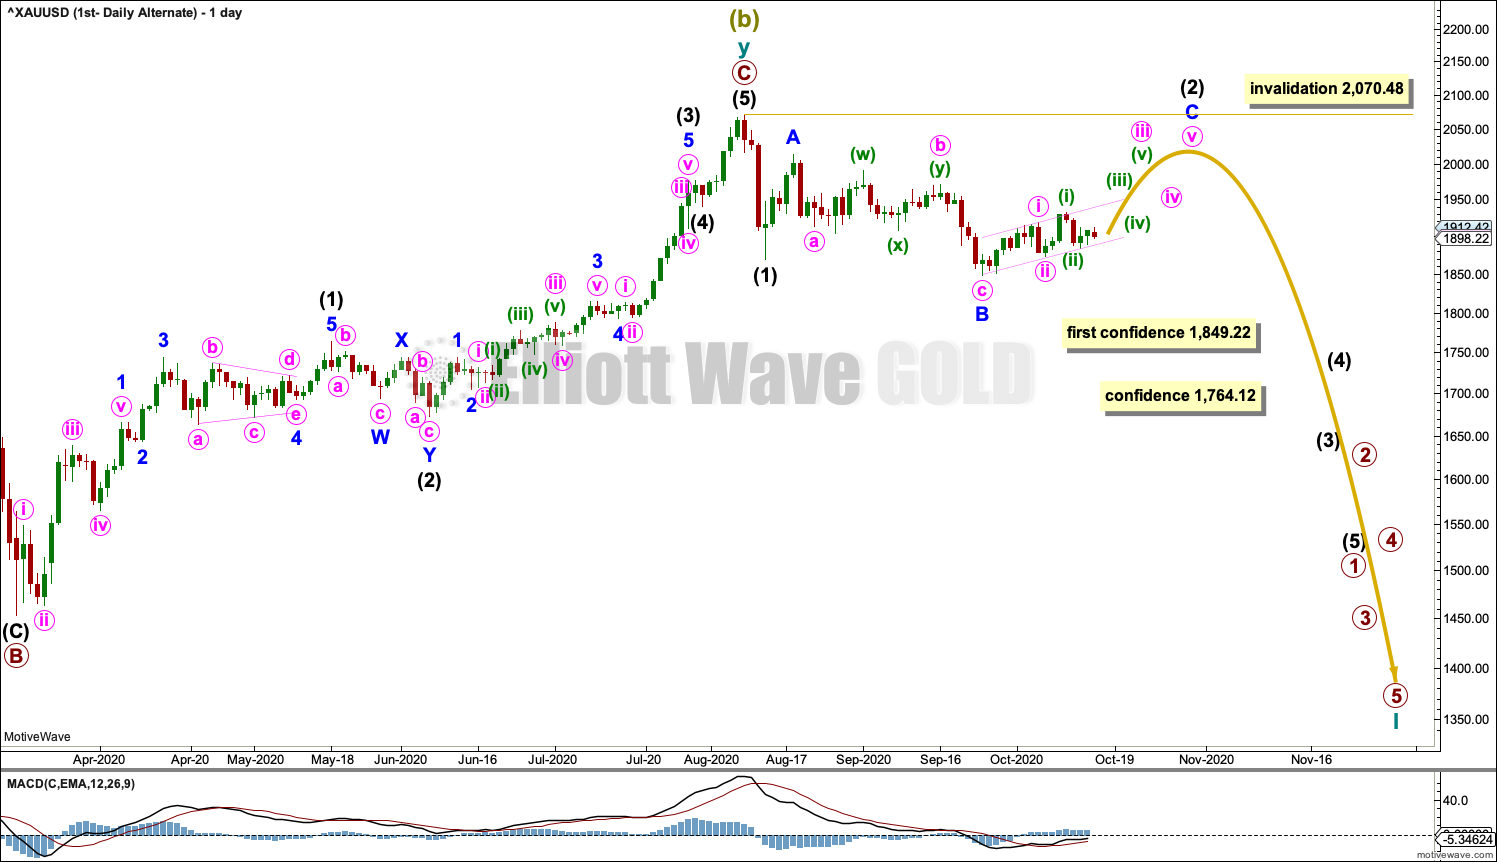
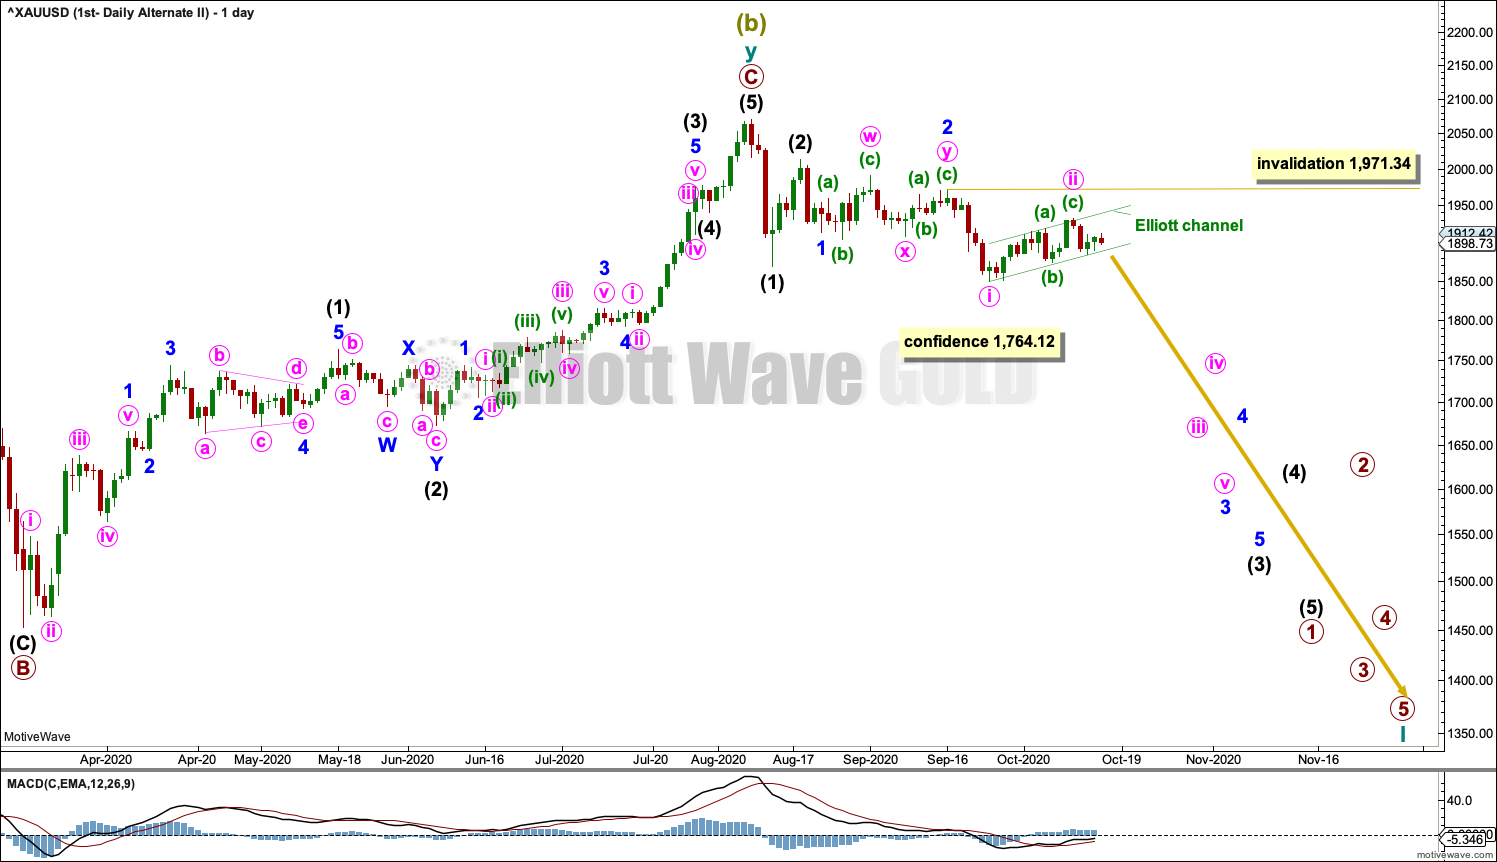
SECOND ALTERNATE DAILY CHART
Click chart to enlarge.
It is possible for this alternate wave count that a series of three first and second waves may be complete. A third wave down may begin to develop strength.
A breach of the green Elliott channel would increase the probability of this second alternate wave count.
Minute wave ii may not move beyond the start of minute wave i above 1,971.34.
A new low below 1,849.22 would add initial confidence to this wave count. A new low below 1,764.12 would add reasonable confidence.
SECOND ELLIOTT WAVE COUNT
WEEKLY CHART
Click chart to enlarge.
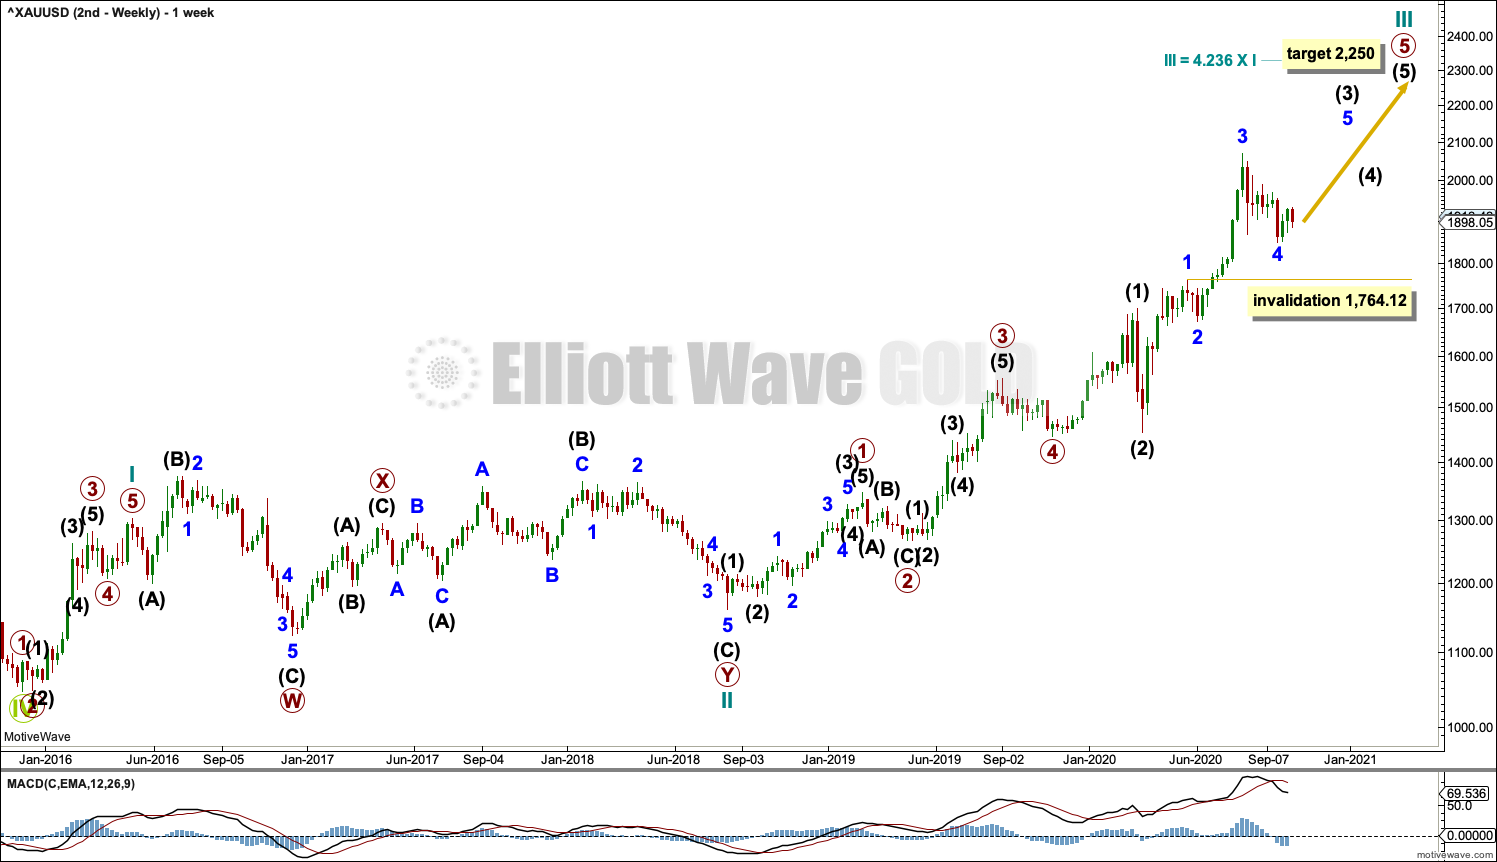
This wave count sees the the bear market complete at the last major low for Gold on 3 December 2015.
If Gold is in a new bull market, then it should begin with a five wave structure upwards on the weekly chart.
Cycle wave I fits as a five wave impulse with reasonably proportionate corrections for primary waves 2 and 4.
Cycle wave II fits as a double flat. However, within the first flat correction labelled primary wave W, this wave count needs to ignore what looks like an obvious triangle from July to September 2016 (this can be seen labelled as a triangle on the first wave count above). This movement must be labelled as a series of overlapping first and second waves. Ignoring this triangle reduces the probability of this wave count in Elliott wave terms.
Cycle wave III may be incomplete. Minor wave 4 within primary wave 5 may not move into minor wave 1 price territory below 1,764.12.
DAILY CHART
Click chart to enlarge.
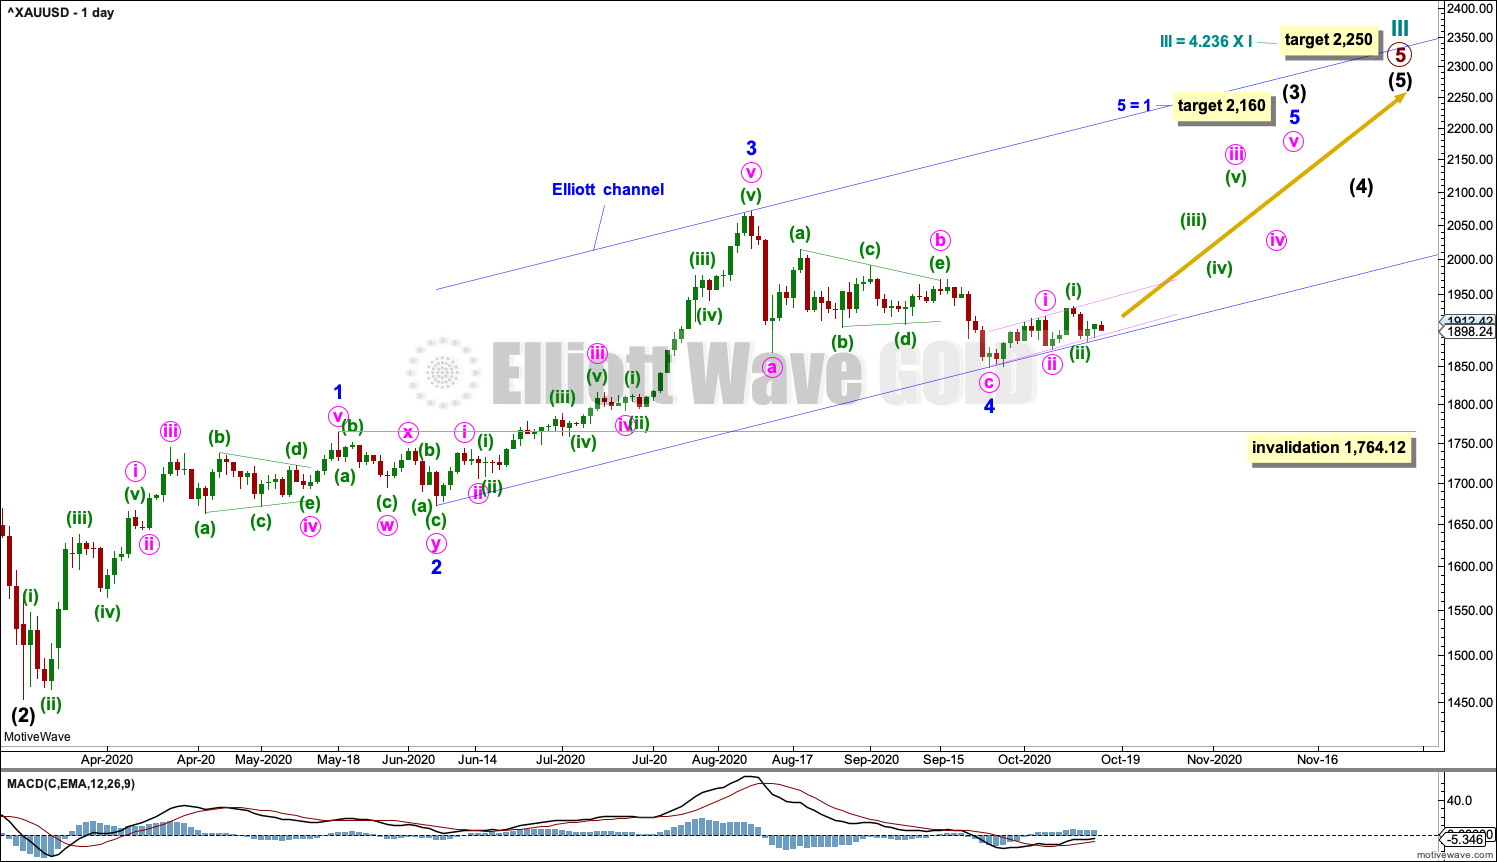
Cycle wave III may be incomplete. The daily chart focusses on primary wave 5 within cycle wave III.
Minor wave 4 may be a complete zigzag. Minute wave b within the zigzag may be a complete triangle.
If minor wave 4 continues lower, then it may not move into minor wave 1 price territory below 1,764.12.
The channel about intermediate wave (3) is drawn using Elliott’s second technique.
TECHNICAL ANALYSIS
WEEKLY CHART
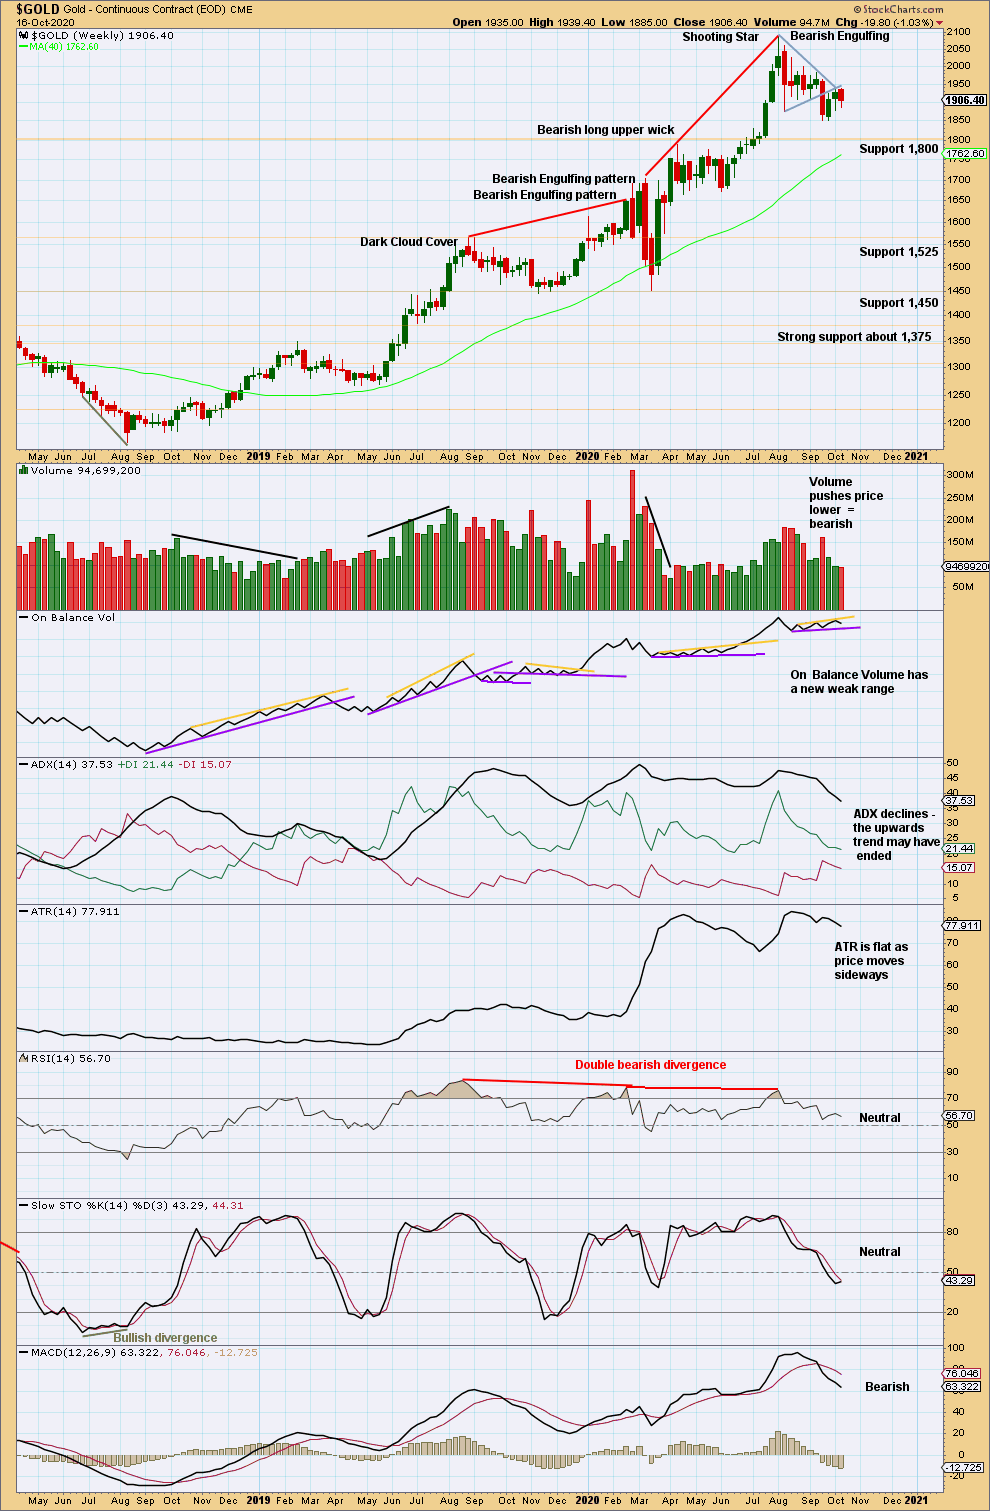
Click chart to enlarge. Chart courtesy of StockCharts.com.
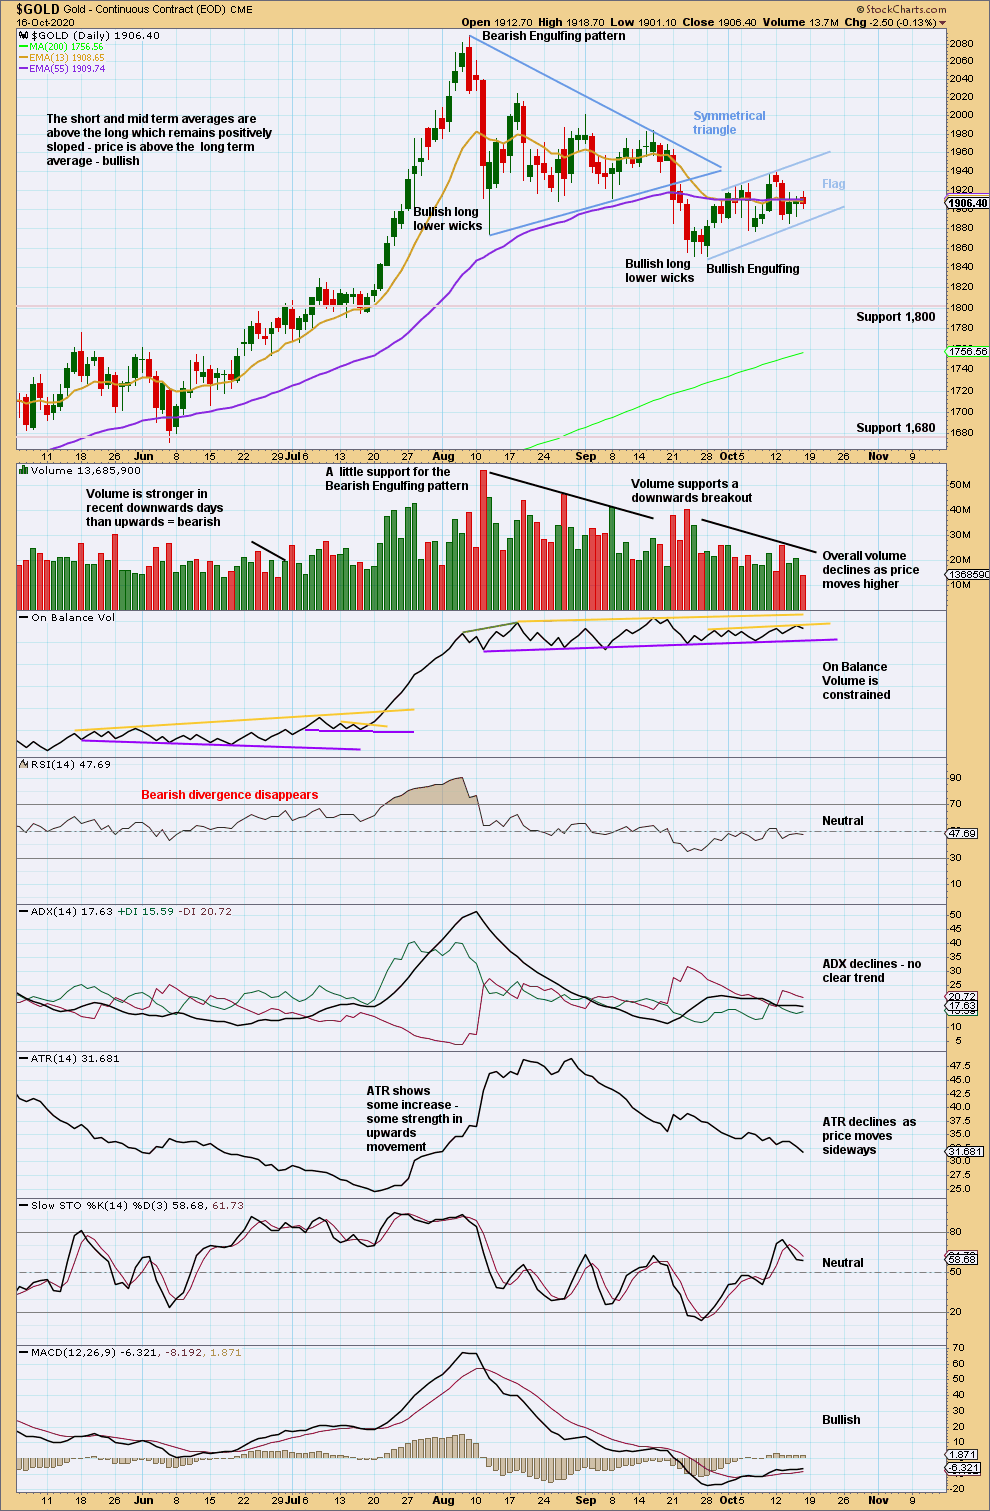
Price has broken out downwards from a small triangle. Look for next support about 1,800.
At the last high were two bearish candlestick patterns with overbought RSI exhibiting double bearish divergence. It is possible there may have been a 180° trend change at the high. A new swing low below 1,671.70 would add confidence in that view.
Upwards movement again last week lacks support from volume, but that does not mean this may not be the first week of a multi-week rise to new all time highs. Early stages of trends for Gold do not always begin with strength; there are prior examples on this chart.
So far price is finding resistance about the lower edge of the small triangle trend line. On Balance Volume is at resistance. This week this view remains the same.
DAILY CHART
Click chart to enlarge. Chart courtesy of StockCharts.com.
A flag pattern may have formed. A target calculated from the flag pole would be about 1,754. A downwards breakout from the flag would be required before confidence in this target may be had. A downwards breakout does not require support from volume for confidence; but, when volume does confirm a downwards breakout, it is impressive.
The best performing flags and pennants complete within 15 or fewer sessions. So far this possible flag pattern has lasted 15 sessions. If a breakout does not occur on Monday, then the usefulness of this possible flag will decline.
GDX WEEKLY CHART
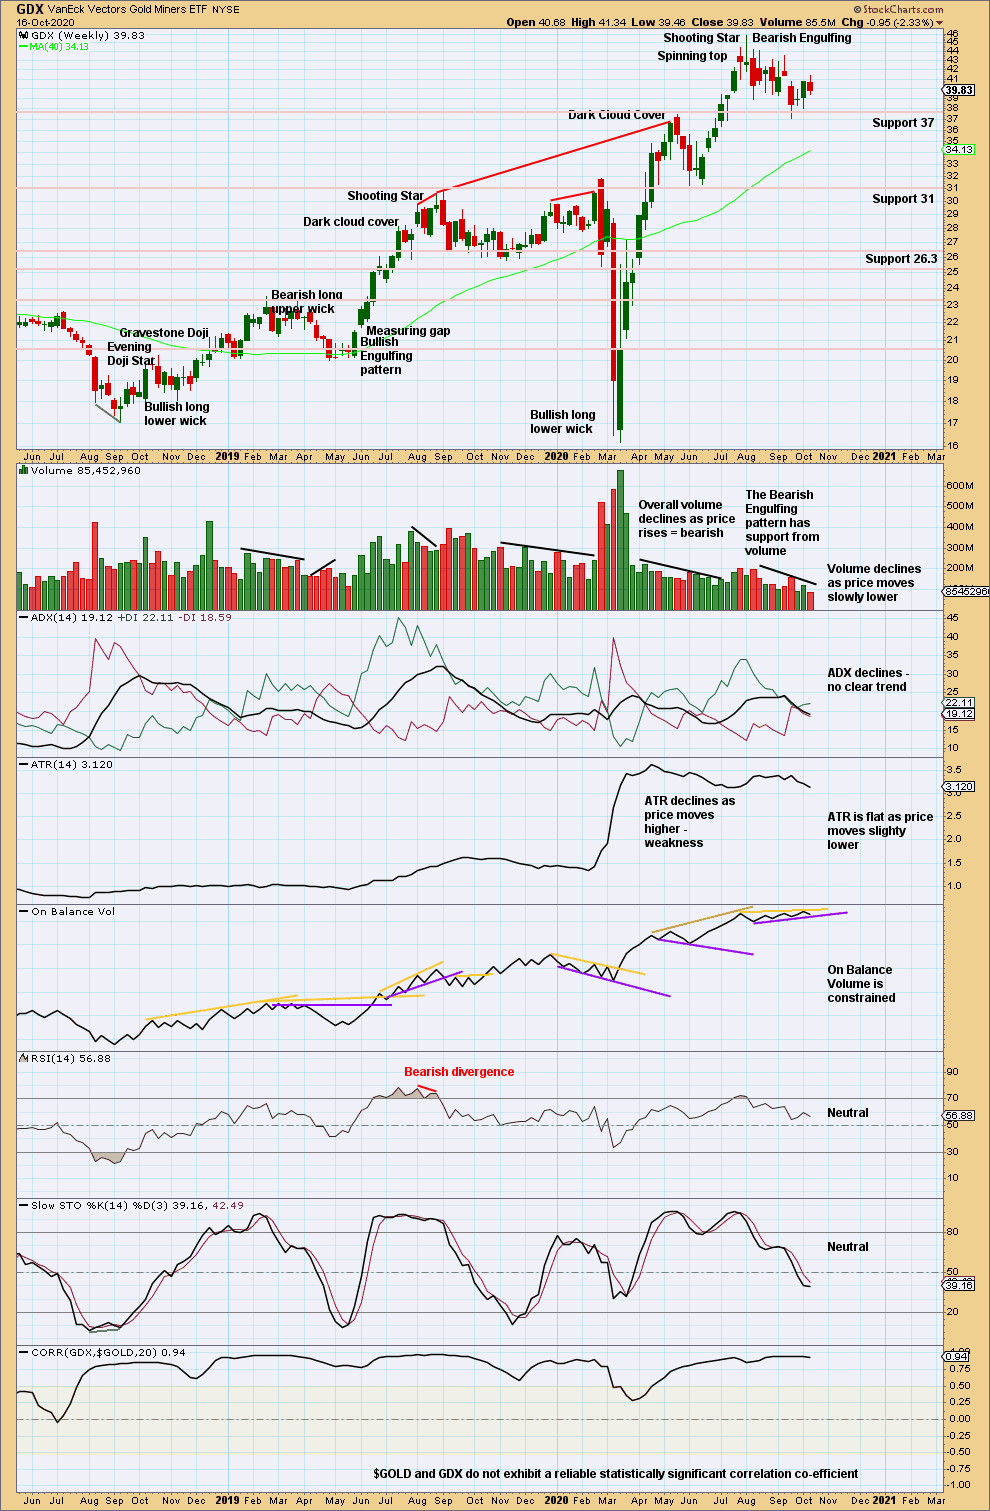
Click chart to enlarge. Chart courtesy of StockCharts.com.
Overall, the choppy nature of downwards movement looks like a pullback within an ongoing larger bull market for GDX. This pullback may move lower before it is complete. A new low below 31.22 of the 1st of June would indicate a trend change.
GDX DAILY CHART
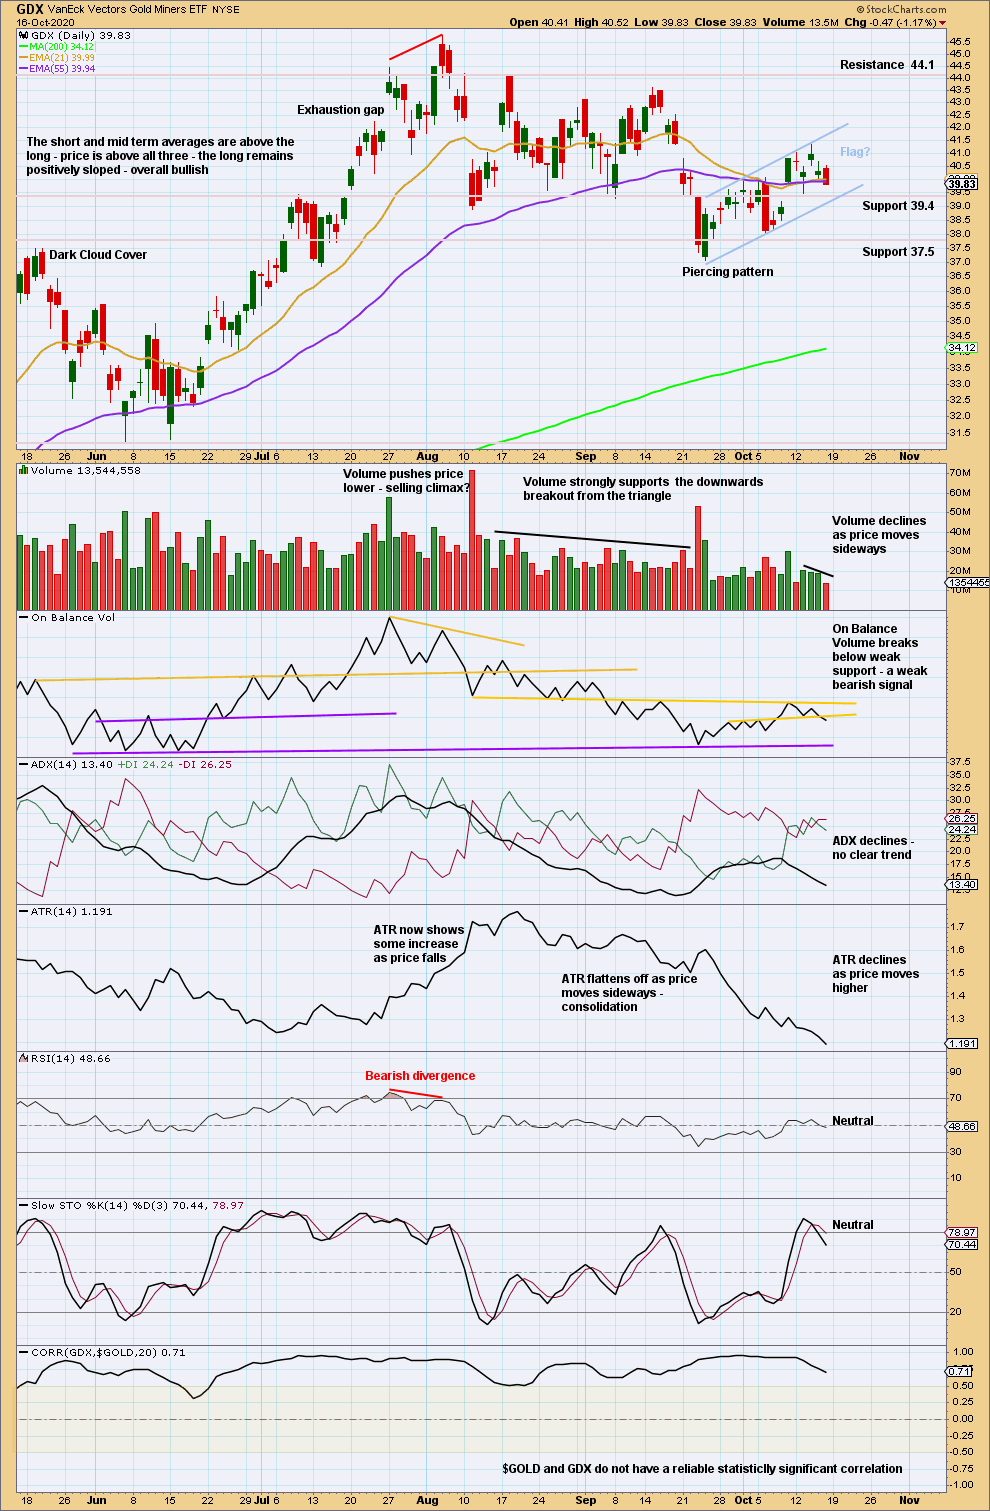
Click chart to enlarge. Chart courtesy of StockCharts.com.
A flag pattern may be completing on GDX. This pattern may now be in its 17th session, so the reliability of it is now declining. If a downwards breakout below the lower flag trend line occurs, then a target at 32.73 may be used.
US OIL
Price remains range bound with another sideways week.
Summary: Downwards movement may break below support and continue lower.
A multi-week pullback is expected to end about 23.05. It is possible the pullback may be deeper than this though; the first major correction within a new trend for Oil tends to be very deep.
When this pullback may be complete, then an upwards trend should resume with increased strength.
Oil may have found a major sustainable low in April 2020.
ELLIOTT WAVE COUNT
MONTHLY CHART
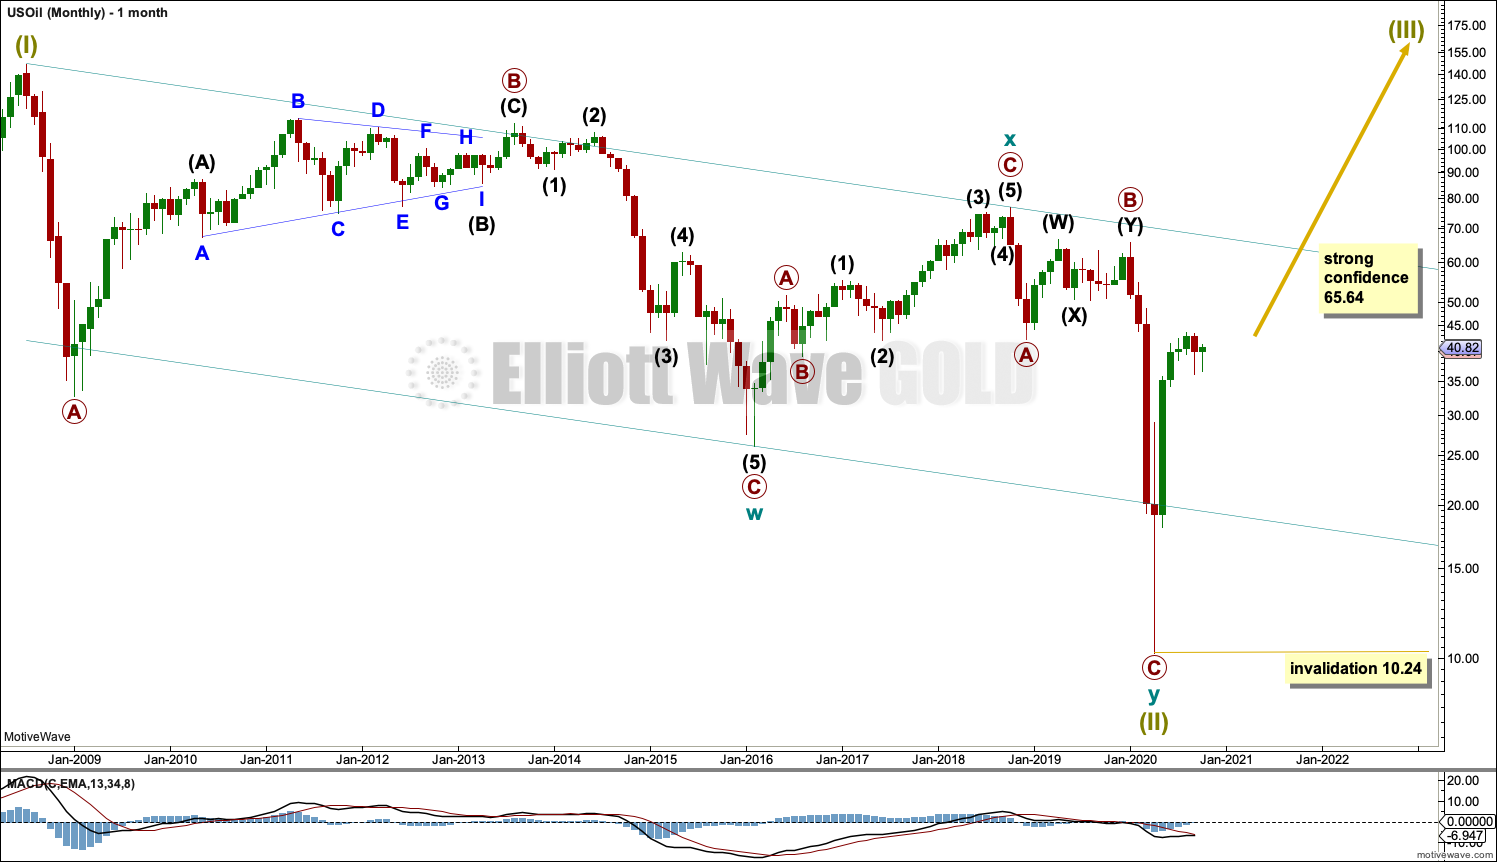
Click chart to enlarge.
The basic Elliott wave structure is five steps forward and three steps back. This Elliott wave count expects that US Oil has completed a three steps back pattern, which began in July 2008. The Elliott wave count expects that the bear market for US Oil may now be over.
A channel is drawn about Super Cycle wave (II): draw the first trend line from the start of cycle wave w to the end of cycle wave x, then place a parallel copy on the end of cycle wave w. Price has bounced up off the channel. This trend line is breached, which is a typical look for the end of a movement for a commodity.
The upper edge of the channel may provide resistance.
Following five waves up and three steps back should be another five steps up; this is labelled Super Cycle wave (III), which may only have just begun. Super Cycle wave (III) may last a generation and must make a new high above the end of Super Cycle wave (I) at 146.73.
Super Cycle wave (III) may only subdivide as a five wave impulse. New trends for Oil usually start out very slowly with short first waves and deep time consuming second wave corrections. Basing action over a few years may now have begun.
WEEKLY CHART
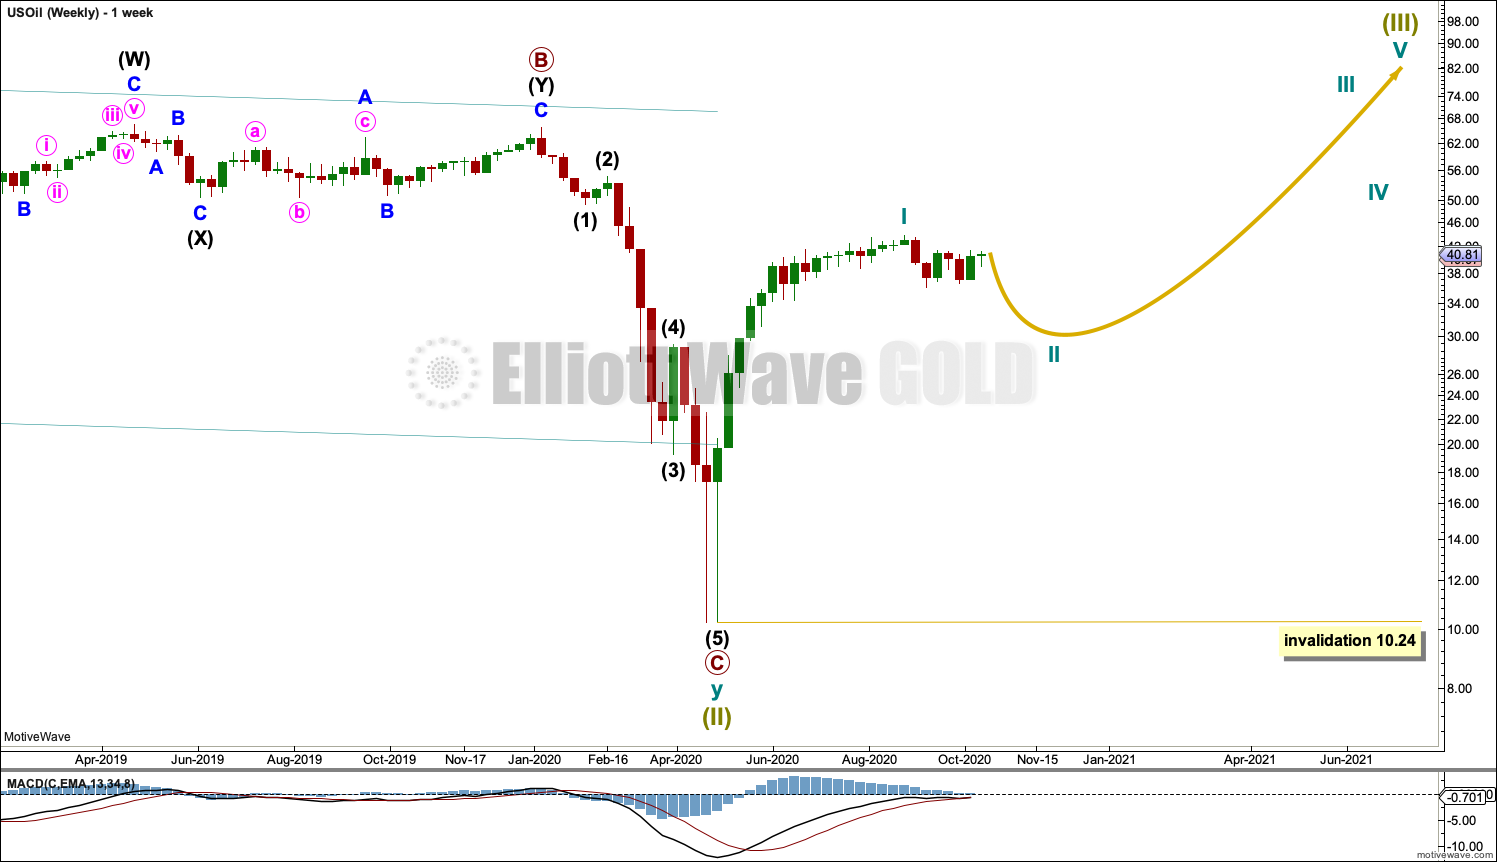
Click chart to enlarge.
Super Cycle wave (III) must subdivide as an impulse. Cycle wave I within the impulse may be complete. Cycle wave II may not move beyond the start of cycle wave I below 10.24.
DAILY CHART
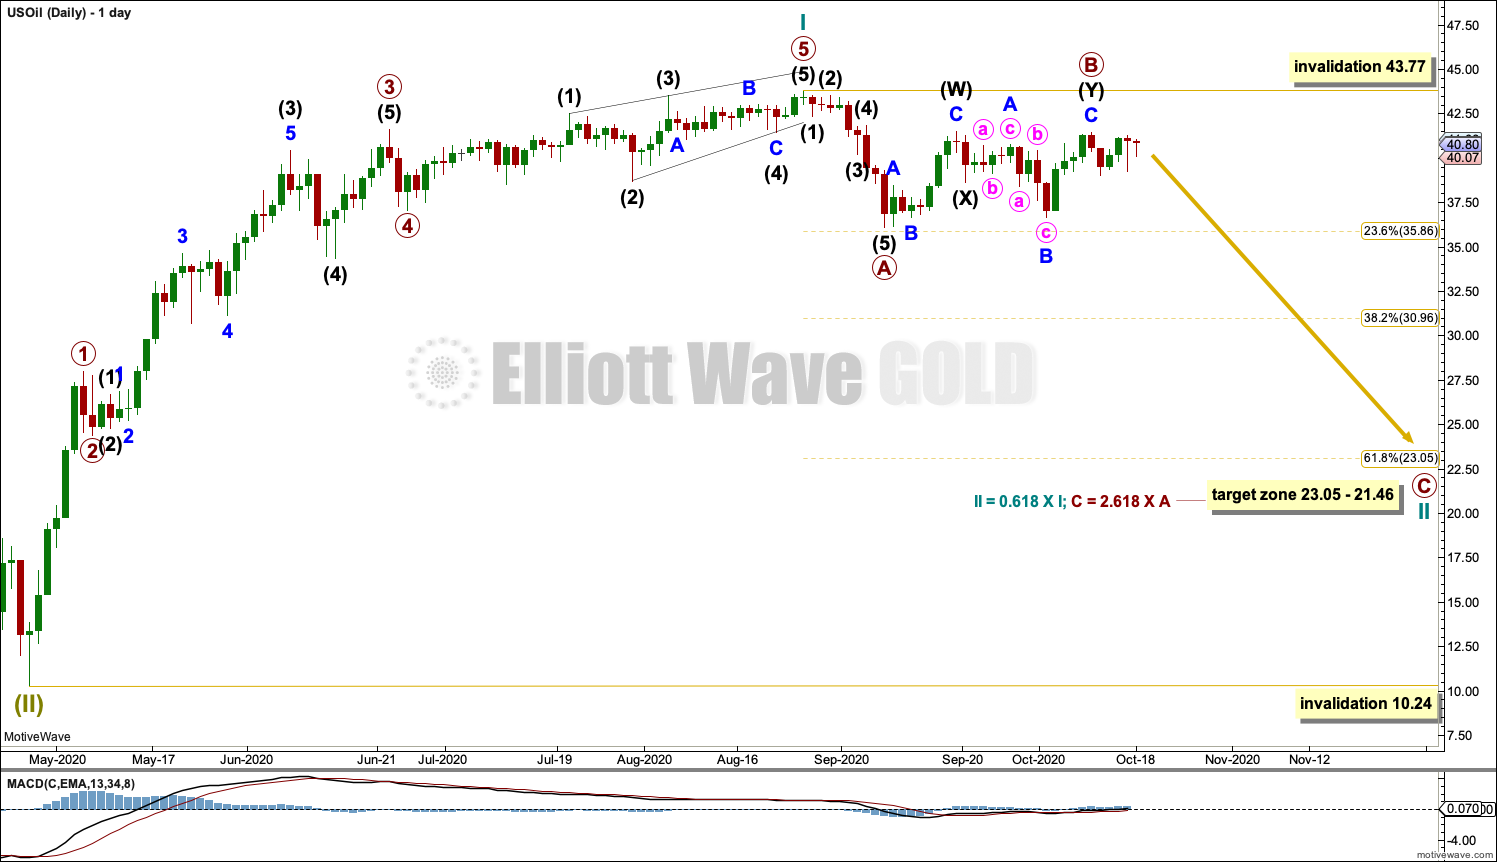
Click chart to enlarge.
Cycle wave I now looks very likely to be over.
Cycle wave II may subdivide as any corrective Elliott wave structure except a triangle. At this stage, cycle wave II may be an incomplete zigzag that may end close to the 0.382 Fibonaccci ratio.
Primary wave B may be a completed double combination: zigzag – X – expanded flat. If primary wave B continues further as a triple combination, then it may not move beyond the start of primary wave A above 43.77.
Primary wave (C) downwards may begin.
Cycle wave II may not move beyond the start of cycle wave I below 10.24.
FIRST ALTERNATE DAILY CHART
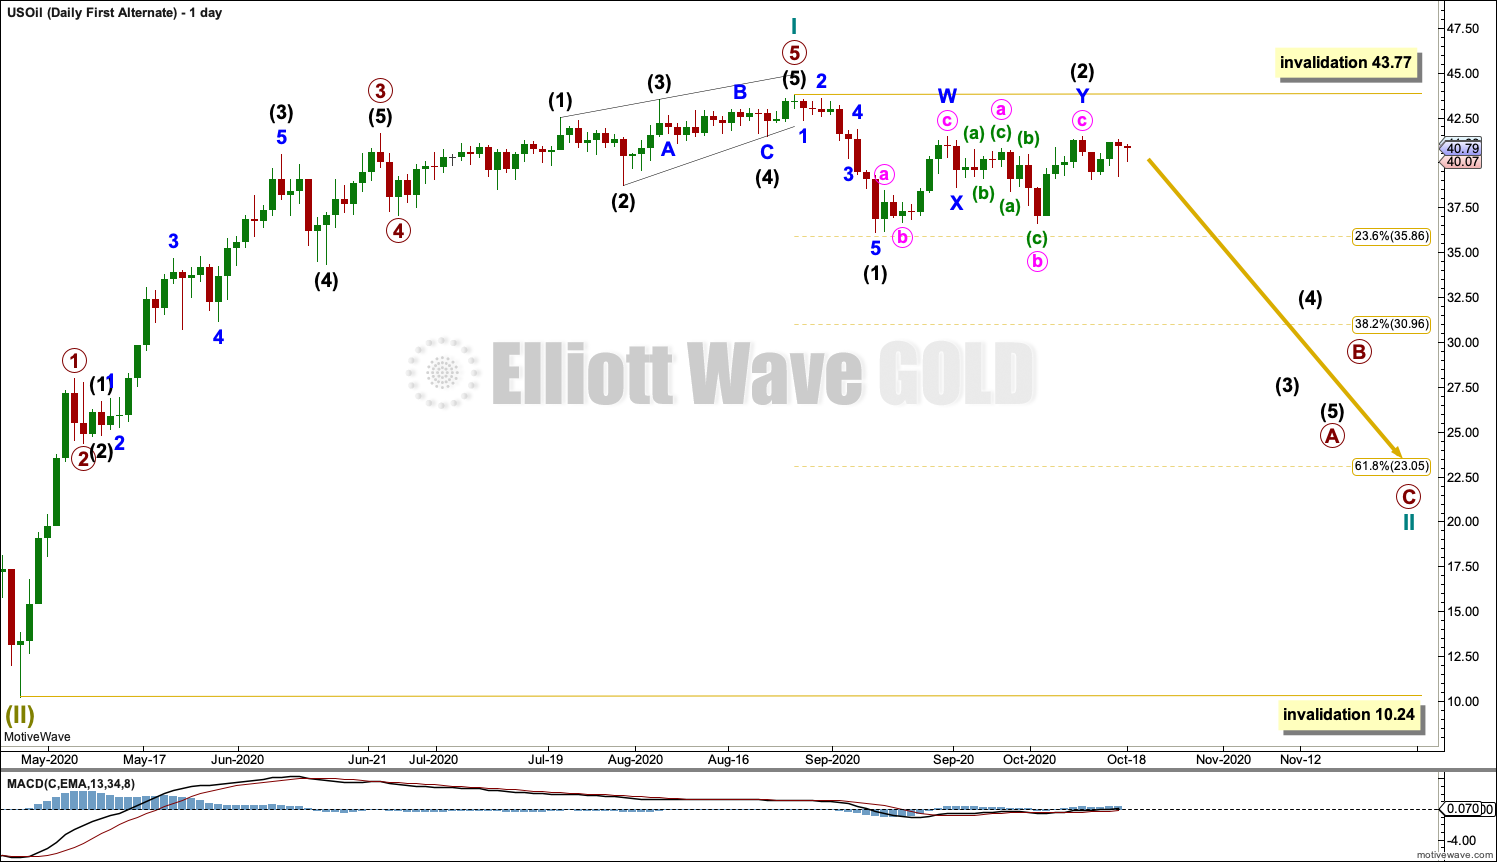
Click chart to enlarge.
This first alternate wave count moves the degree of labelling within cycle wave II down one degree.
Cycle wave II may be subdividing as a zigzag. Primary wave A within cycle wave II may be an incomplete impulse.
Intermediate wave (2) may be a complete double combination.
Intermediate wave (2) within primary wave A may not move beyond the start of intermediate wave (1) above 43.77.
The 0.618 Fibonacci ratio of cycle wave I at 23.05 is a preferred target, but it is possible that cycle wave II may be deeper than this.
Although this wave count is named an alternate, it has about an even probability with the main wave count above.
SECOND ALTERNATE DAILY CHART
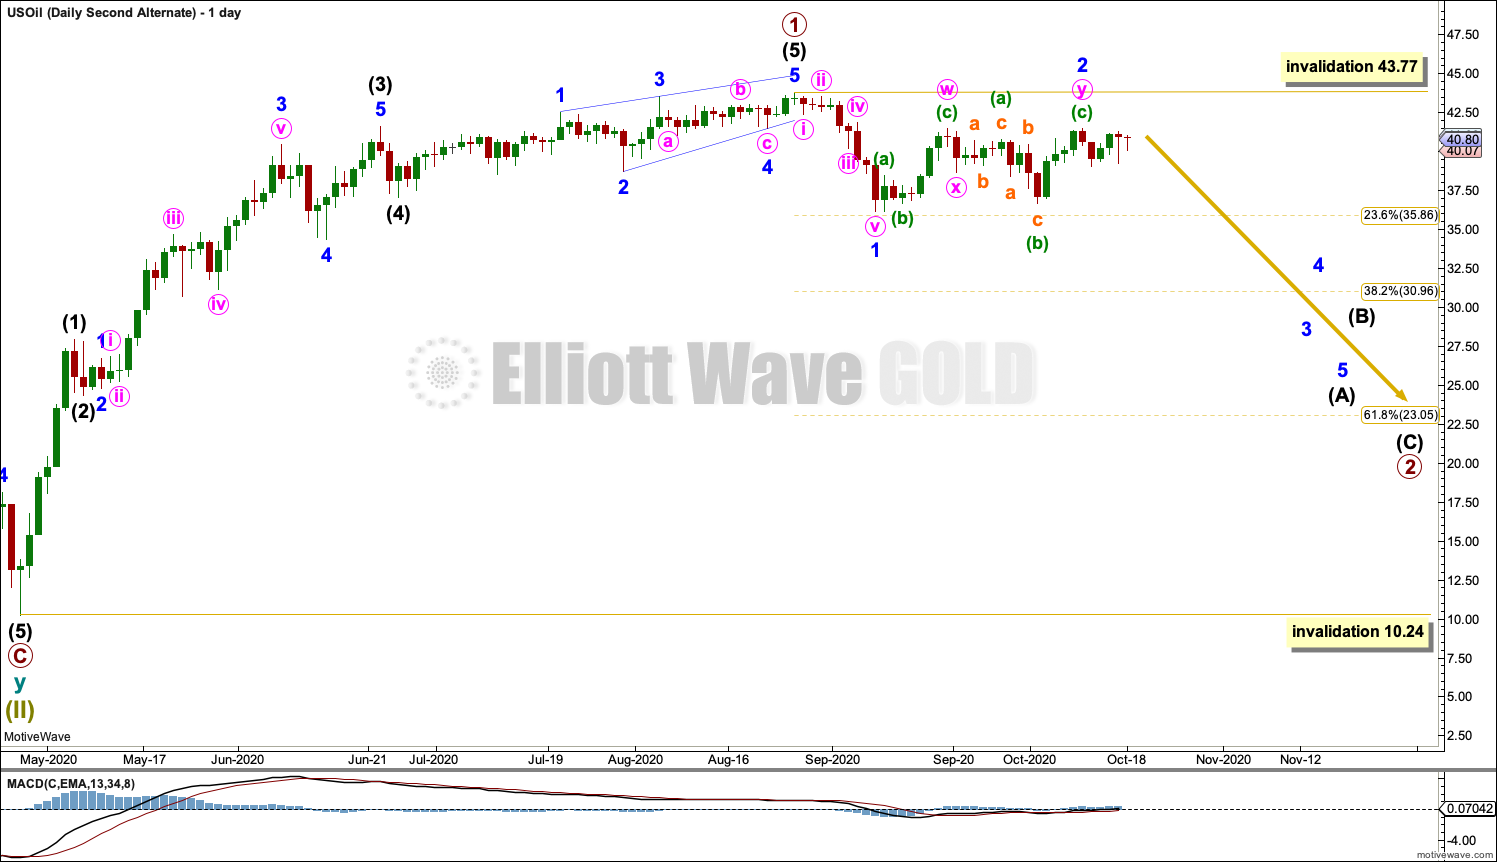
Click chart to enlarge.
It is also possible that the degree of labelling at the daily chart level may need to be changed back down one degree. It may be that only primary wave 1 is complete within cycle wave I and the current pullback may be primary wave 2.
Primary wave 2 may last several weeks to a few months.
TECHNICAL ANALYSIS
WEEKLY CHART
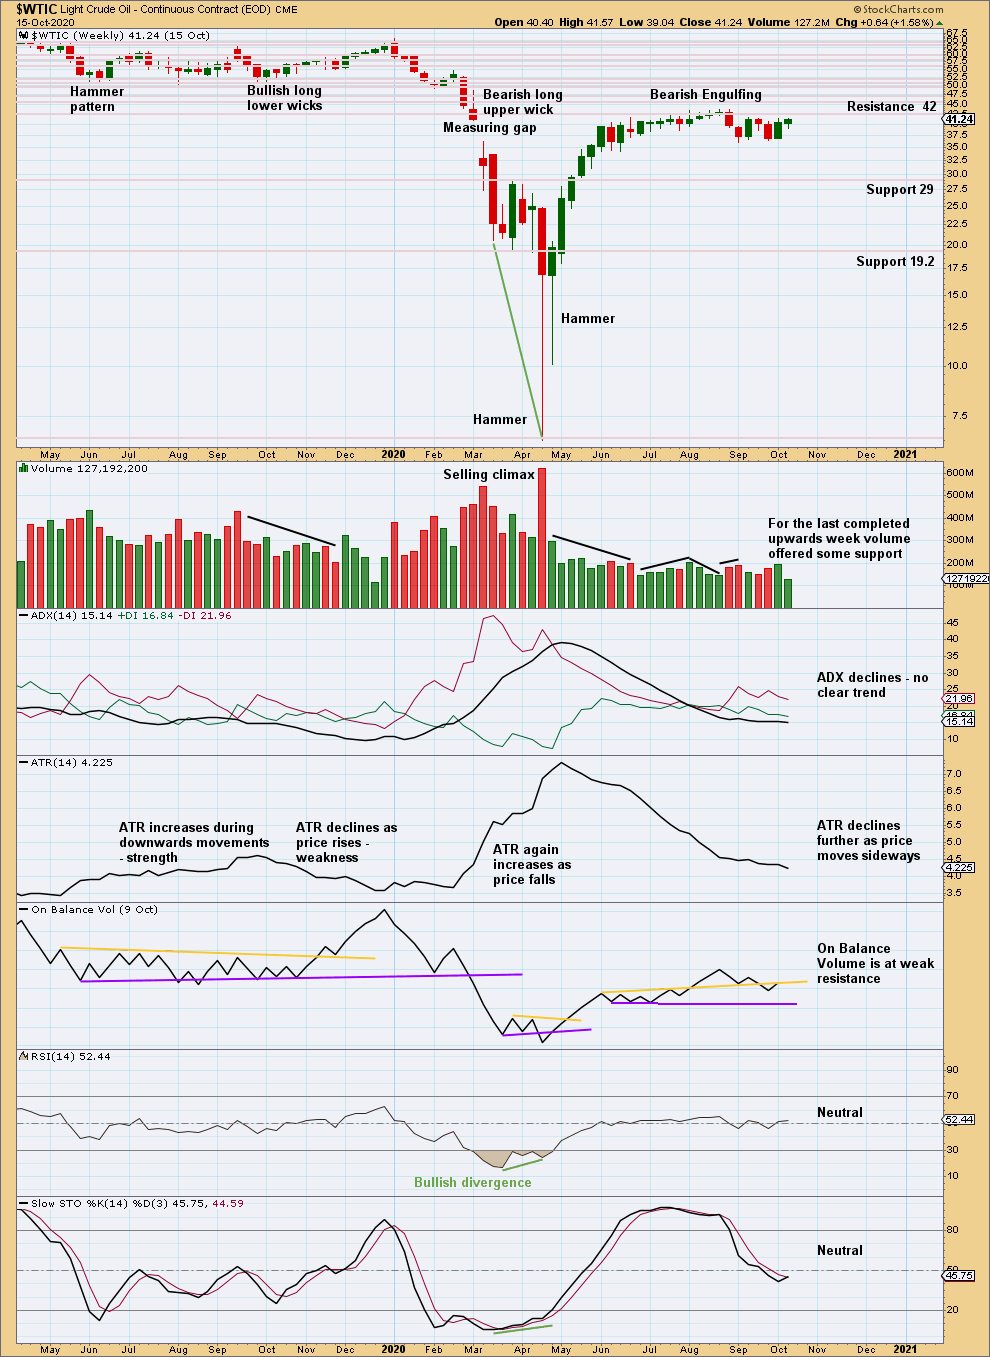
Click chart to enlarge. Chart courtesy of StockCharts.com.
Price has not yet reached support. Stochastics is not yet oversold. There is room for more downwards movement. Overall, volume is light as price moves sideways.
DAILY CHART
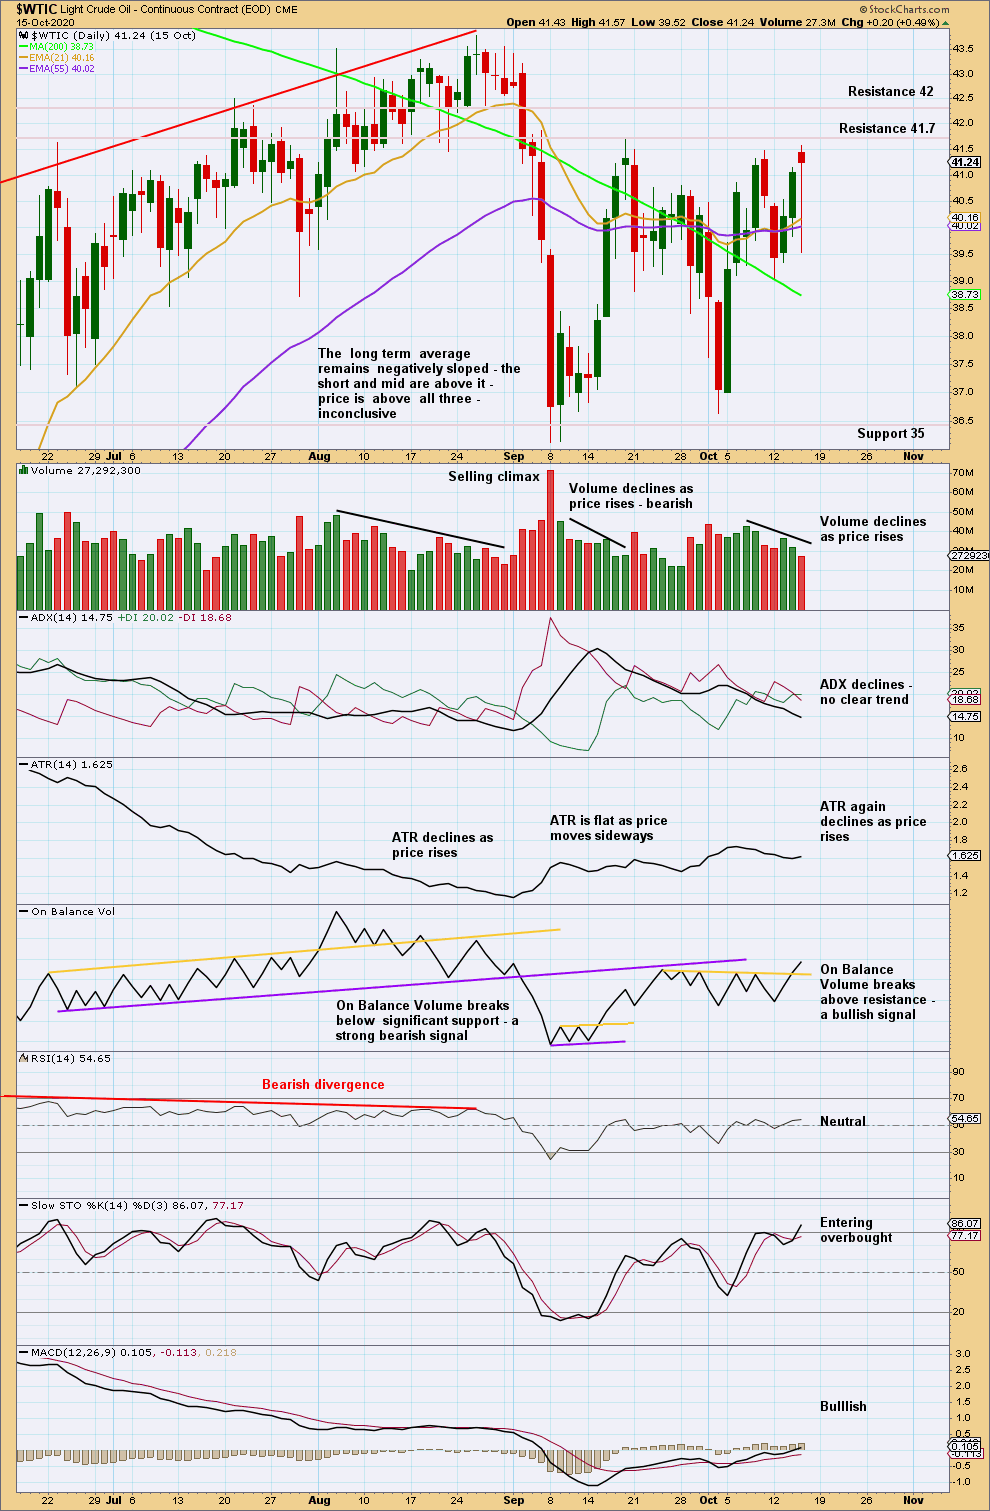
Click chart to enlarge. Chart courtesy of StockCharts.com.
Price is range bound, swinging from support to resistance. At this point, price is near resistance and Stochastics is entering overbought. The end to this upwards swing and the start of a downwards swing about here may be expected.
—
Always practice good risk management as the most important aspect of trading. Always trade with stops and invest only 1-5% of equity on any one trade. Failure to manage risk is the most common mistake new traders make.