
USD Index: Elliott Wave and Technical Analysis | Charts – October 20, 2020
Summary: The bearish Elliott wave count expects a downwards trend has begun. The long-term target is re-calculated at 77.80.
The bullish Elliott wave count expects a third wave up is beginning. The first target is at 138.62.
The price point which differentiates the two counts is still 88.25. A new low below this point would invalidate the bullish count and provide confidence in the bearish count. To the upside, a new high now above 102.99 would provide some confidence in the bullish count.
BEARISH ELLIOTT WAVE ANALYSIS
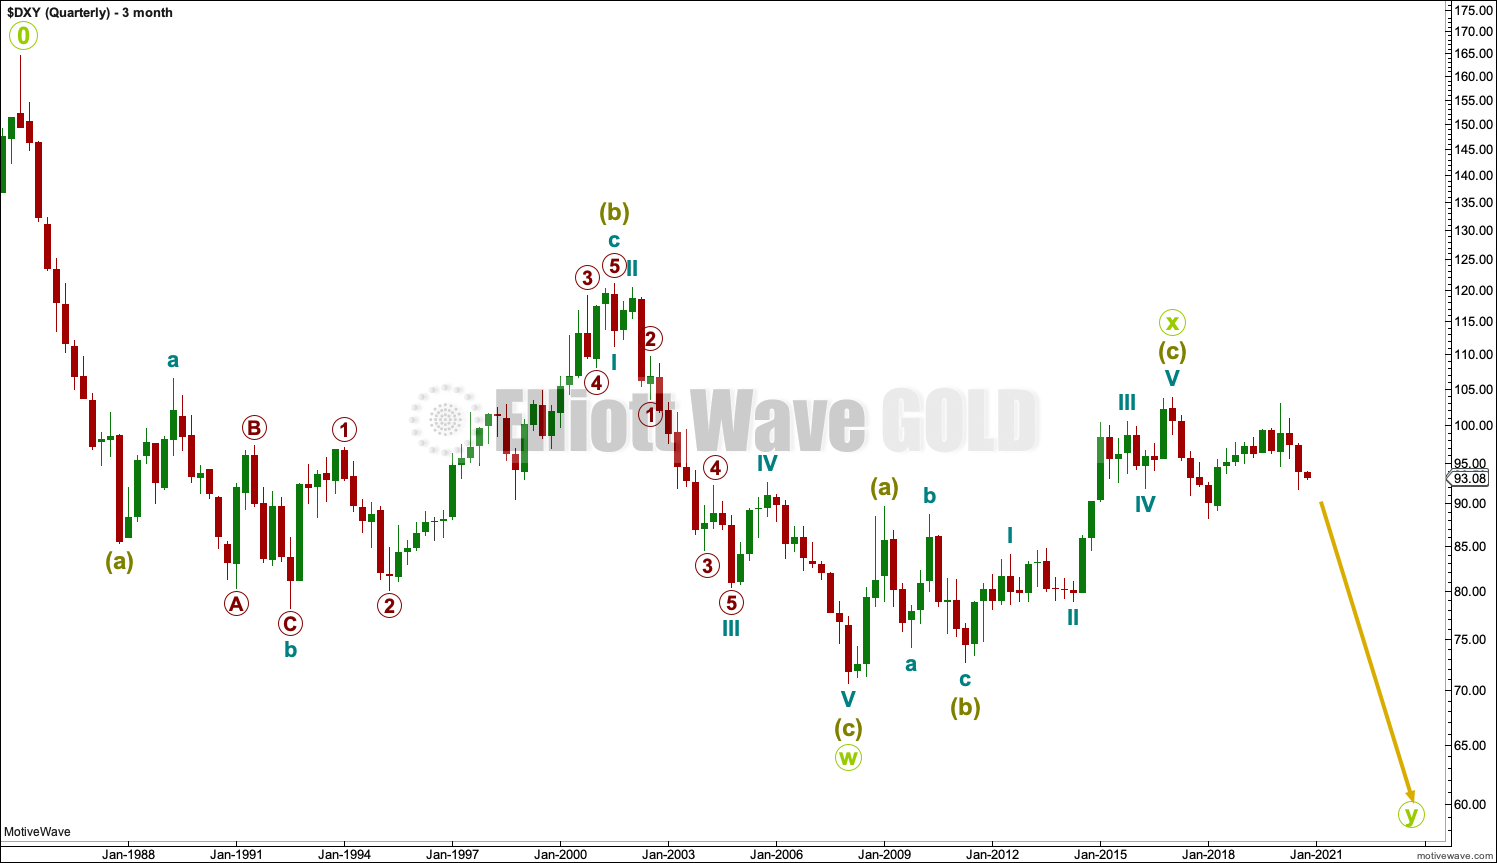
QUARTERLY CHART
Click chart to enlarge.
The wave count begins at 0.
This wave count assumes that the high labelled 0 ended a five wave impulse up. The Elliott wave structure of five steps forward should be followed by three steps back.
A huge double zigzag may be continuing lower.
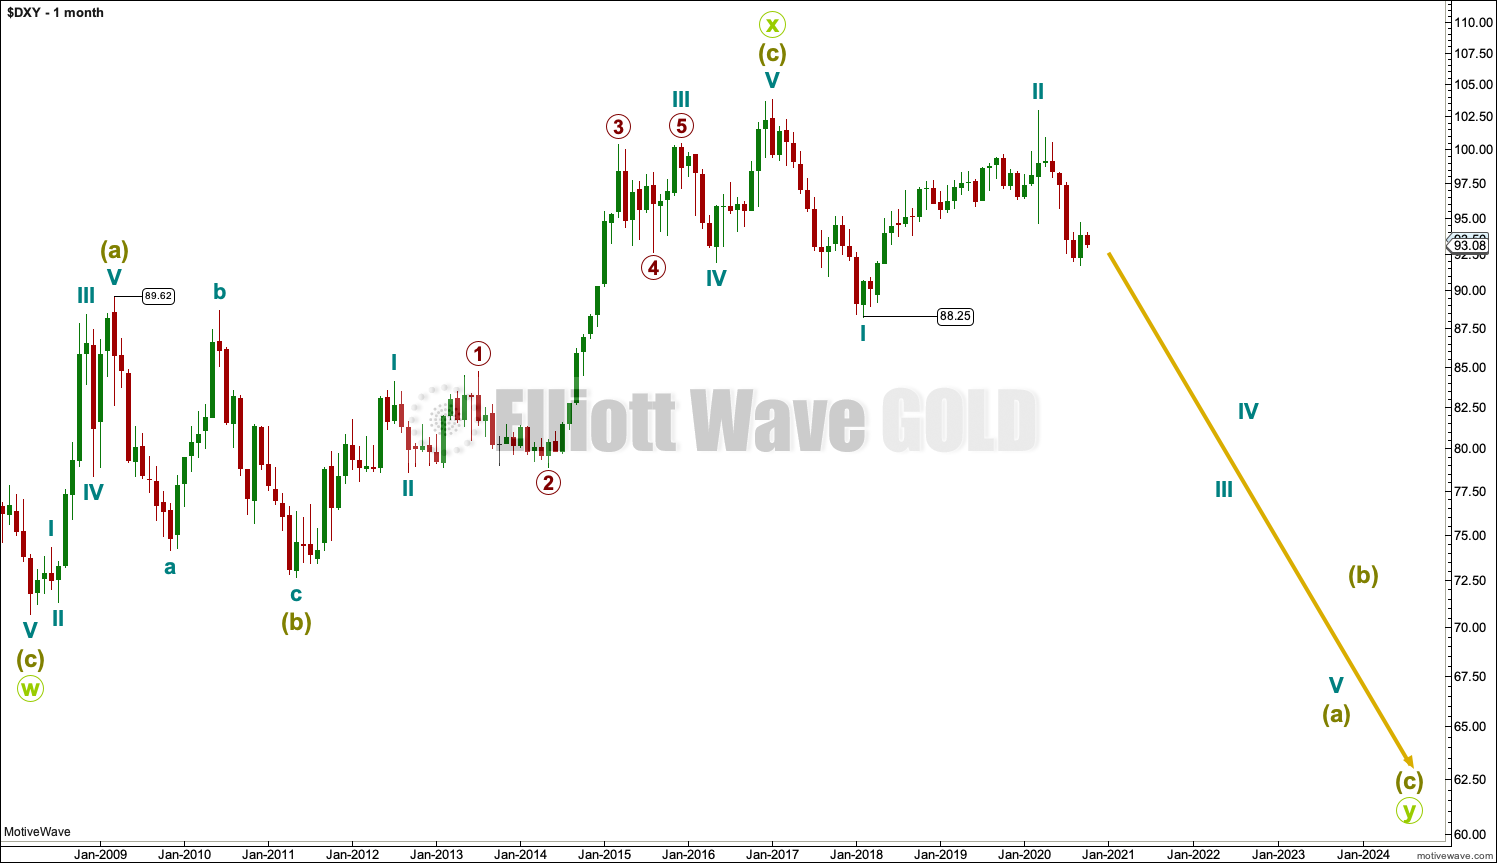
MONTHLY CHART
Click chart to enlarge.
Downwards movement from the high in January 2017 cannot be a fourth wave correction within an ongoing impulse higher because a new low below 89.62 would be back in first wave price territory.
That indicates the last big wave up may be a completed three, and for that reason this is still my slightly preferred wave count.
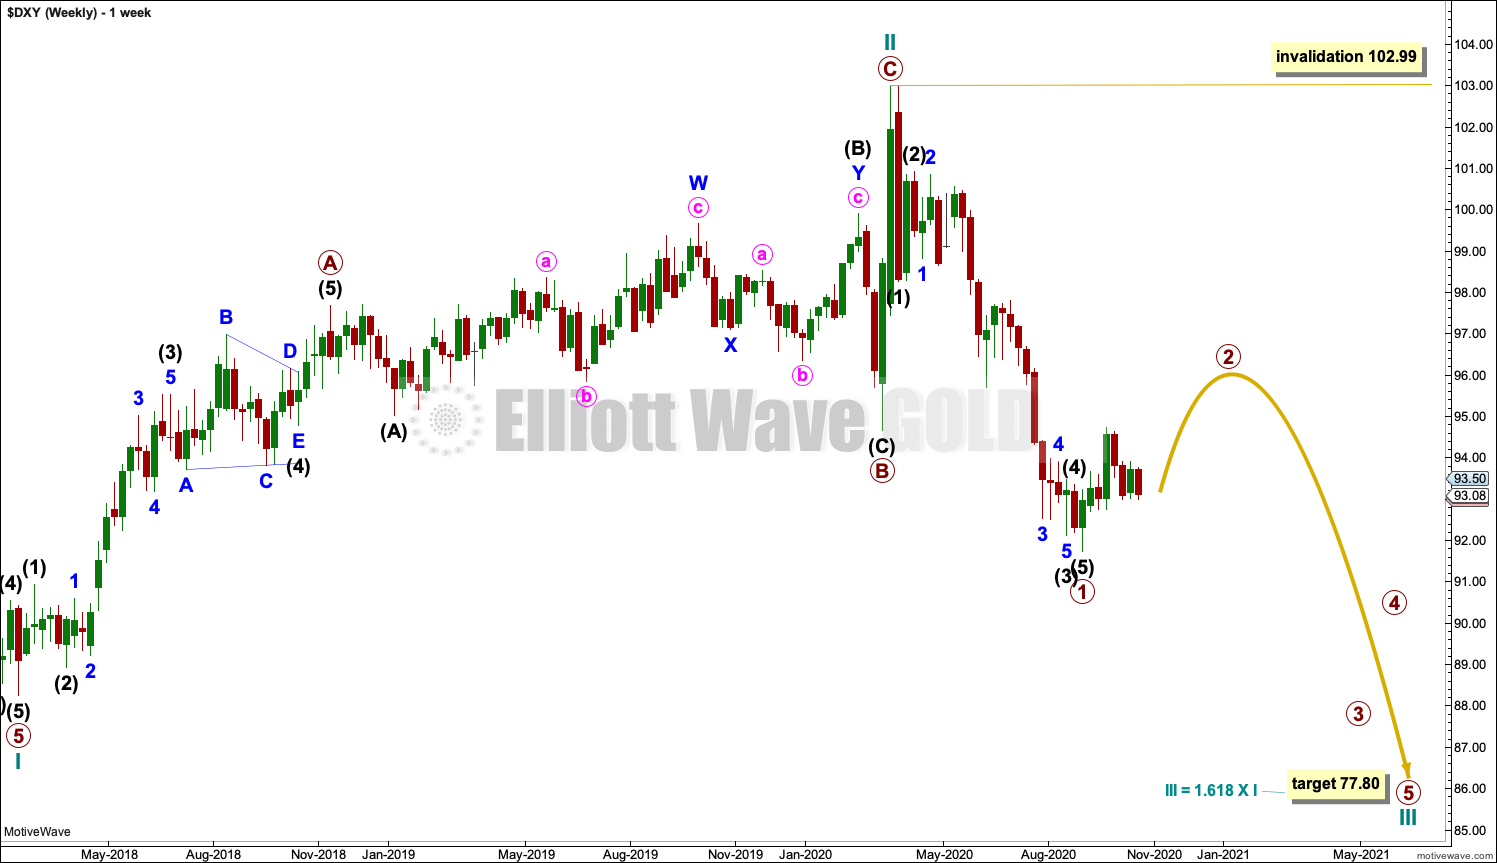
WEEKLY CHART
Click chart to enlarge.
Cycle wave I downwards fits very well as a five wave impulse. This may be reasonably expected to be followed by a three wave structure upwards.
For the USD Index, historically the first second wave correction within a new trend is usually extremely deep, about 0.80 to 0.90 of the first wave it corrects. Cycle wave II may have continued higher within the last year to now be 0.95 the depth of cycle wave I, following normal behaviour.
Cycle wave II may be complete as a zigzag, which is the most common type of corrective structure.
Primary wave A may be a completed five wave impulse.
Primary wave B may be a completed expanded flat.
Primary wave C may be a completed five wave impulse.
The target for cycle wave III expects a common Fibonacci ratio to cycle wave I. Within cycle wave III, no second wave correction may move beyond its start above 102.99.
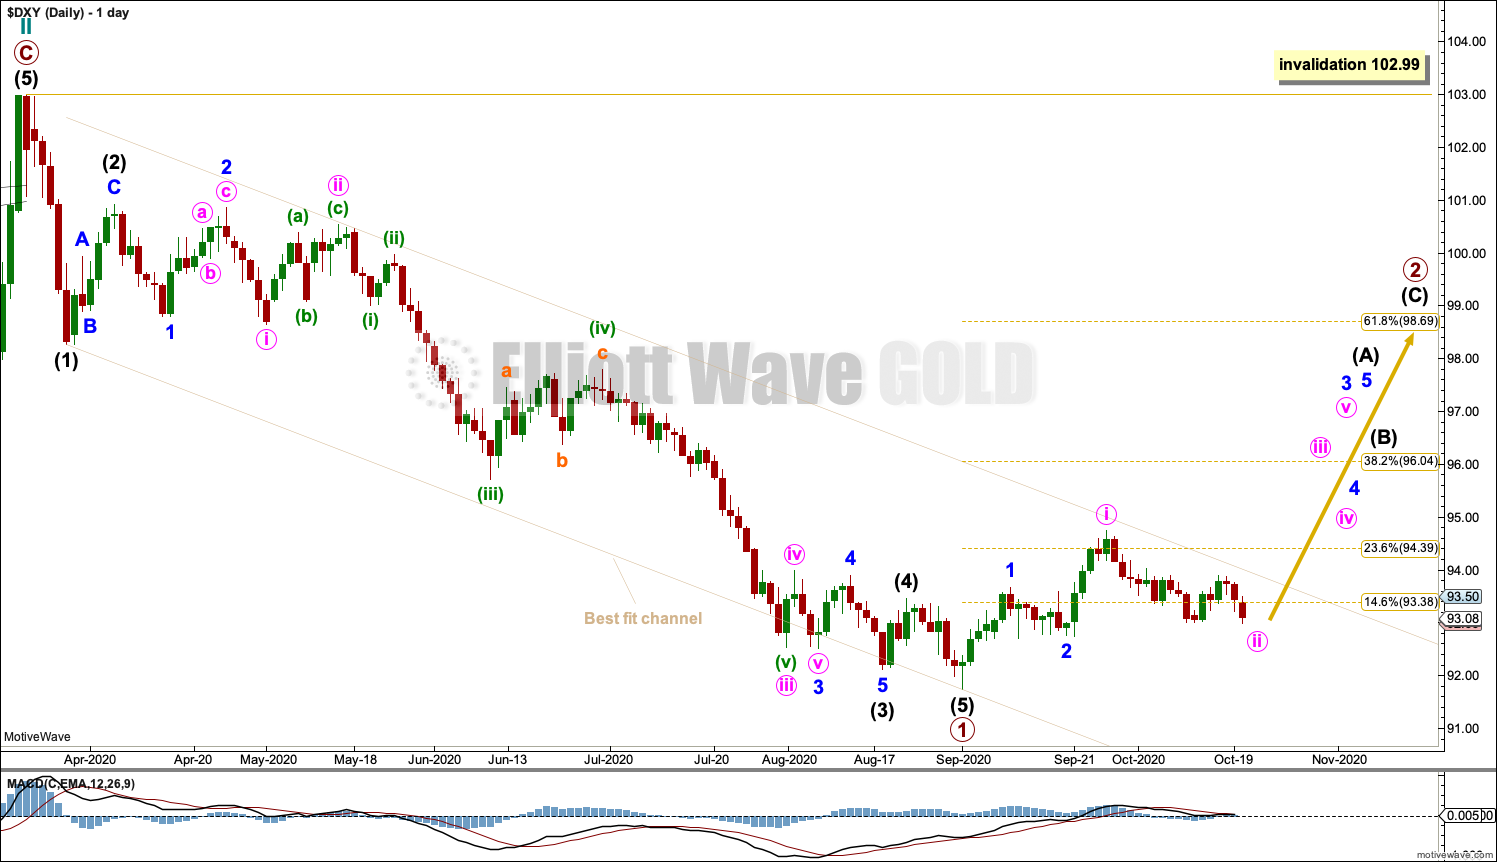
DAILY CHART
Click chart to enlarge.
It is possible that primary wave 1 may be over and primary wave 2 may have just begun. This fits with classic technical analysis at the weekly chart level. However, this chart comes with the strong caveat that a breach of the best fit trend channel is required for confidence in it.
While price remains within the channel, it is also possible that primary wave 1 may continue lower, so labelling within it may need to change.
Primary wave 2 should last several more weeks. It may end about the 0.618 Fibonacci ratio of primary wave 1. Primary wave 2 may not move beyond the start of primary wave 1 above 102.99.
BULLISH ELLIOTT WAVE ANALYSIS
QUARTERLY CHART
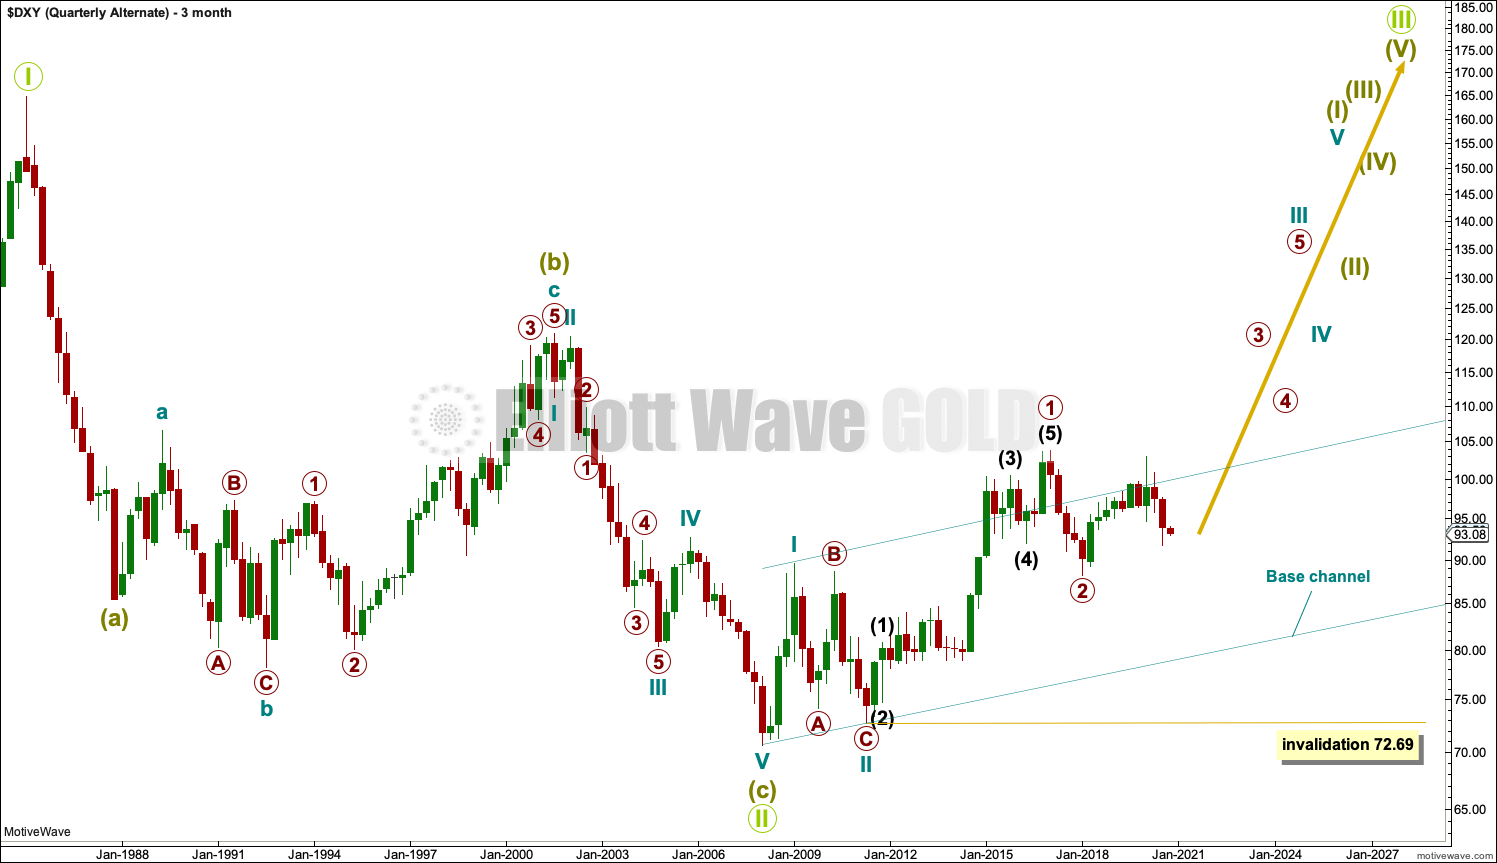
Click chart to enlarge.
A single zigzag down to the last major low may still be complete.
A new upwards trend may continue. So far there may be two overlapping first and second waves. Primary wave 2 may not move beyond the start of primary wave 1 below 72.69.
Primary wave 2 should find strong support at the lower edge of the teal base channel if it gets down that low.
MONTHLY CHART
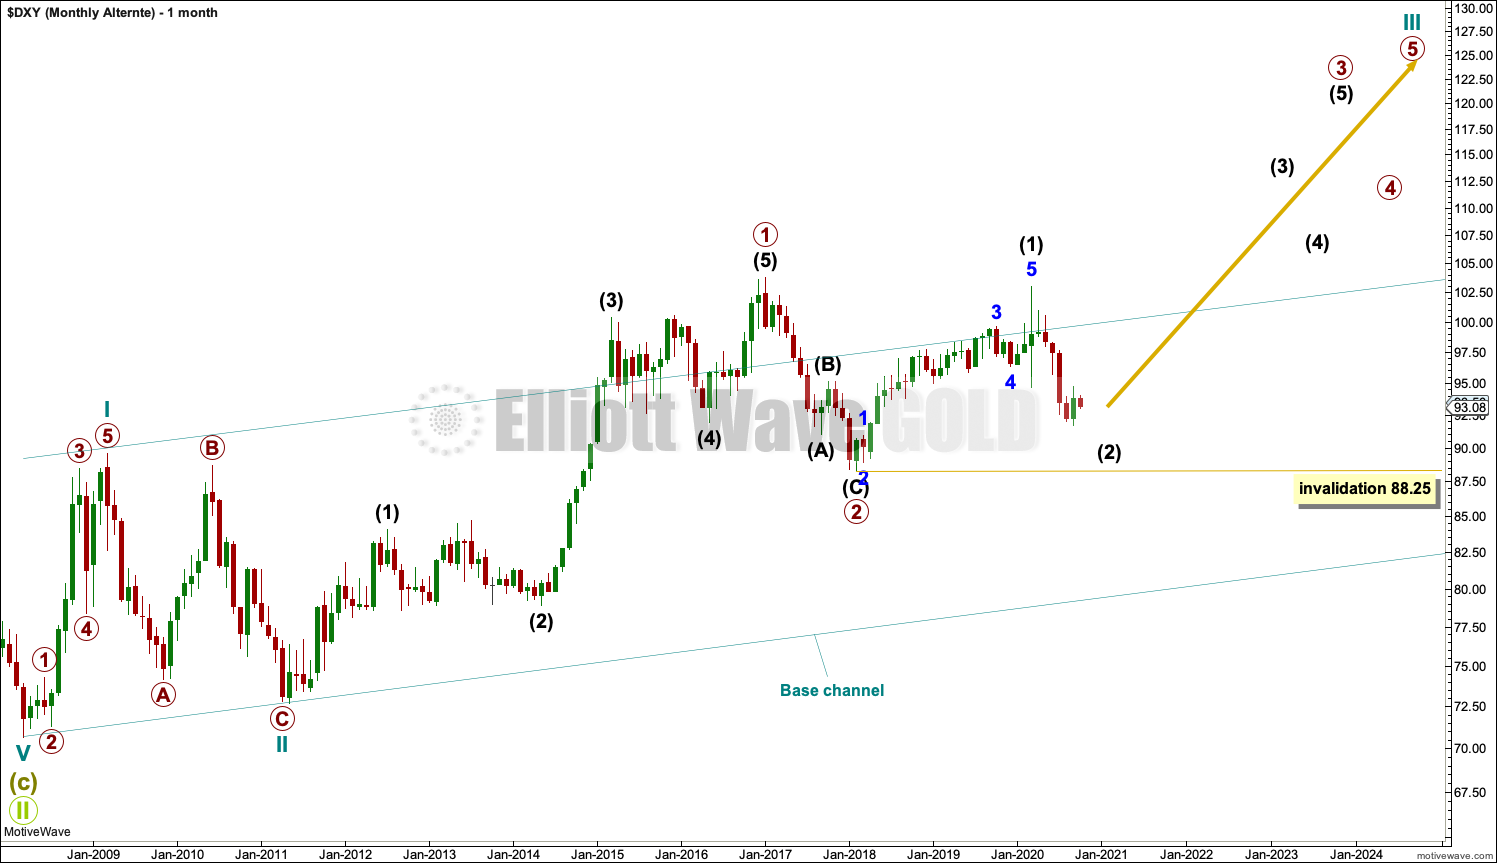
Click chart to enlarge.
Primary wave 2 may be a complete zigzag. However, this wave down can also be seen as a five and primary wave 2 may yet continue lower. The final invalidation point for this bullish wave count would be the point noted on the quarterly chart at 72.69.
WEEKLY CHART
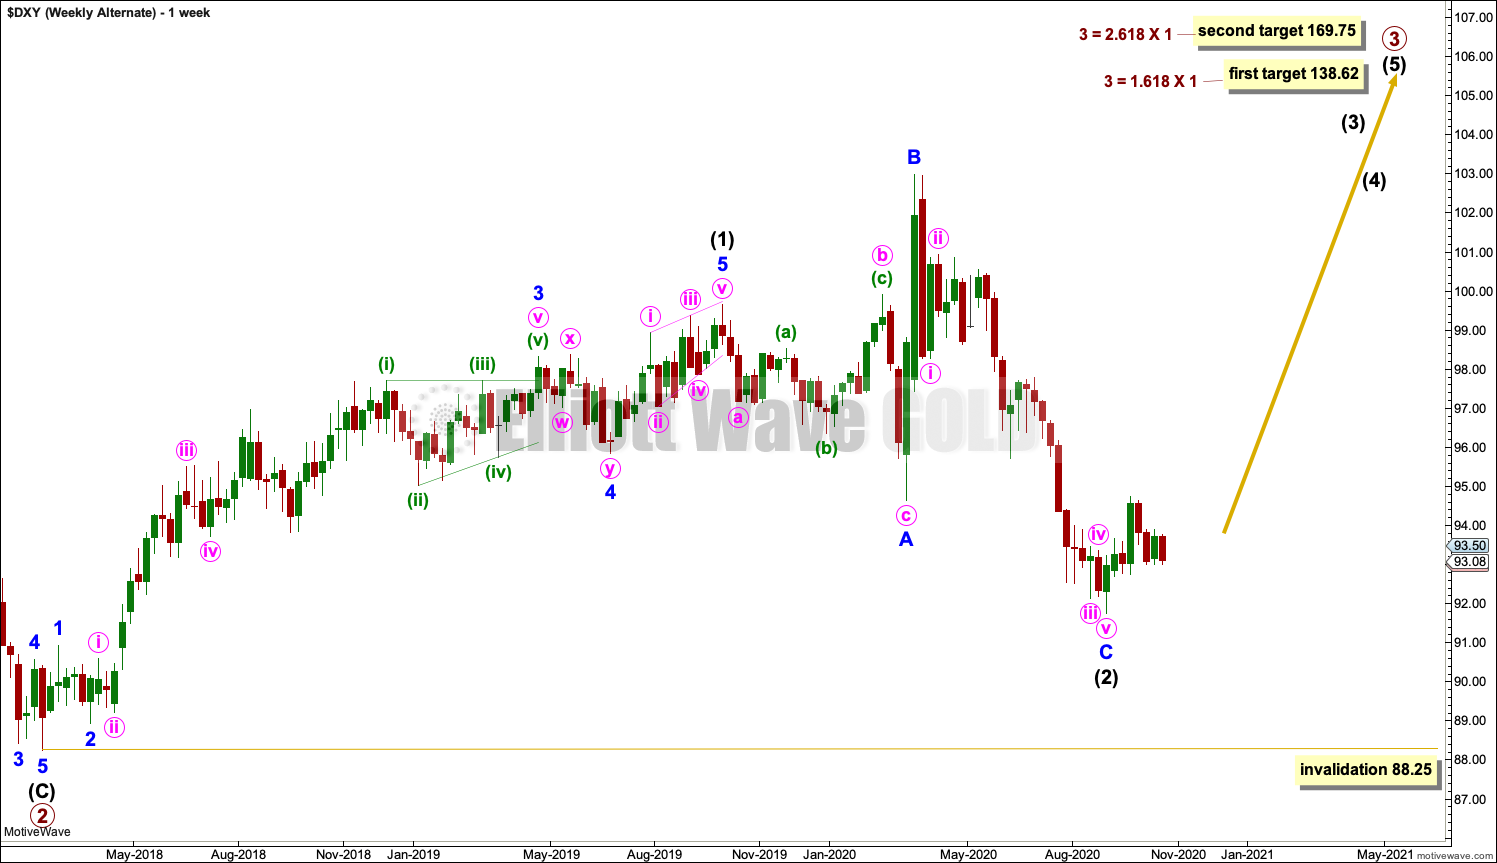
Click chart to enlarge.
Primary wave 3 may only subdivide as an impulse. Intermediate wave (1) within the impulse may be complete.
Intermediate wave (2) may be a complete expanded flat. If minor wave C within intermediate wave (2) continues lower, then intermediate wave (2) may not move beyond the start of intermediate wave (1) below 88.25.
TECHNICAL ANALYSIS
MONTHLY CHART
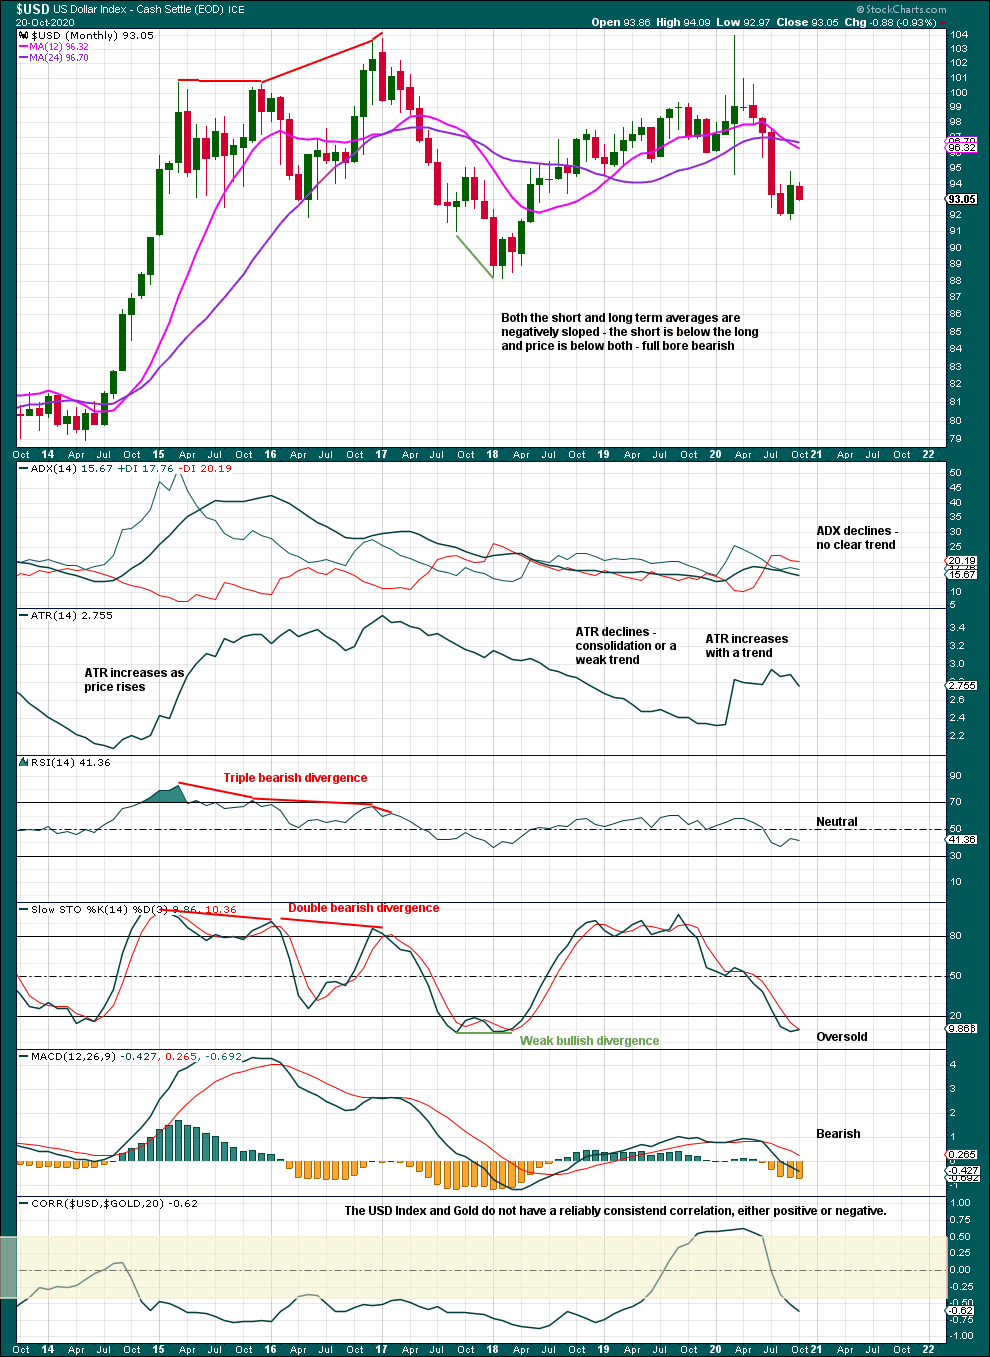
Click chart to enlarge. Chart courtesy of StockCharts.com.
There is no clear trend.
Stochastics is oversold. A bounce up from support may occur here.
If ADX turns upwards, then it would give a strong signal that a downwards trend may be in an early stage.
WEEKLY CHART
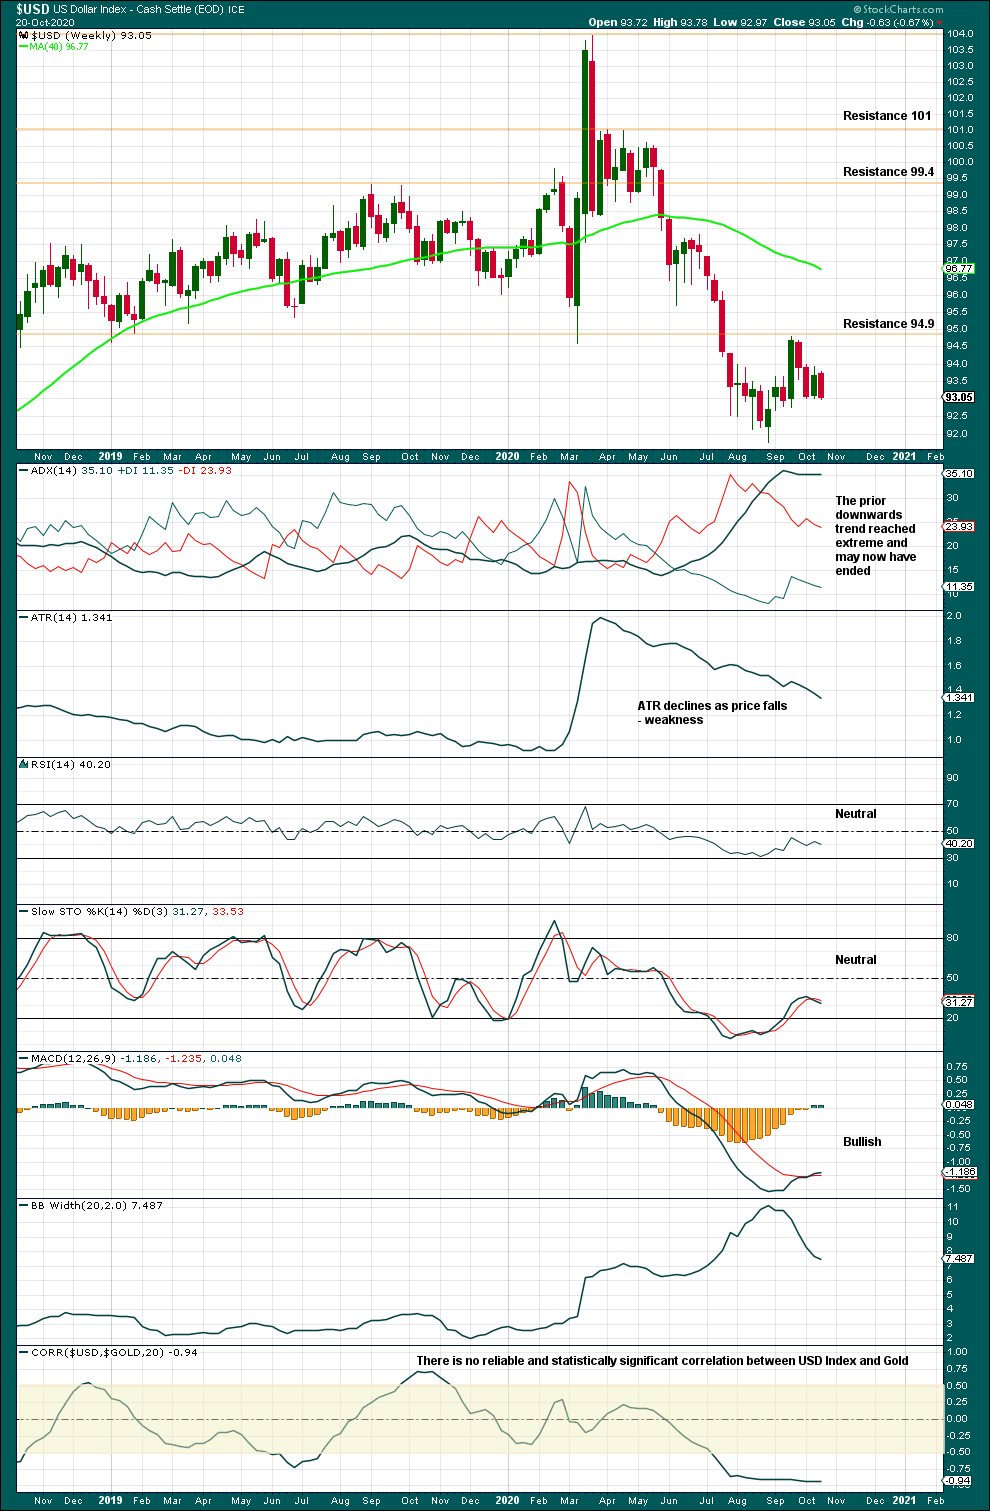
Click chart to enlarge. Chart courtesy of StockCharts.com.
The downwards trend reached extreme. Some consolidation or a bounce may now continue to relieve extreme conditions.
Published @ 11:40 p.m. ET.
—
Careful risk management protects your trading account(s).
Follow my two Golden Rules:
1. Always trade with stops.
2. Risk only 1-5% of equity on any one trade.
—
New updates to this analysis are in bold.