
BTCUSD: Identifying Bitcoin Highs and Lows | Charts – January 18, 2021
This article analyses technical indicators at highs and lows for Bitcoin.
TECHNICAL ANALYSIS
WEEKLY
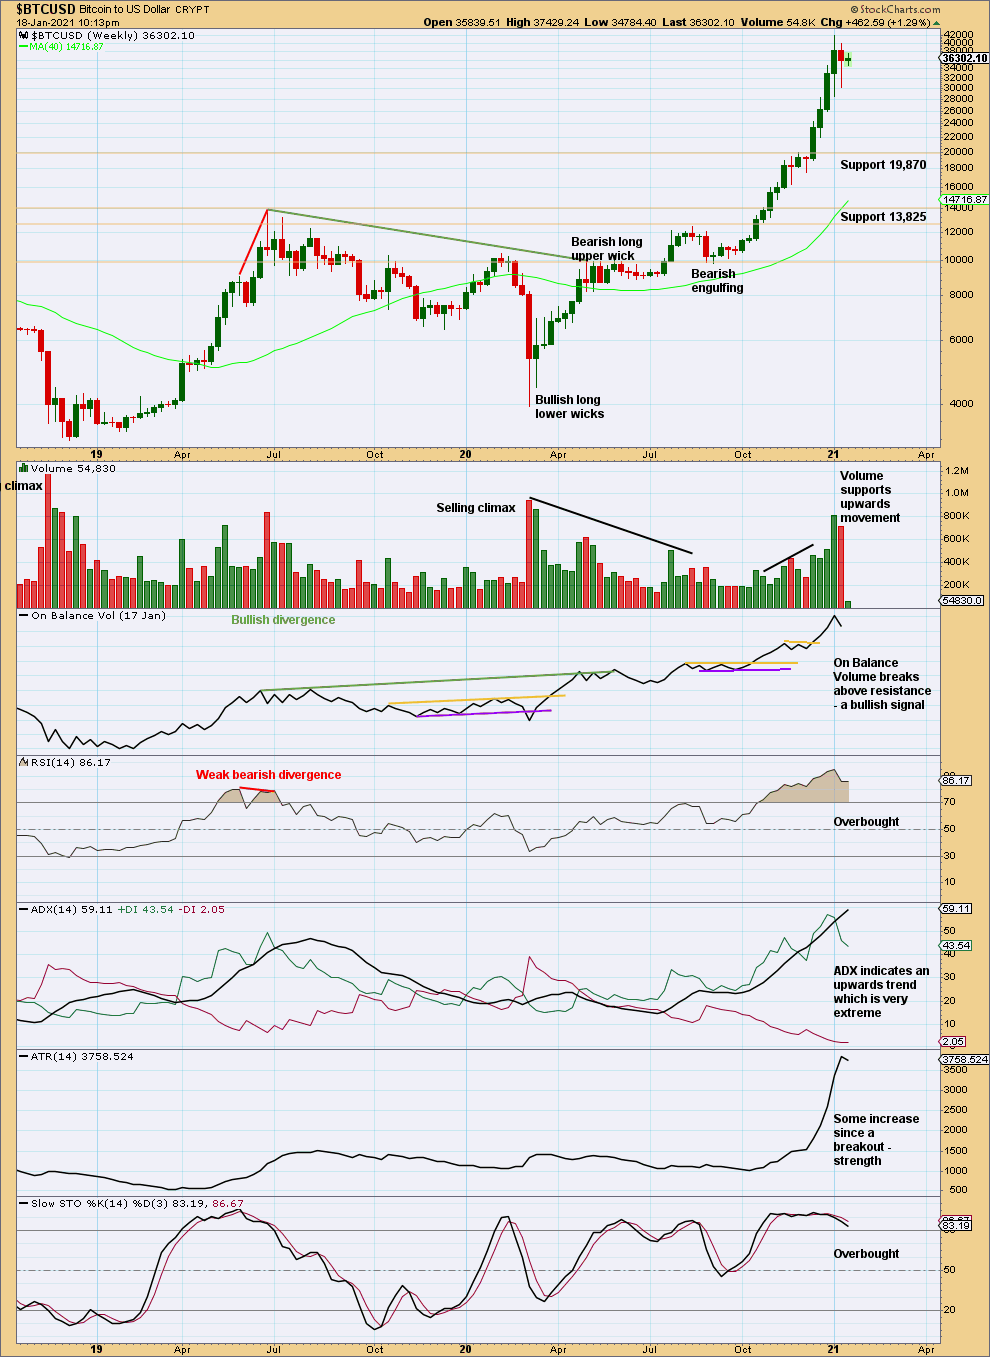
Click chart to enlarge.
The following characteristics can be noted at the end of prior major highs for Bitcoin:
The first sharp rise to the week beginning 5th June 2011: near vertical movement for several weeks, a sharp volume spike for a blow off top on the final week, and no candlestick reversal pattern on the weekly chart but an Evening Doji Star on the daily chart. The following correction was 0.94.
The next sharp rise to the week beginning 7th April 2013: near vertical movement for three weeks, a sharp volume spike on the final week that closed red and formed a Bearish Engulfing pattern on the weekly chart, a Bearish Engulfing pattern on the daily chart, ADX remained very extreme for most of the rise, and single week bearish divergence between price and RSI at the end. The following correction was 0.82.
The next sharp rise to the week beginning 24th November 2013: vertical movement for four weeks, a strong rise in volume until the last week (which saw volume fall), a Bearish Engulfing pattern on the weekly chart, an Evening Doji Star on the daily chart (the third candlestick of which had strong support from volume), ADX reached very extreme for many days, and RSI reached extreme overbought and there exhibited single bearish divergence. The following correction was 0.93.
The next sharp rise to the all time high at 19,870.62 on the 17th of December 2018: vertical movement for three weeks, a strong increase in volume up to the last week (which saw a fall in volume), a Bearish Engulfing pattern on the weekly chart that had support from volume; on the daily chart, ADX reached very extreme for a coupe of weeks or so, RSI reached overbought and there exhibited single bearish divergence, and early downwards movement from the high had support from volume. The following correction was 0.84.
In the last sharp rise to the week beginning June 24, 2019: Vertical movement for three weeks with the third weekly candlestick closing as a red doji and exhibiting a strong increase in volume; on the weekly chart ADX reached extreme, and RSI reached extreme and exhibited single bearish divergence; there was no candlestick reversal pattern on the weekly chart, but there was a large Bearish Engulfing pattern with support from volume on the daily chart; and, on the daily chart ADX was not extreme at the high, RSI was deeply overbought and exhibited no divergence, and there was a strong volume spike at the high.
Some conclusions may be drawn about how to identify a major high in Bitcoin:
– Look for vertical movement on the weekly chart for at least two weeks, and possibly up to several (although when it is more than three the movement may be interspaced with a small pause).
– Look for either a sharp volume spike for a blow off top, or a strong increase in volume then followed by a single week of lighter volume at the possible high.
– A bearish candlestick reversal pattern has been seen so far at every major high for Bitcoin, so an absence of any candlestick reversal pattern at a potential high should be viewed very suspiciously.
– ADX is of no use as it may remain very extreme for long periods of time.
– RSI may also remain very extreme for long periods of time and may not exhibit any divergence, but it may add a little confidence in the high if it does exhibit bearish divergence in conjunction with other indicators being bearish.
DAILY
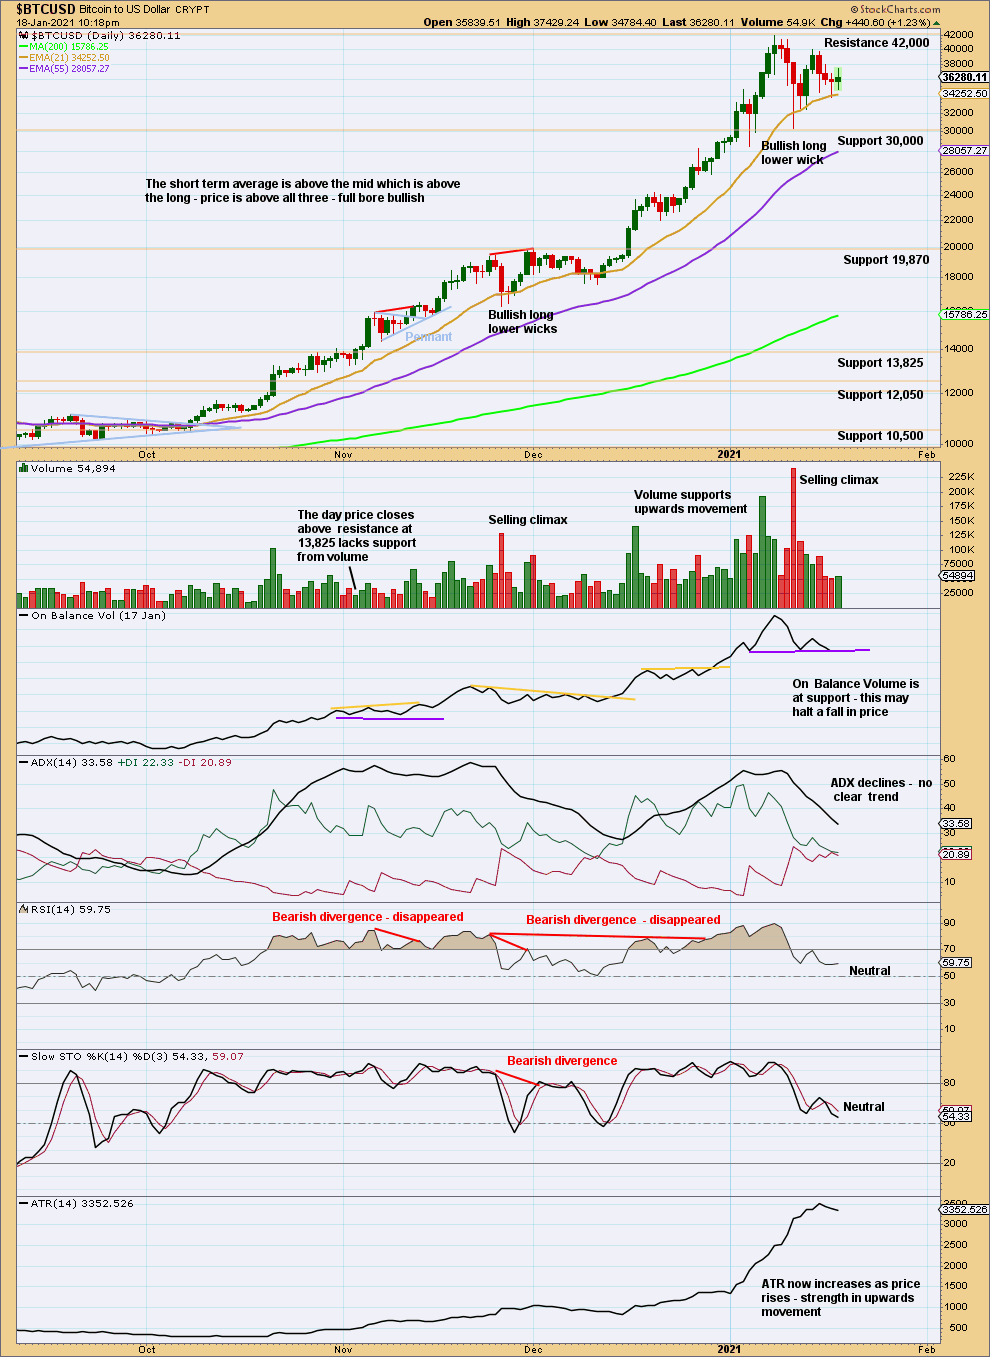
Click chart to enlarge.
The following can be noted when looking back at Bitcoin’s behaviour at major lows:
The 94% fall in price from June to November 2011 was characterised by:
– Three clearly separate instances of RSI reaching oversold on the daily chart, separated by bounces.
– ADX did not remain very extreme for very long at all on the daily chart.
– On Balance Volume exhibited weak single bullish divergence at the low.
The 93% fall in price from November 2013 to February 2014 was characterised by:
– RSI reached oversold and remained deeply oversold for three weeks; at the low, there was only single weak bullish divergence with price.
– ADX remained very extreme for the last seven sessions to the low.
– At the low, On Balance Volume did not exhibit bullish divergence with price. It remained bearish and then exhibited further bearishness after the low as it continued to decline as price began to rise.
The 84% fall in price from December 2017 to December 2018 was characterised by:
– RSI reached deeply oversold and then exhibited double divergence with price.
– ADX reached very extreme 20 sessions prior to the low.
– At the low, On Balance Volume exhibits no bullish divergence with price; it turned with price.
The 92% fall in price from June 2019 to March 2020 was characterised by:
– There was no Bullish candlestick reversal pattern.
– An instance of single day bullish divergence between price and On Balance Volume.
– An instance of single day bullish divergence between price and RSI after RSI reached reasonably oversold.
– ADX had not reached extreme.
Published @ 07:33 p.m. EST.
—
Careful risk management protects your trading account(s).
Follow my two Golden Rules:
1. Always trade with stops.
2. Risk only 1-5% of equity on any one trade.
—
New updates to this analysis are in bold.