
GOLD: Elliott Wave and Technical Analysis | Charts – February 19, 2021
Summary: The first wave count is bearish for the bigger picture and has only one daily chart. This wave count expects a multi-year bear market may be in its early stages to end below 1,046.
Downwards movement may increase in momentum. A short-term target is at 1,645. A long-term target is at 657. Some confidence may be had in this bearish wave count if price makes a new low below 1,766.53. This wave count may be discarded if price makes a new high above 1,957.87.
The second wave count is bullish for the bigger picture but now bearish for the short to mid term. A new target for a reasonably rare triple zigzag to end is at 1,737 to 1,723.
Grand SuperCycle analysis is here.
Last analysis of monthly charts is here.
FIRST ELLIOTT WAVE COUNT
WEEKLY CHART

Click chart to enlarge.
The bigger picture for this first Elliott wave count sees Gold as still within a bear market, in a three steps back pattern that is labelled Grand Super Cycle wave IV on monthly charts. Grand Super Cycle wave IV may be subdividing as an expanded flat pattern.
Super Cycle wave (b) within Grand Super Cycle wave IV may be a complete double zigzag. This wave count expects Super Cycle wave (c) to move price below the end of Super Cycle wave (a) at 1,046.27 to avoid a truncation and a very rare running flat. The target calculated expects a common Fibonacci ratio for Super Cycle wave (c).
DAILY CHART
Click chart to enlarge.
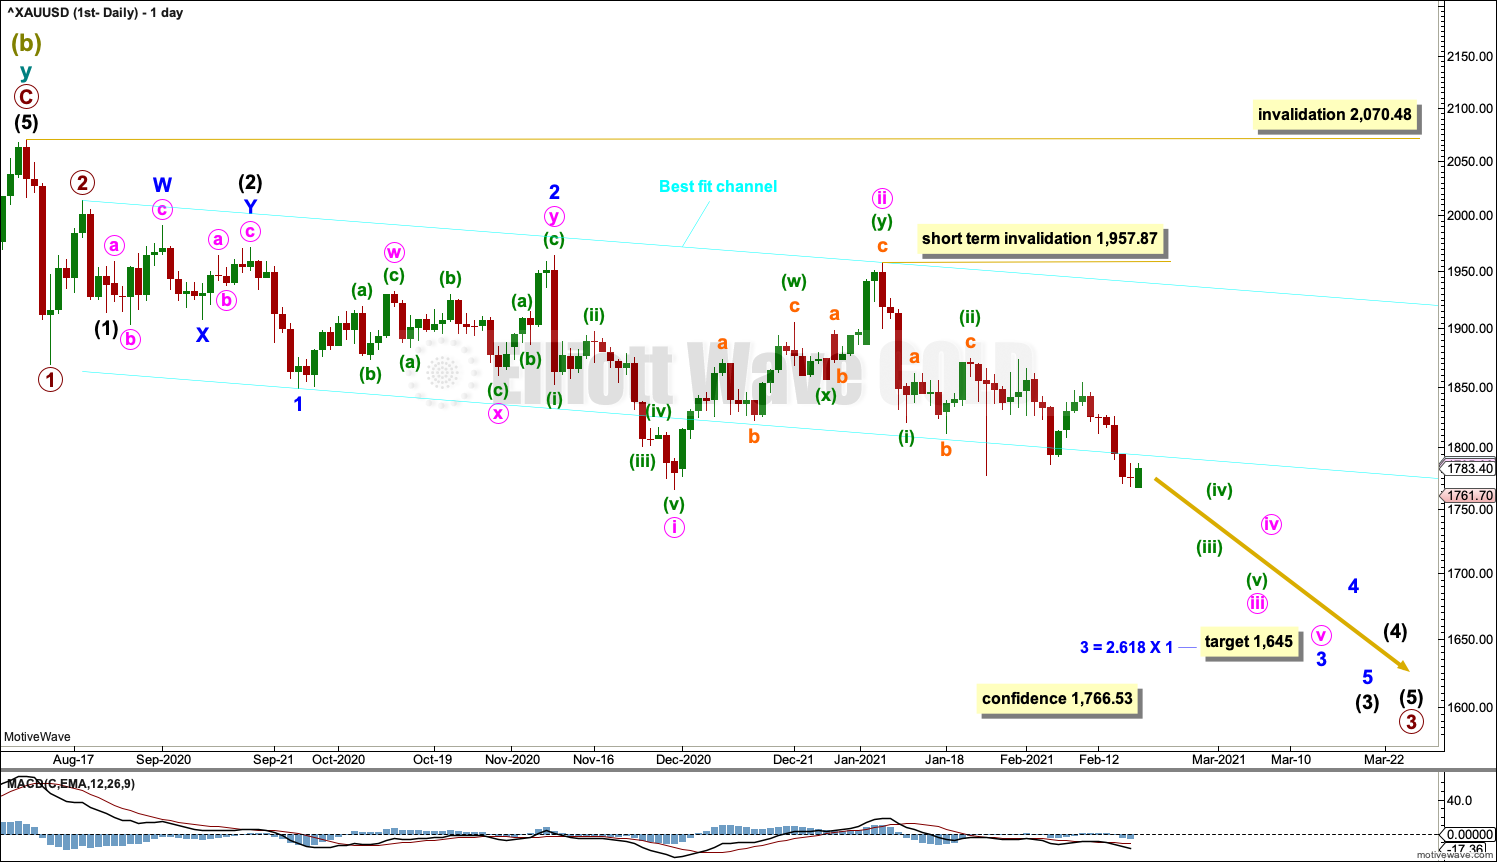
This week the degree of labelling within cycle wave I is moved up one degree.
Within a new bear market, cycle wave I may be an incomplete five wave impulse.
Cycle wave II within the new downwards trend may not move beyond the start of cycle wave I above 2,070.48.
Gold typically exhibits extended and strong fifth waves; this tendency is especially prevalent for fifth waves to end third wave impulses one degree higher. One or more of minute wave v, minor wave 5 or intermediate wave (5) may exhibit this tendency; there may be one or more selling climaxes along the way down. Minute wave iv and minor wave 4 may be relatively brief and shallow.
A best fit channel is drawn as shown. The upper edge may be used as a guide for resistance of any deeper bounces. The lower edge is no longer showing where price is finding resistance or support.
Minute wave ii may be complete as a double zigzag. If minuette wave (ii) continues higher, then it may not move beyond the start of minuette wave (i) above 1,957.87.
A new swing low below 1,766.53 at the end of this week adds reasonable confidence to this wave count.
HOURLY CHART

Click chart to enlarge.
A third wave down at seven degrees may have begun. This wave count expects to see an increase in downwards momentum as price approaches the middle of a third wave.
Sub-micro waves (1) and (2) may be complete. If sub-micro wave (2) continues higher, then it may not move beyond the start of sub-micro wave (1) above 1,853.92.
Price is still at strong support, which may initiate a small bounce.
Sub-micro wave (2) may more likely be a shallow correction due to a strong downwards pull from a third wave at multiple degrees.
SECOND ELLIOTT WAVE COUNT
WEEKLY CHART
Click chart to enlarge.
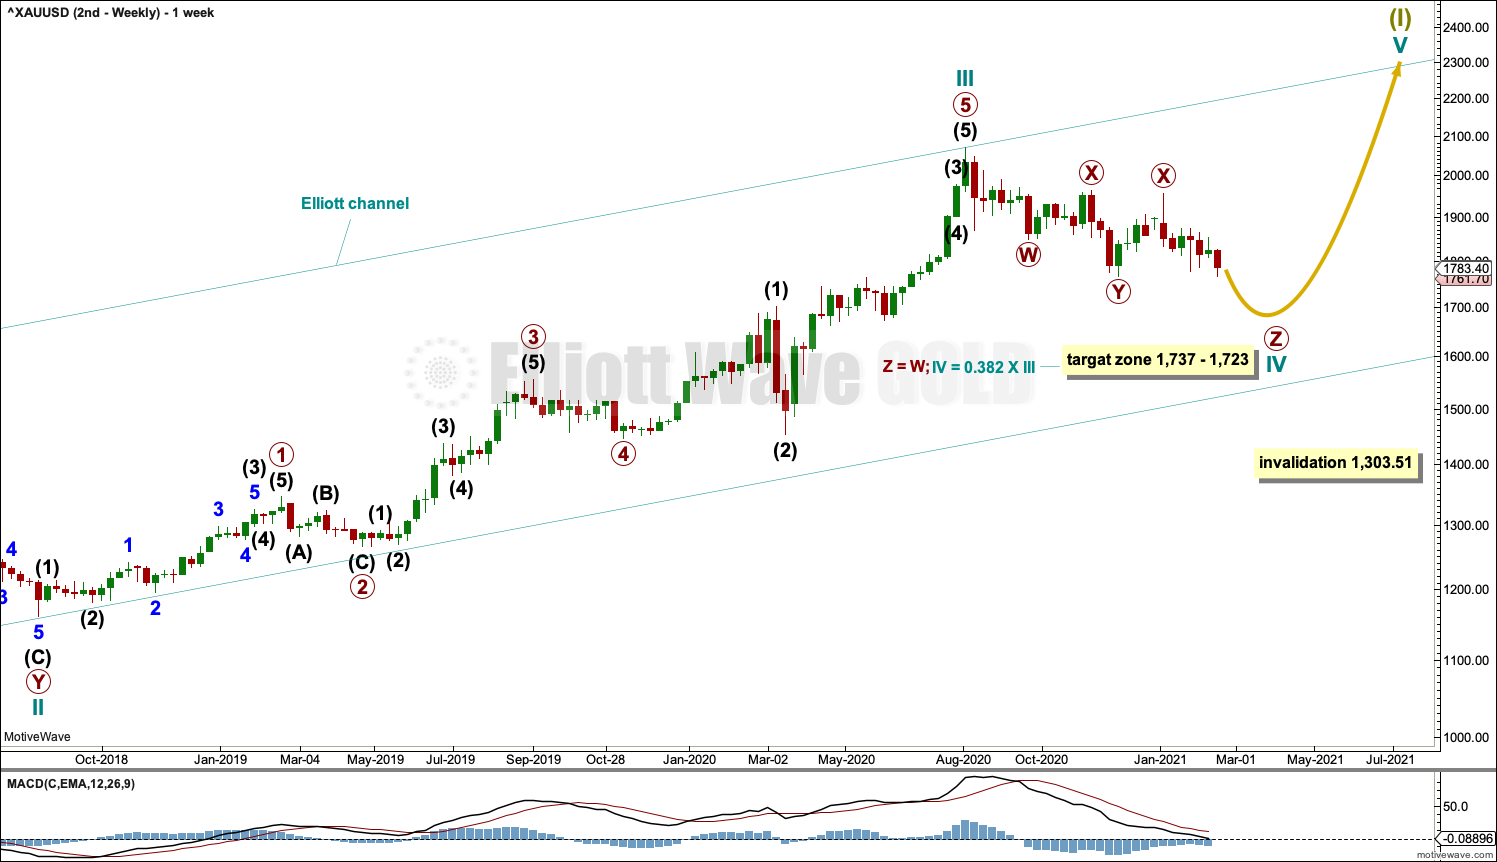
This wave count sees the the bear market complete at the last major low for Gold on 3 December 2015.
If Gold is in a new bull market, then it should begin with a five wave structure upwards on the weekly chart.
Cycle wave I fits as a five wave impulse with reasonably proportionate corrections for primary waves 2 and 4.
Cycle wave II fits as a double flat. However, within the first flat correction labelled primary wave W, this wave count needs to ignore what looks like an obvious triangle from July to September 2016 (this can be seen labelled as a triangle on the second weekly chart on prior analysis here). This movement must be labelled as a series of overlapping first and second waves. Ignoring this triangle reduces the probability of this wave count in Elliott wave terms.
Cycle wave IV has at the end of this week moved a little lower, so it now must be labelled as incomplete. The only structure cycle wave IV may now be unfolding as would be a relatively rare triple zigzag. The rarity of triples reduces the probability of this wave count further.
A target zone is calculated for cycle wave IV based upon two wave degrees.
Cycle wave IV may not move into cycle wave I price territory below 1,303.51.
DAILY CHART
Click chart to enlarge.
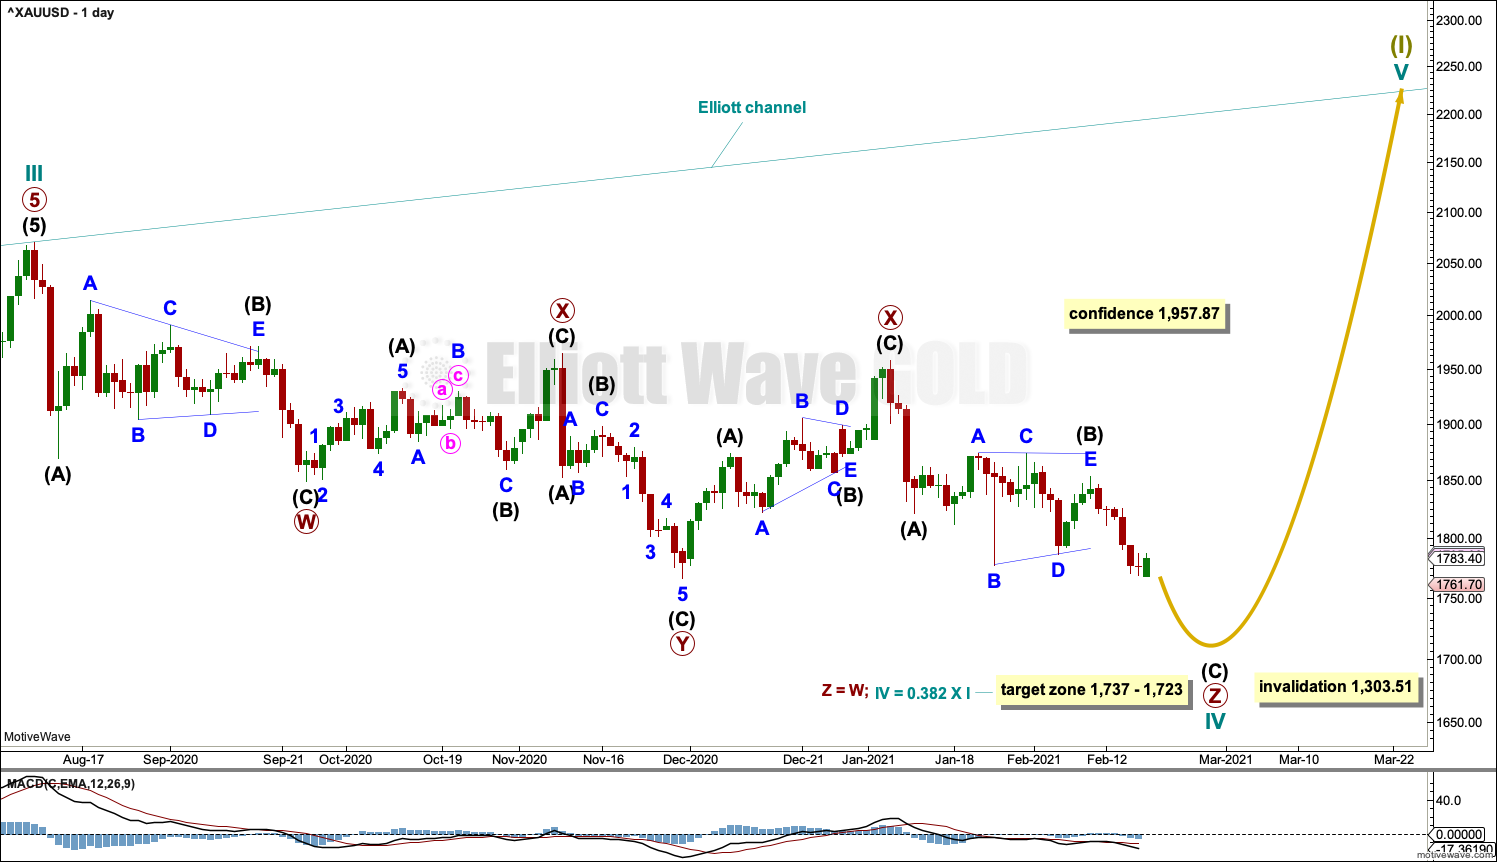
Cycle wave IV may be continuing lower as a relatively rare triple zigzag.
The third zigzag in a triple may now be completing lower. Primary wave Z may now be completing intermediate wave (C) .
Intermediate wave (C) must subdivide as a five wave motive structure.
The purpose of multiple zigzags is to deepen a correction when the first zigzag does not move price deep enough. To achieve this purpose multiple zigzags normally have a clear counter trend slope. So far cycle wave IV looks normal with a clear downwards slope.
To achieve its purpose of deepening the correction, primary wave Z may be expected to end reasonably below the end of primary wave Y. The target zone would see this purpose achieved.
HOURLY CHART

Click chart to enlarge.
The hourly chart focusses on the structure of intermediate wave (C) as an incomplete five wave impulse. Within intermediate wave (C): Minor wave 1 may be complete and minor wave 2 may continue higher next week (it may end about the 0.618 Fibonacci ratio of minor wave 1).
Minor wave 2 may not move beyond the start of minor wave 1 above 1,853.92.
SECOND ELLIOTT WAVE COUNT
ALTERNATE WEEKLY CHART
Click chart to enlarge.
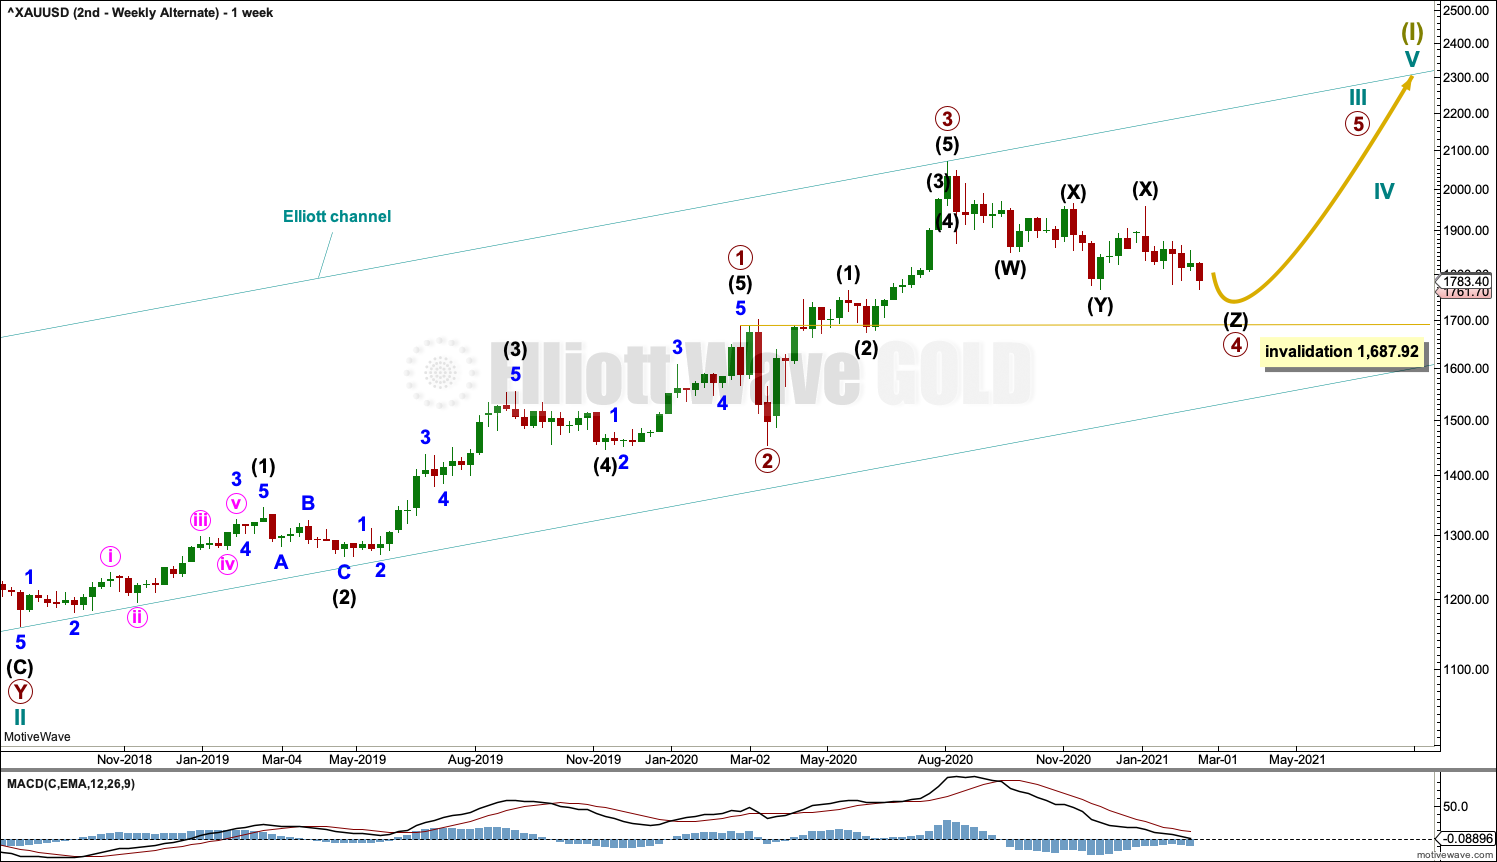
It is possible for the second wave count that cycle wave III may be an incomplete impulse. Primary wave 4 within the impulse may be continuing lower as a triple zigzag.
Primary wave 4 may not move into primary wave 1 price territory below 1,687.92.
There is alternation between an expanded flat of primary wave 2 and a triple zigzag of primary wave 4. Both are of a similar depth. Primary wave 2 lasted 3 weeks while primary wave 4 so far has lasted 28 weeks and is incomplete. It is unusual for Gold to exhibit fourth waves that are much longer lasting than counterpart second waves. The probability of this wave count is further reduced.
TECHNICAL ANALYSIS
WEEKLY CHART
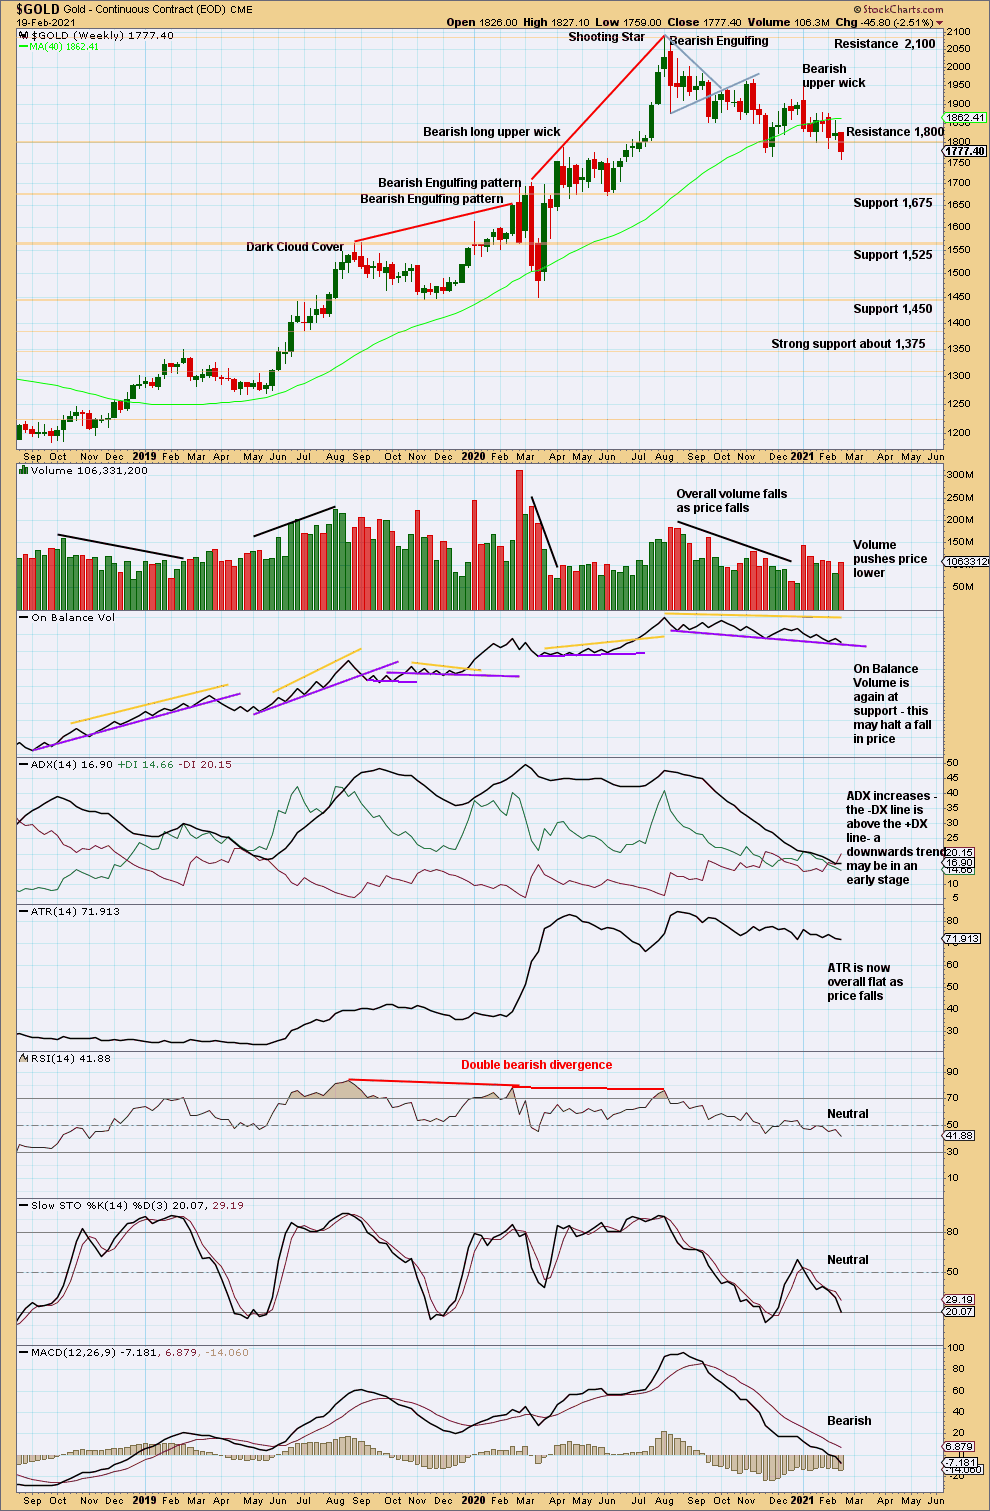
Click chart to enlarge. Chart courtesy of StockCharts.com.
There is a series of lower swing lows and lower swing highs from the last all time high in August 2020. ADX now indicates a downwards trend at the weekly time frame, and this week price has made another important new swing low.
RSI is not extreme. There is plenty of room for a downwards trend to continue.
A downwards trend should now be the dominant view until the trend reaches extreme and then a bullish candlestick reversal pattern is seen.
DAILY CHART
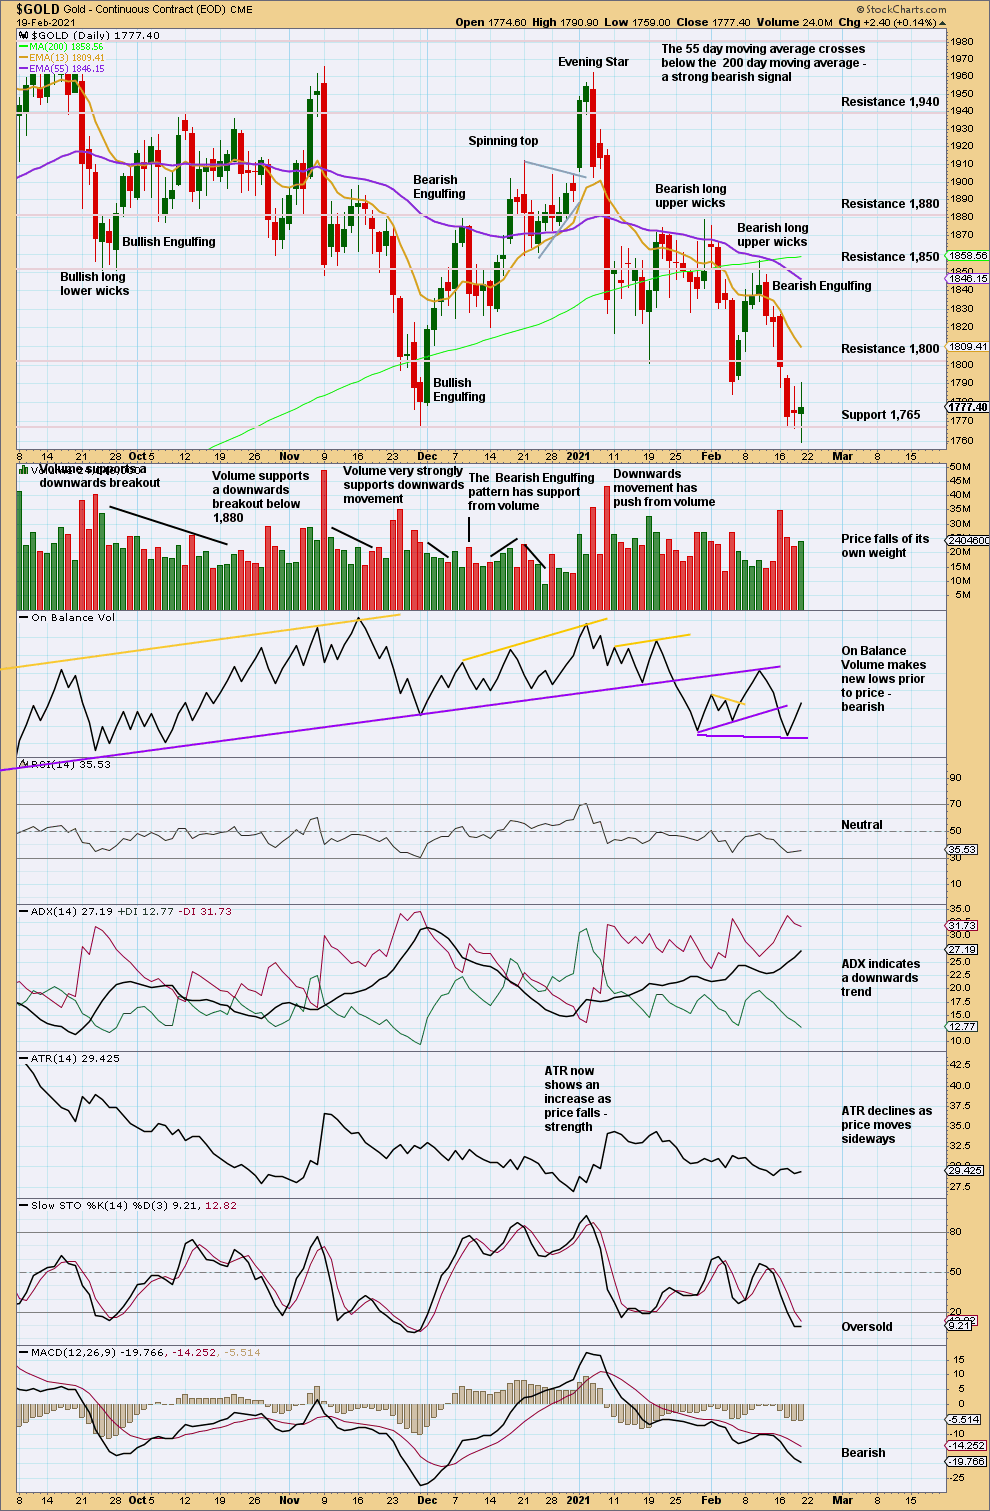
Click chart to enlarge. Chart courtesy of StockCharts.com.
RSI is not oversold, and the trend is not extreme.
The 50 day moving average has crossed below the 200 day moving average, a “death cross”.
Price has closed below 1,800 but not below 1,765. The last two daily candlesticks suggest indecision, a balance of bulls and bears. Some bounce here about support may occur.
GDX WEEKLY CHART
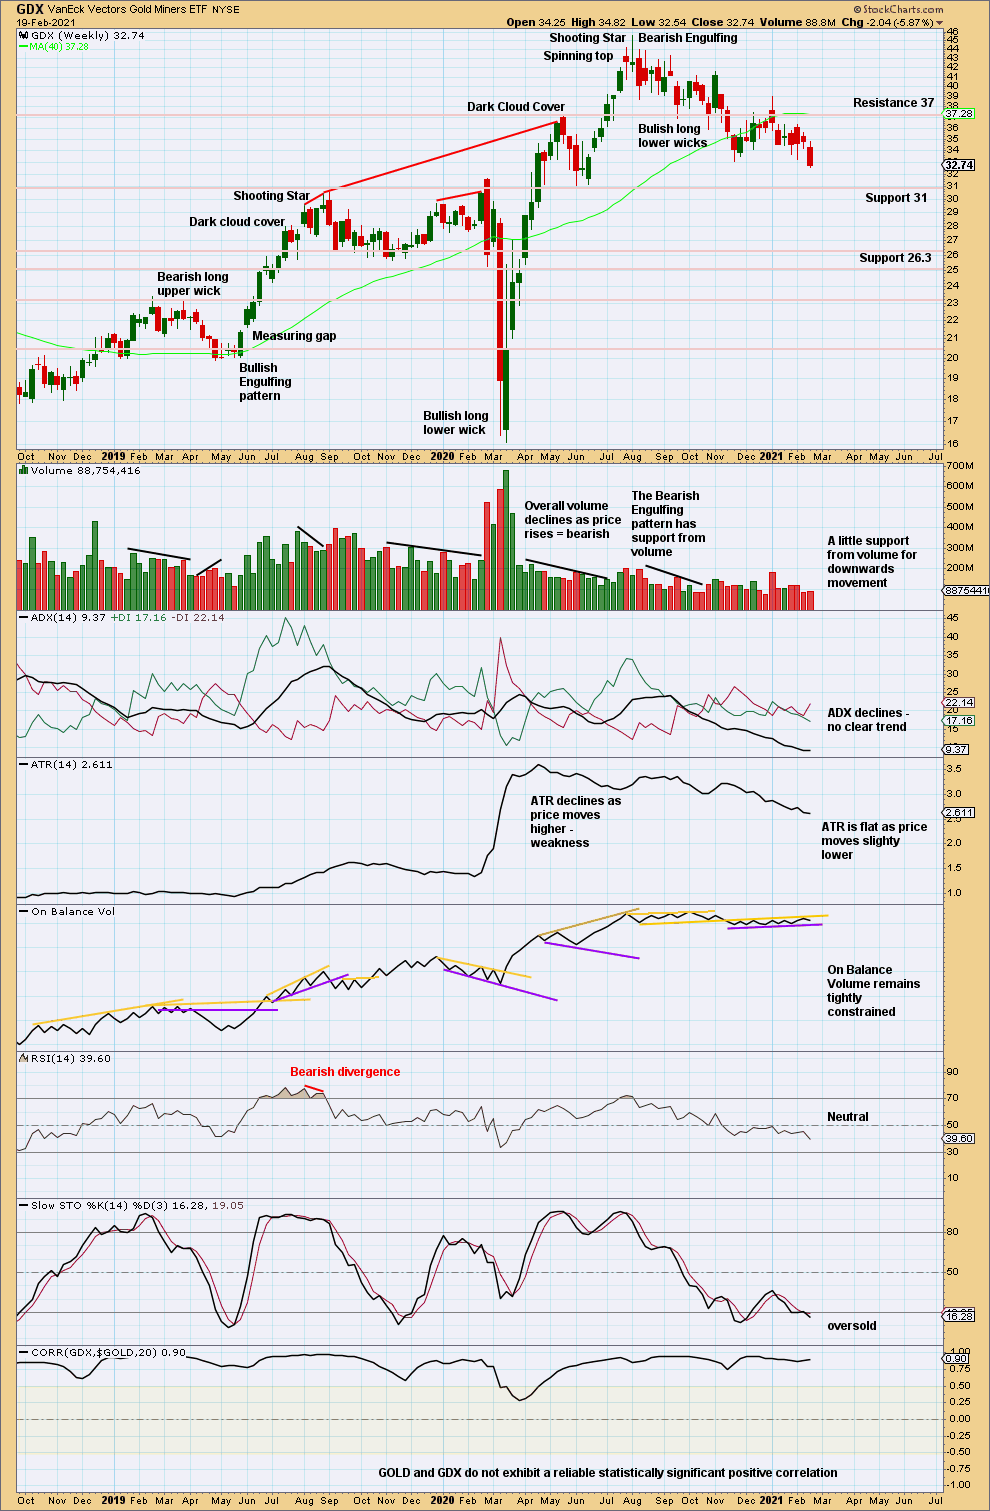
Click chart to enlarge. Chart courtesy of StockCharts.com.
This week GDX has broken below support on a downwards week that has some support from volume. Next support is about 31.
GDX DAILY CHART
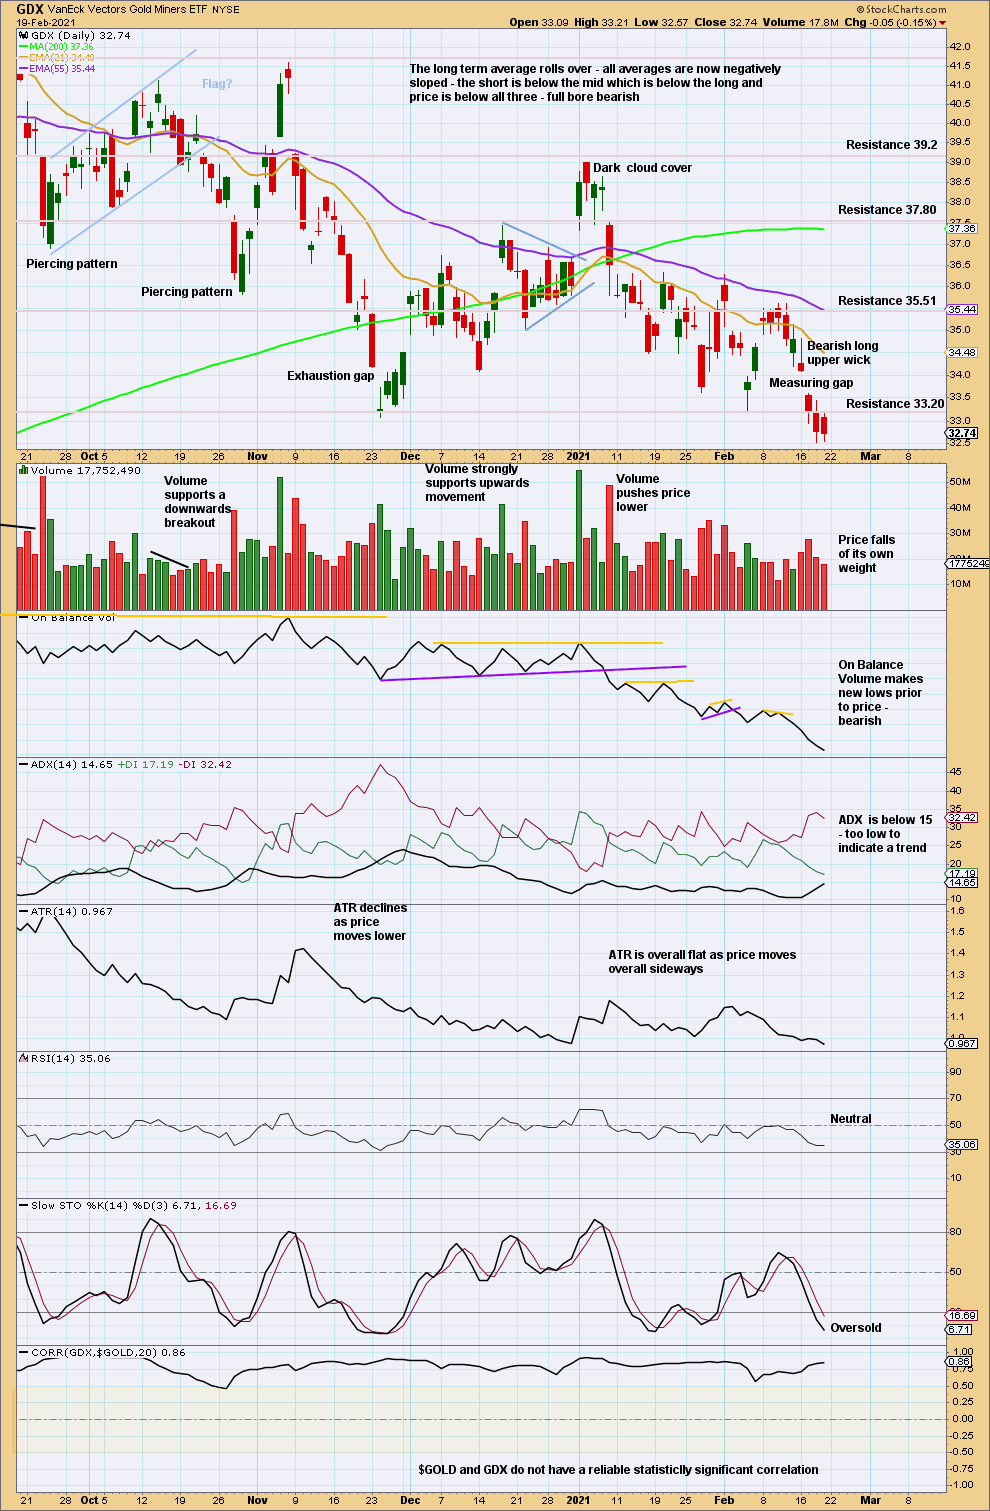
Click chart to enlarge. Chart courtesy of StockCharts.com.
Next support below is about 31.
A target calculated from the measuring gap at 32.05 is now close by.
Published @ 06:55 p.m. ET.
—
Careful risk management protects your trading account(s).
Follow my two Golden Rules:
1. Always trade with stops.
2. Risk only 1-5% of equity on any one trade.
—
New updates to this analysis are in bold.