
GOLD: Elliott Wave and Technical Analysis | Charts – April 20, 2021
Price is following the short-term pathway on the hourly Elliott wave chart in yesterday’s analysis.
Summary: The first wave count is bearish for the bigger picture and classic technical analysis supports this view. This wave count expects a multi-year bear market may be in its early stages to end below 1,046.
This bounce may continue towards 1,803. When the bounce is over, then the next short-term target may be calculated. In the short term, a new low below 1,757.92 would indicate the bounce should be over.
A long-term target is at 657.
The second wave count is bullish. A new upwards wave may now have begun. The target is at 2,124.
Grand SuperCycle analysis and last monthly charts are here.
FIRST ELLIOTT WAVE COUNT
WEEKLY CHART
Click chart to enlarge.
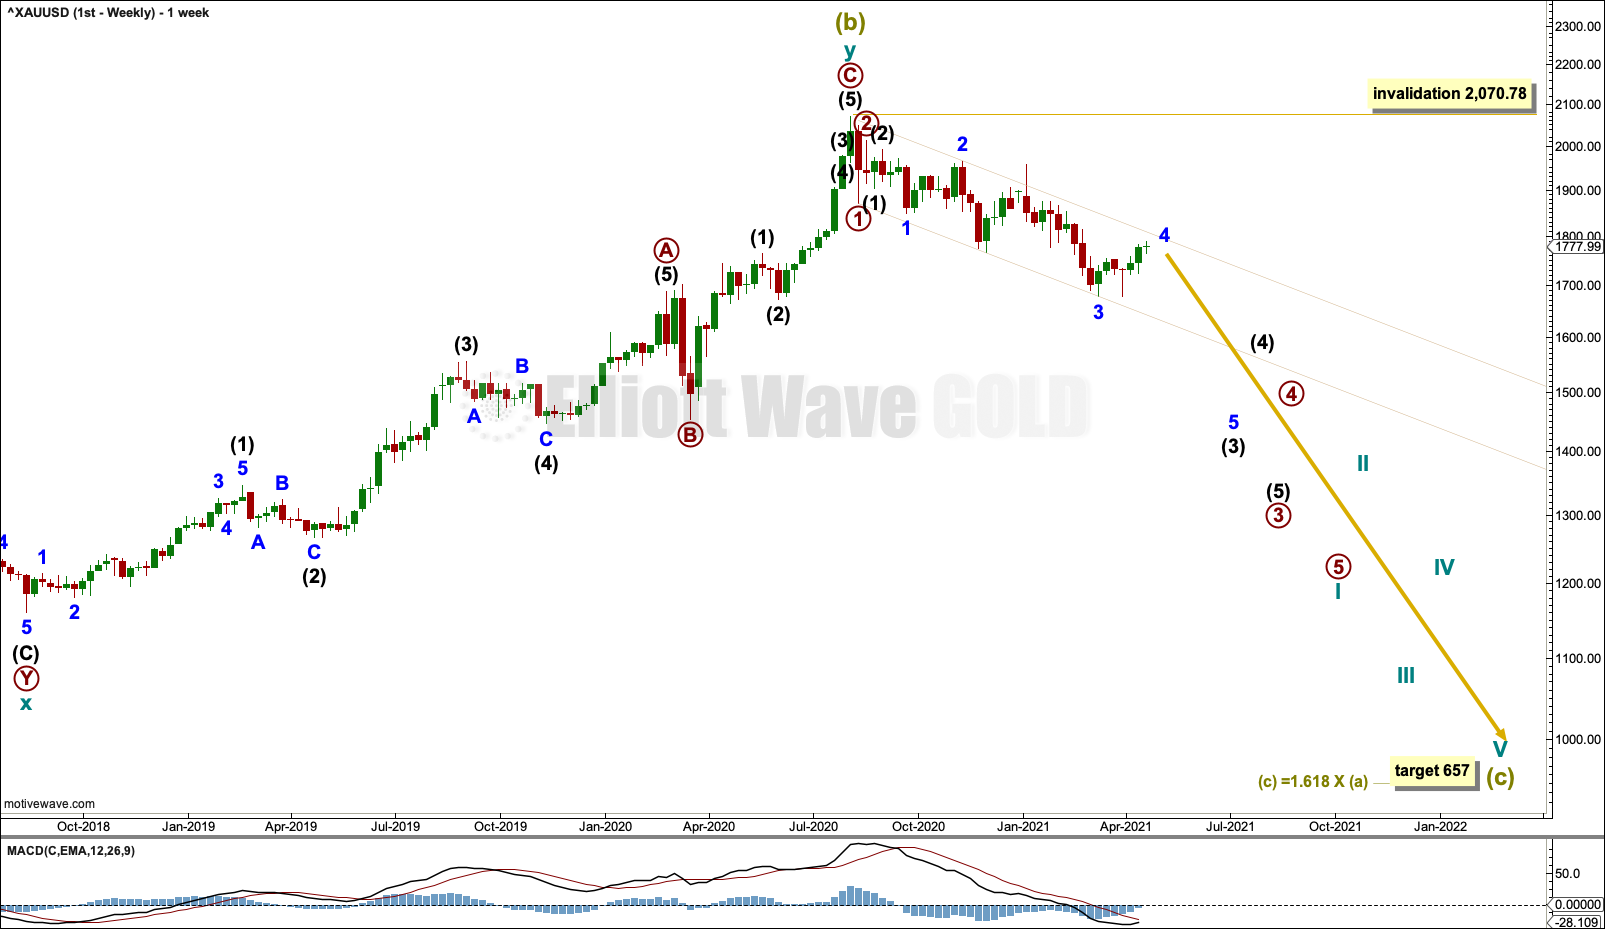
The bigger picture for this first Elliott wave count sees Gold as now within a bear market, in a three steps back pattern that is labelled Grand Super Cycle wave IV on monthly charts. Grand Super Cycle wave IV may be subdividing as an expanded flat pattern.
Super Cycle wave (b) within Grand Super Cycle wave IV may be a complete double zigzag. This wave count expects Super Cycle wave (c) to move price below the end of Super Cycle wave (a) at 1,046.27 to avoid a truncation and a very rare running flat. The target calculated expects a common Fibonacci ratio for Super Cycle wave (c).
DAILY CHART
Click chart to enlarge.
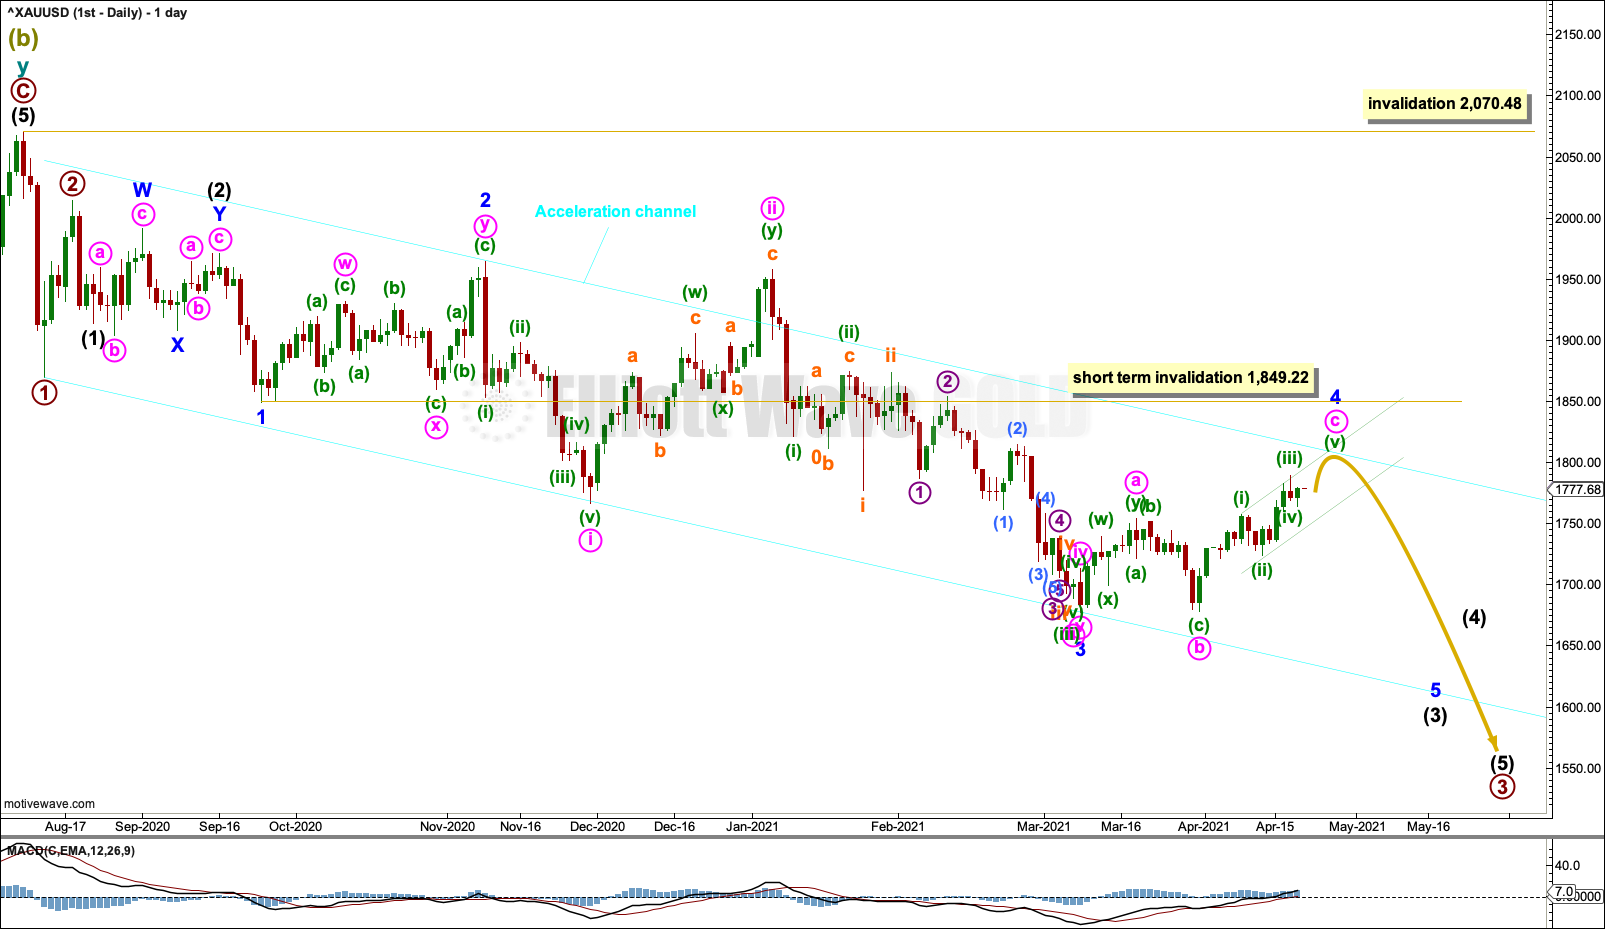
Within a new bear market, cycle wave I may be an incomplete five wave impulse.
Cycle wave II within the new downwards trend may not move beyond the start of cycle wave I above 2,070.48.
Gold typically exhibits extended and strong fifth waves; this tendency is especially prevalent for fifth waves to end third wave impulses one degree higher. One or both of minor wave 5 or intermediate wave (5) may exhibit this tendency; there may be one or more selling climaxes along the way down. Minute wave iv and minor wave 4 may be relatively brief and shallow.
Draw an acceleration channel about downwards movement. Draw the first trend line from the end of primary wave 1 to the last low, then place a parallel copy on the end of primary wave 2. Keep redrawing the channel as price continues lower. When primary wave 3 is complete, then this would be drawn using Elliott’s first technique and may show where primary wave 4 may find resistance.
Minor wave 4 may be unfolding as a flat. If it is deep, then it may find resistance at the upper edge of the cyan Acceleration channel.
Minor wave 4 may not move into minor wave 1 price territory above 1,849.22.
Draw a base channel about minute wave c within minor wave 4. From the start of minute wave c draw a trend line across the low of minuette wave (ii) within it, then place a parallel copy on the high of minuette wave (i). When this base channel is breached by downwards movement, then that may be an indication that minor wave 4 may be over.
HOURLY CHART
Click chart to enlarge.
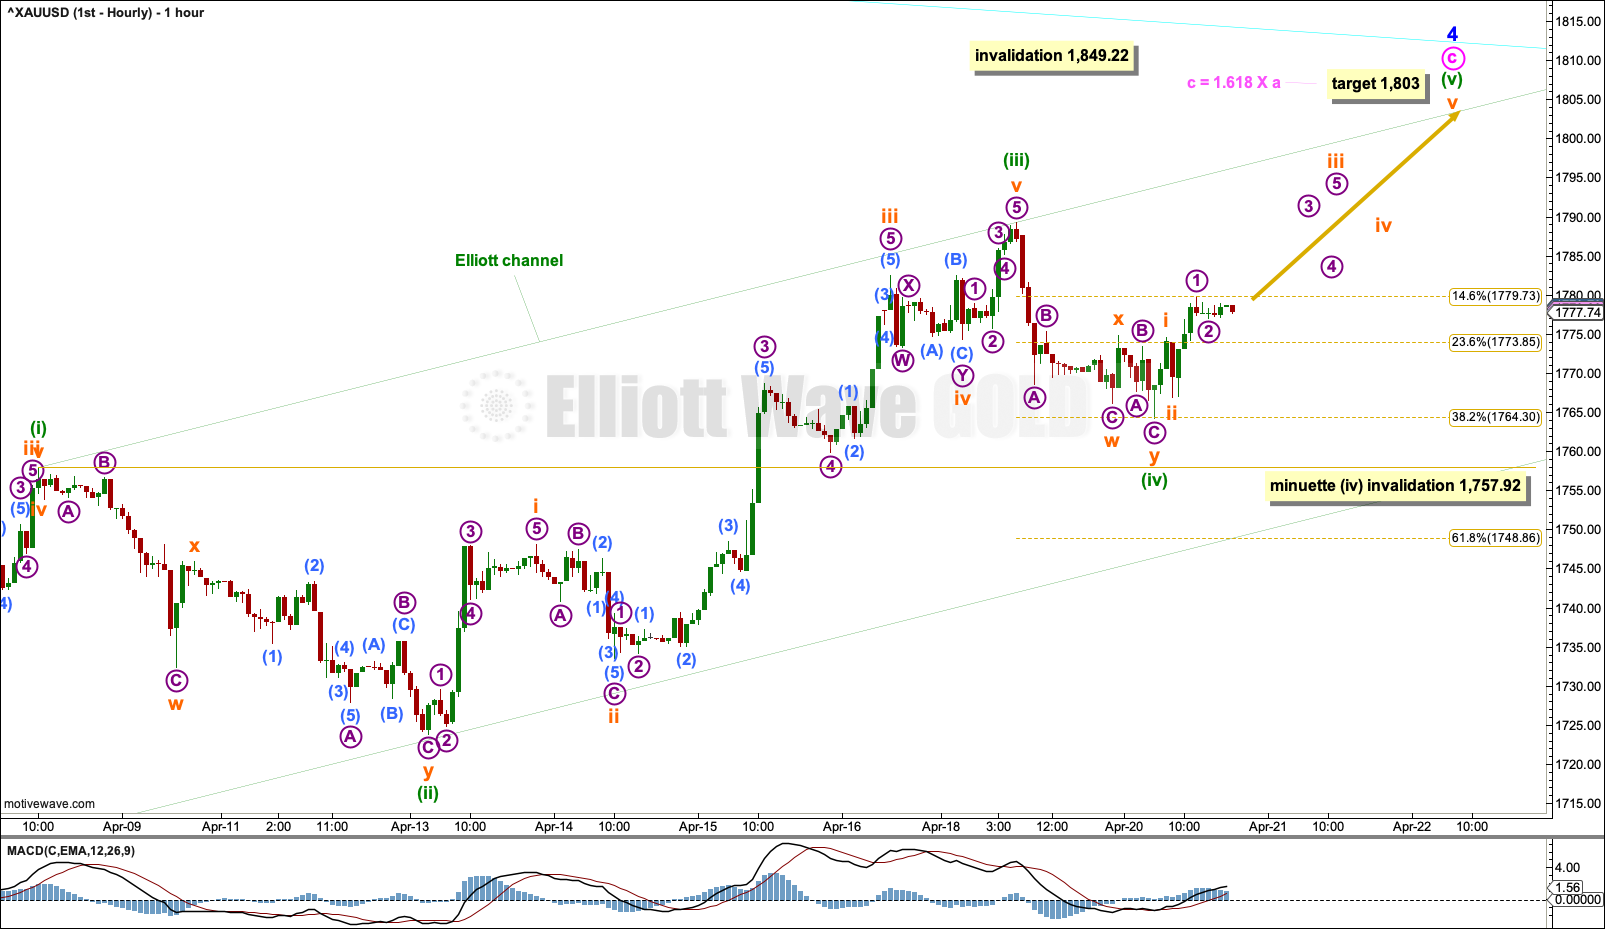
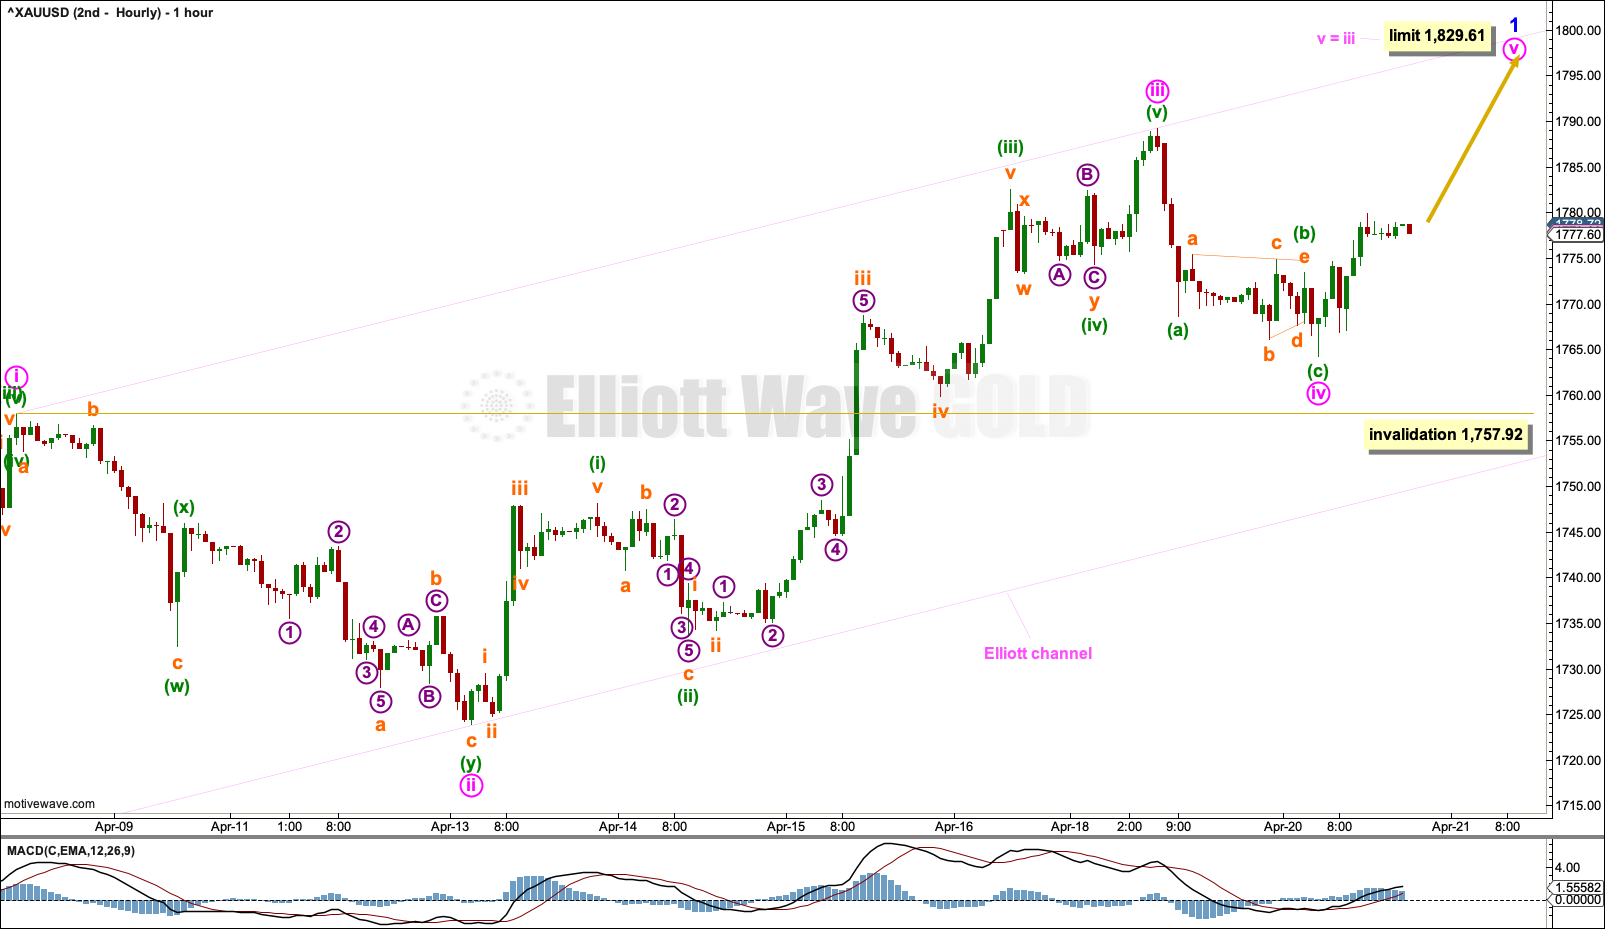
Minor wave 4 may not be complete. Minute wave c may be extending higher. A target is calculated for it to end.
Minute wave c must subdivide as a five wave motive structure. Within minute wave c: Minuette waves (i) and (ii) may be complete, and minuette wave (iii) may only subdivide as an impulse.
Subminuette wave iv may not move into subminuette wave i price territory below 1,748.17.
Copy the Elliott channel over from the daily chart.
Minuette wave (iv) may be complete now. But if it continues lower, then minuette wave (iv) may not move into minuette wave (i) price territory below 1,757.92. If this hourly chart is invalidated in the short term, then the alternate below may be used.
ALTERNATE HOURLY CHART
Click chart to enlarge.
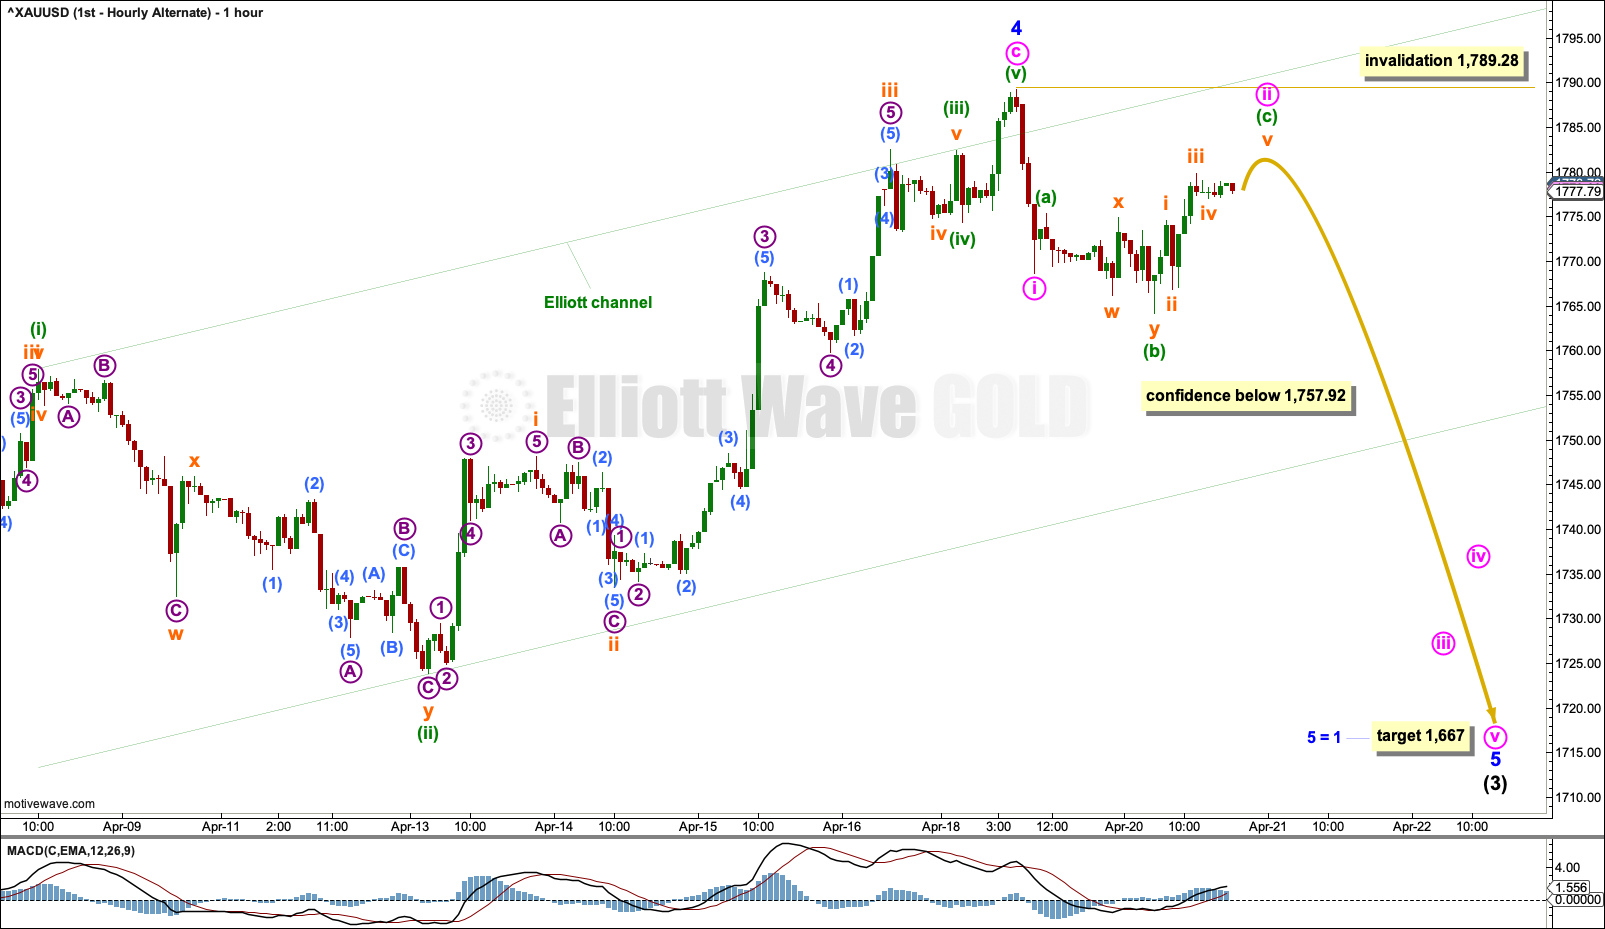
It is possible that minor wave 4 may be over. However, this alternate wave count includes a small truncation that reduces its probability.
Subminuette wave iii within minuette wave (iii) within minute wave c ends at 1,782.57. Subminuette wave v for this alternate wave count has not moved beyond the end of subminuette wave iii, it ends at 1,782.47. The 0.10 truncation is unusual for this market and reduces the probability of this wave count to an alternate.
A target is calculated for minor wave 5 to end.
No second wave correction within minor wave 5 may move beyond its start above 1,789.28.
SECOND ELLIOTT WAVE COUNT
WEEKLY CHART
Click chart to enlarge.
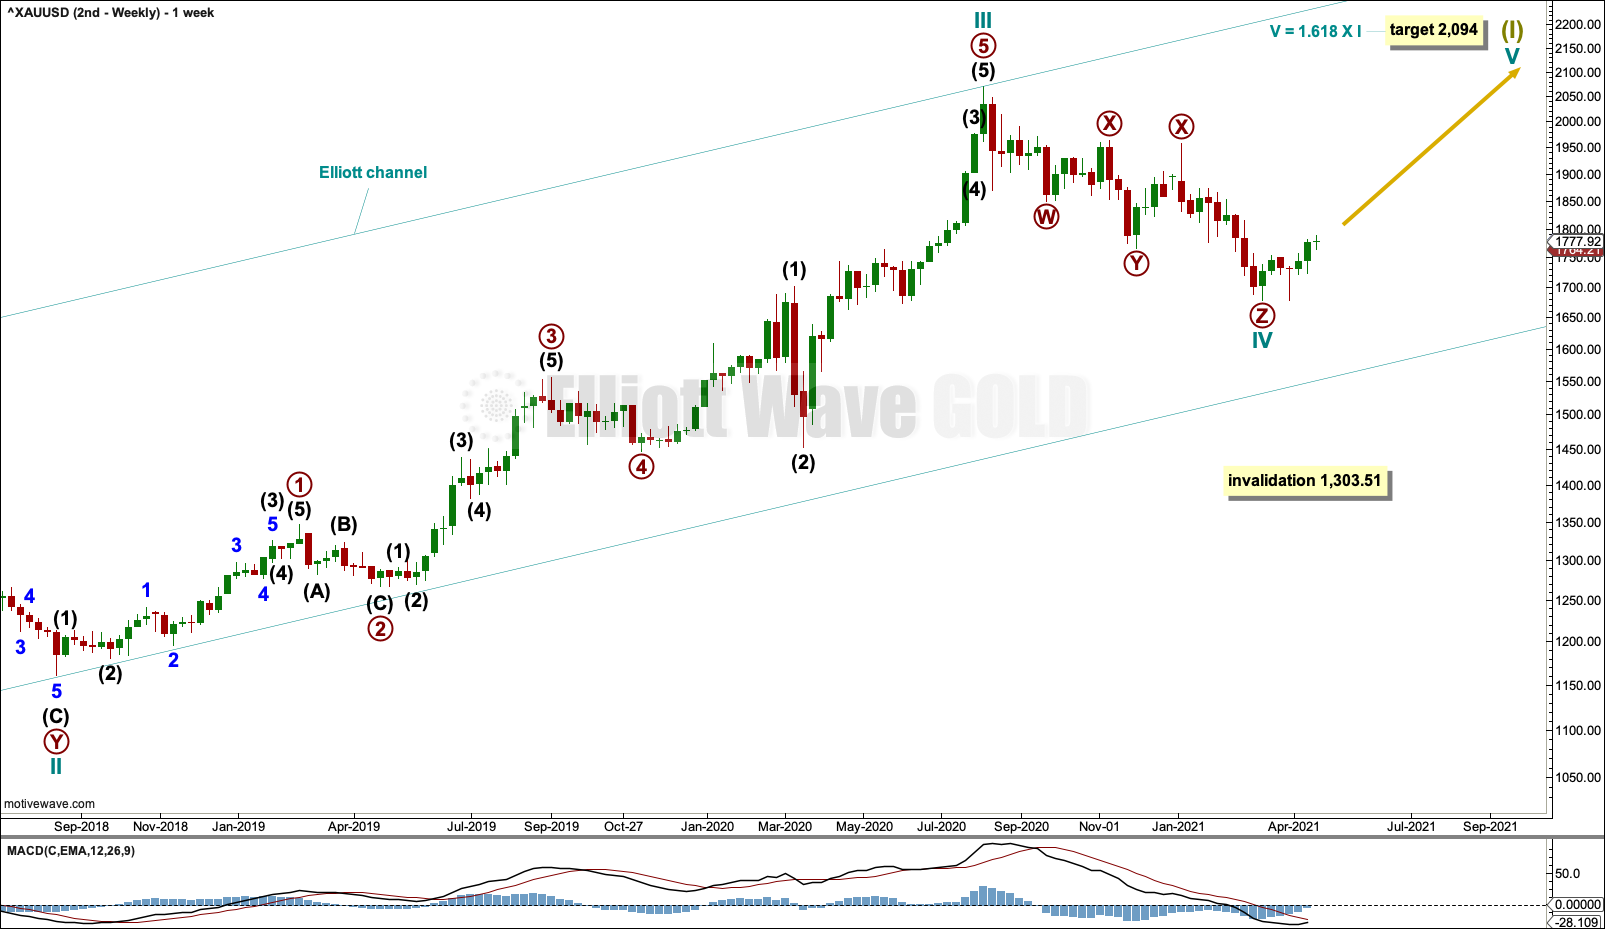
This wave count sees the the bear market complete at the last major low for Gold on 3 December 2015.
If Gold is in a new bull market, then it should begin with a five wave structure upwards on the weekly chart.
Cycle wave I fits as a five wave impulse with reasonably proportionate corrections for primary waves 2 and 4.
Cycle wave II fits as a double flat. However, within the first flat correction labelled primary wave W, this wave count needs to ignore what looks like an obvious triangle from July to September 2016 (this can be seen labelled as a triangle on the second weekly chart on prior analysis here). This movement must be labelled as a series of overlapping first and second waves. Ignoring this triangle reduces the probability of this wave count in Elliott wave terms.
Cycle wave IV may be a complete triple zigzag. The rarity of triple zigzags reduces the probability of this wave count further.
If the third zigzag of primary wave Z continues lower, then cycle wave IV may not move into cycle wave I price territory below 1,303.51.
DAILY CHART
Click chart to enlarge.
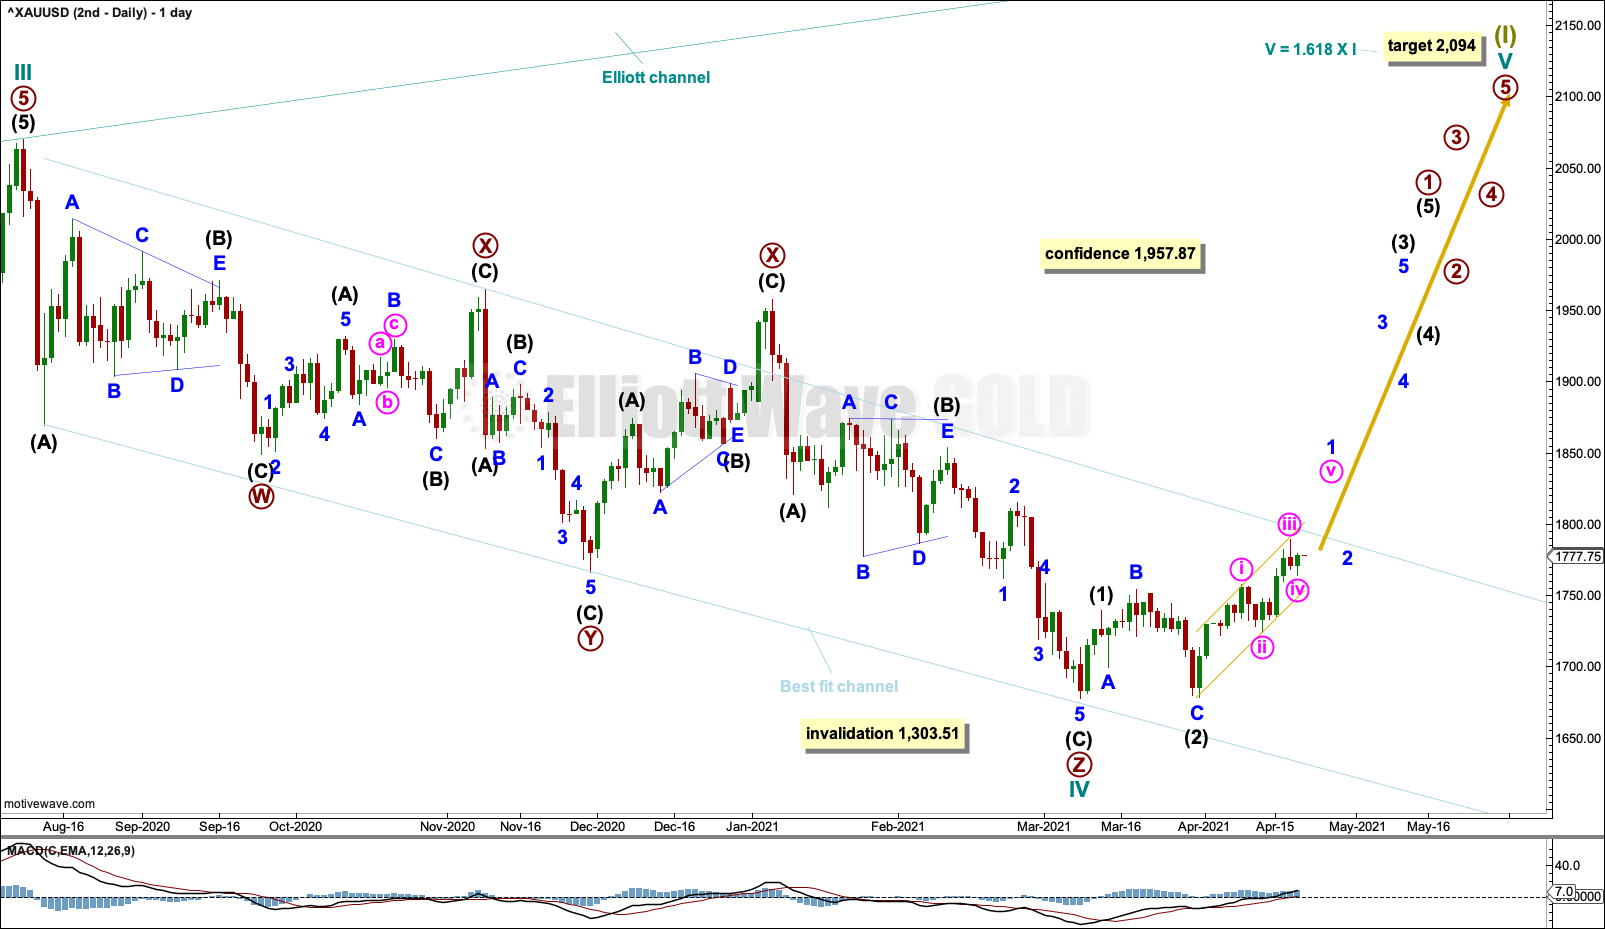
Cycle wave IV may be a complete triple zigzag.
The purpose of multiple zigzags is to deepen a correction when the first zigzag does not move price deep enough. To achieve this purpose multiple zigzags normally have a clear counter trend slope. Cycle wave IV looks normal with a clear downwards slope.
A target is recalculated for cycle wave V. If cycle wave IV continues lower, then this target must again be recalculated.
A best fit channel is drawn about cycle wave IV. If this channel is breached by upwards movement with at least one full daily candlestick above and not touching the upper edge of the channel, then that may provide confidence in this second Elliott wave count. The upper edge of this channel at this stage is not breached and, in the first instance, resistance may be expected if price continues higher to the trend line.
Minor wave 1 may be an incomplete impulse. Draw a small Elliott channel about minor wave 1 as shown. Copy this over to the hourly chart.
HOURLY CHART
Click chart to enlarge.
Within minor wave 1: Minute waves i through to iii may be complete, and minute wave iv may continue a little lower and may not move into minute wave i price territory below 1,757.92.
TECHNICAL ANALYSIS
WEEKLY CHART
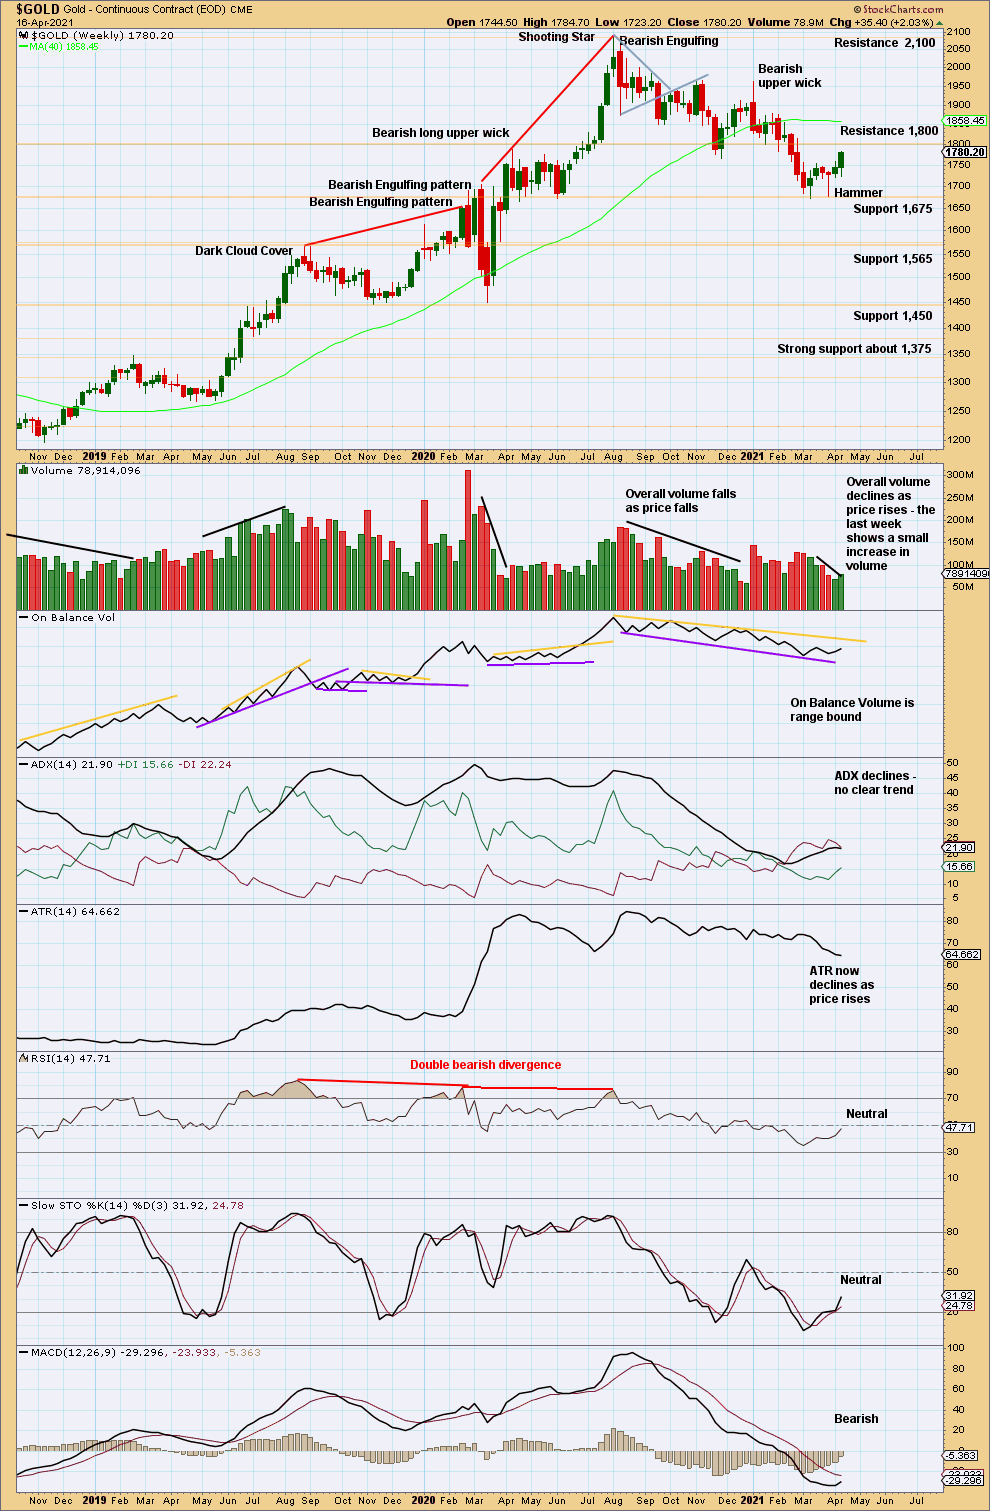
Click chart to enlarge. Chart courtesy of StockCharts.com.
There is a series of lower swing lows and lower swing highs from the last all time high in August 2020.
Neither ADX nor RSI are extreme. There is plenty of room for a downwards trend to continue. Last week ADX slightly declines; no downwards trend is currently indicated.
Following a Hammer candlestick pattern is now two weeks of upwards movement. But upwards movement was weak off the low, and volume is still relatively low although it has increased for the second week. This may be another counter trend bounce.
DAILY CHART
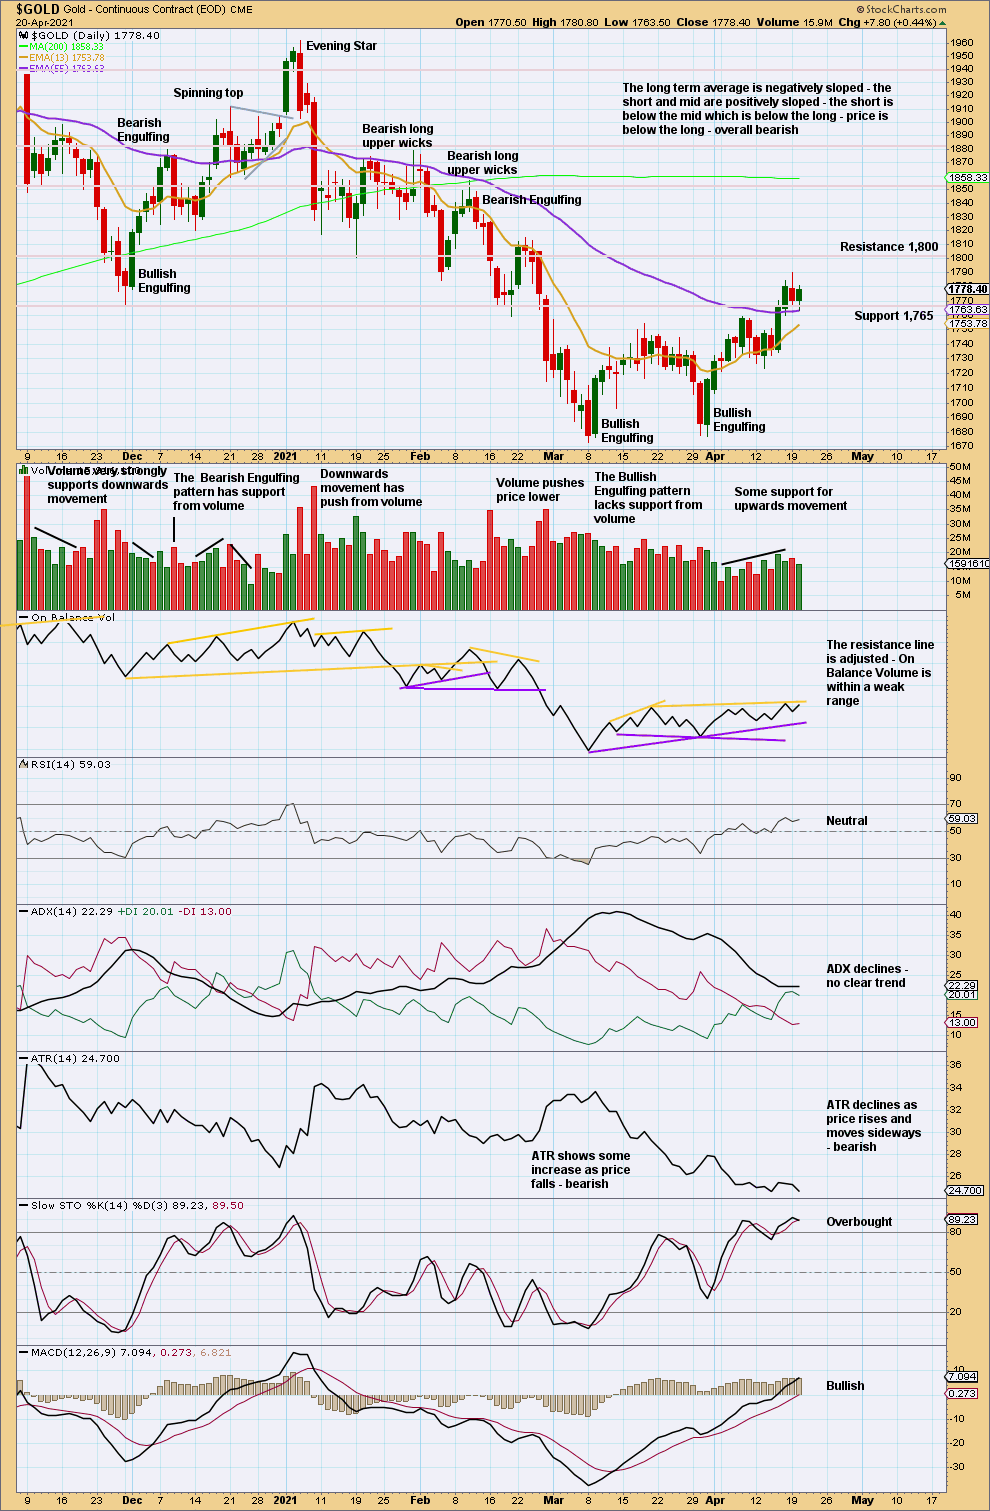
Click chart to enlarge. Chart courtesy of StockCharts.com.
Despite some increase in volume, this bounce still has overall relatively light volume and the last bullish candlestick pattern lacked support from volume. Overall, it still looks more likely that this may be another time consuming bounce within an ongoing downwards trend. There is no candlestick reversal pattern yet to indicate the bounce may be over. Next resistance is about 1,800.
GDX WEEKLY CHART
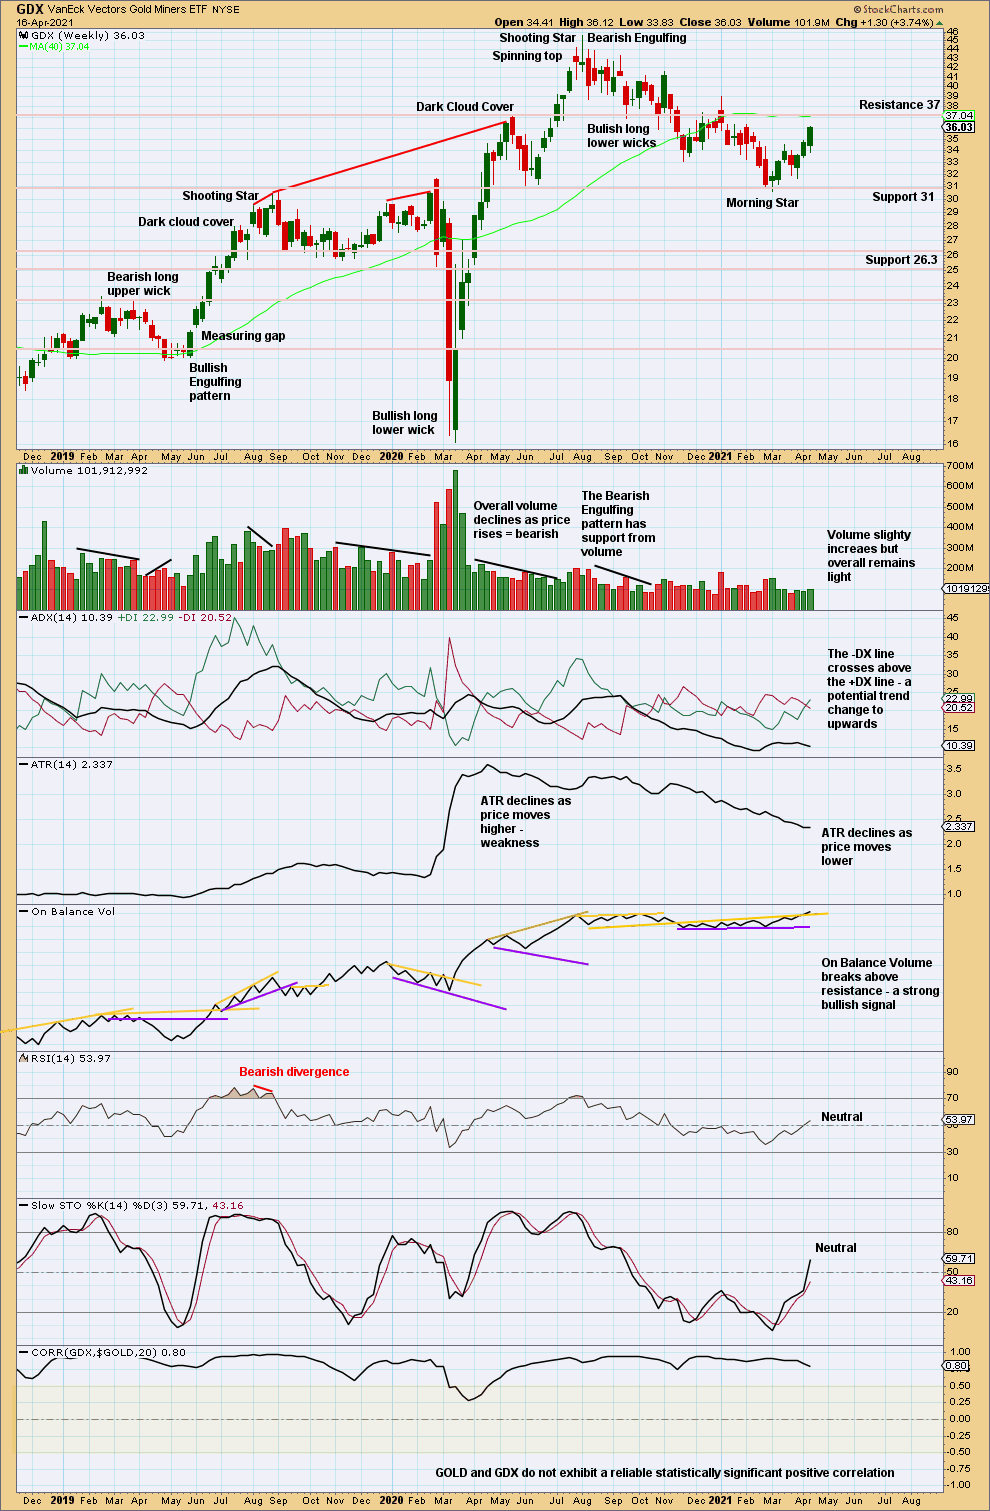
Click chart to enlarge. Chart courtesy of StockCharts.com.
For confidence in a Morning Star reversal pattern the third candlestick should have support from volume. This one does not, so confidence may not be had in this pattern.
This may be the start of a new upwards trend, but so far volume does not well support upwards movement (which is concerning for a bullish case).
Next resistance is about 37.
GDX DAILY CHART
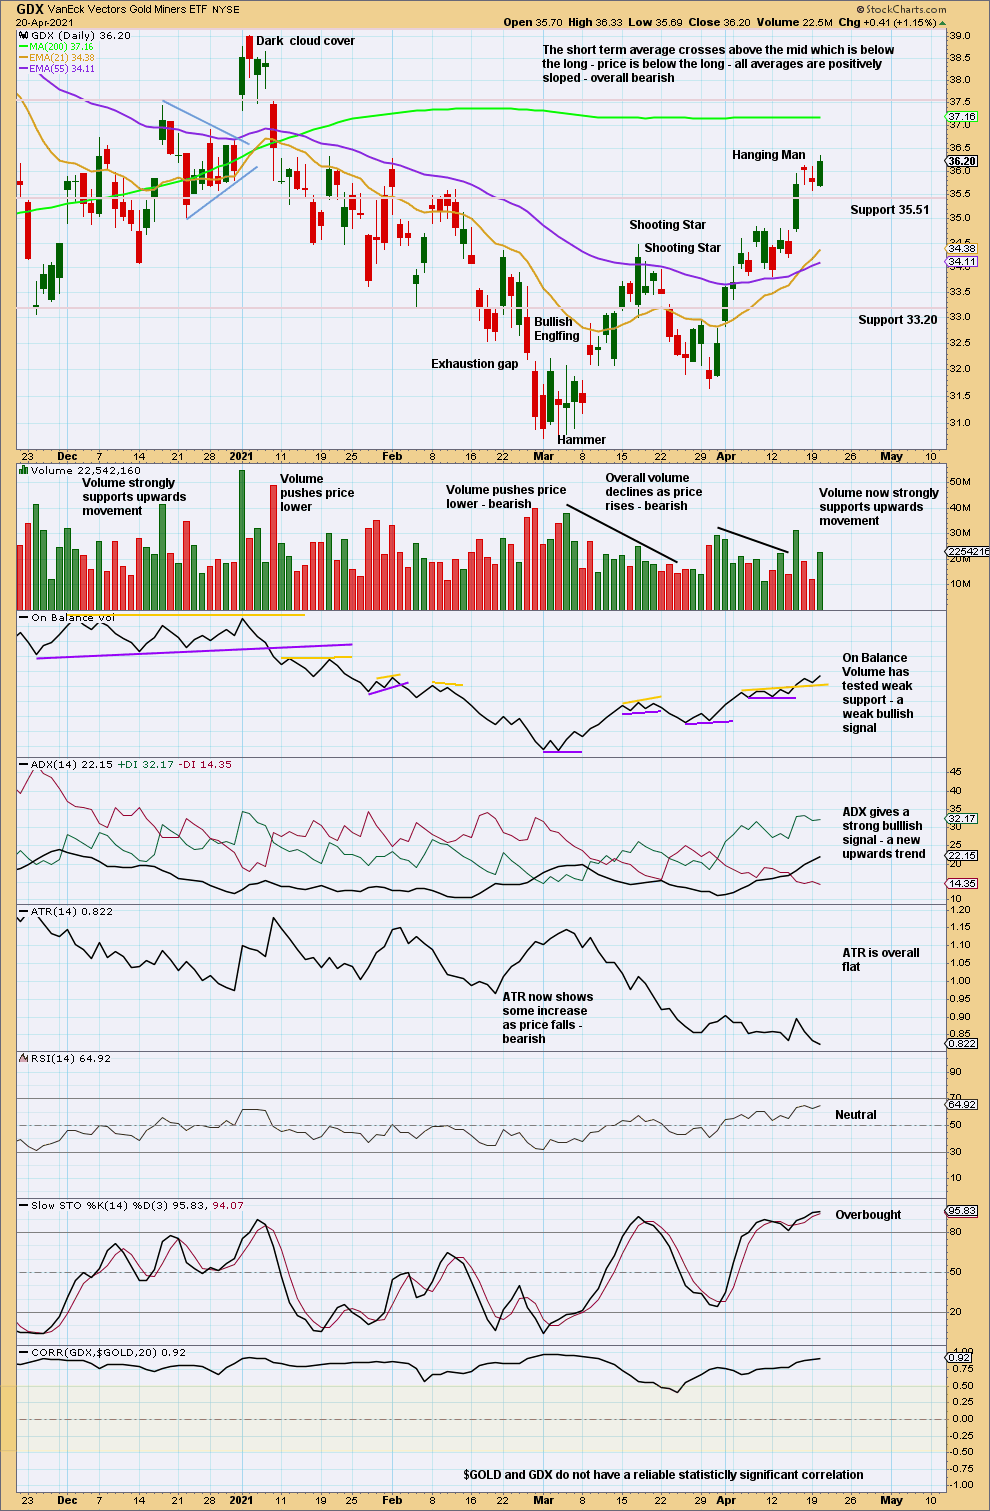
Click chart to enlarge. Chart courtesy of StockCharts.com.
ADX now indicates a new upwards trend.
GDX now looks more clearly bullish than Gold.
Next resistance is about 37.5.
Published @ 06:50 p.m. ET.
—
Careful risk management protects your trading account(s).
Follow my two Golden Rules:
1. Always trade with stops.
2. Risk only 1-5% of equity on any one trade.
—
New updates to this analysis are in bold.