
Lara’s Weekly: Elliott Wave and Technical Analysis of S&P500 and Gold and US Oil | Charts – April 16, 2021

S&P 500
Upwards movement continues. This analysis has long been very bullish.
The next target is getting closer. Two short-term ideas are outlined on how price may behave along the way up to the target.
Summary: The wave count is now very bullish. It expects a third wave at three large degrees may have moved through its middle and may now be completing.
A new short-term target is at 4,276. At this stage, price may now have an almost straight run up towards this target.
About this short-term target at 4,276 a pullback or consolidation to last about one to two weeks may begin.
The next mid-term target for the upwards trend is at 4,464 or 4,922. About one of these targets another multi-week pullback or consolidation may develop.
The biggest picture, Grand Super Cycle analysis, is here.
Last monthly charts are here. Video is here.
MAIN WAVE COUNT
WEEKLY CHART
Click chart to enlarge.
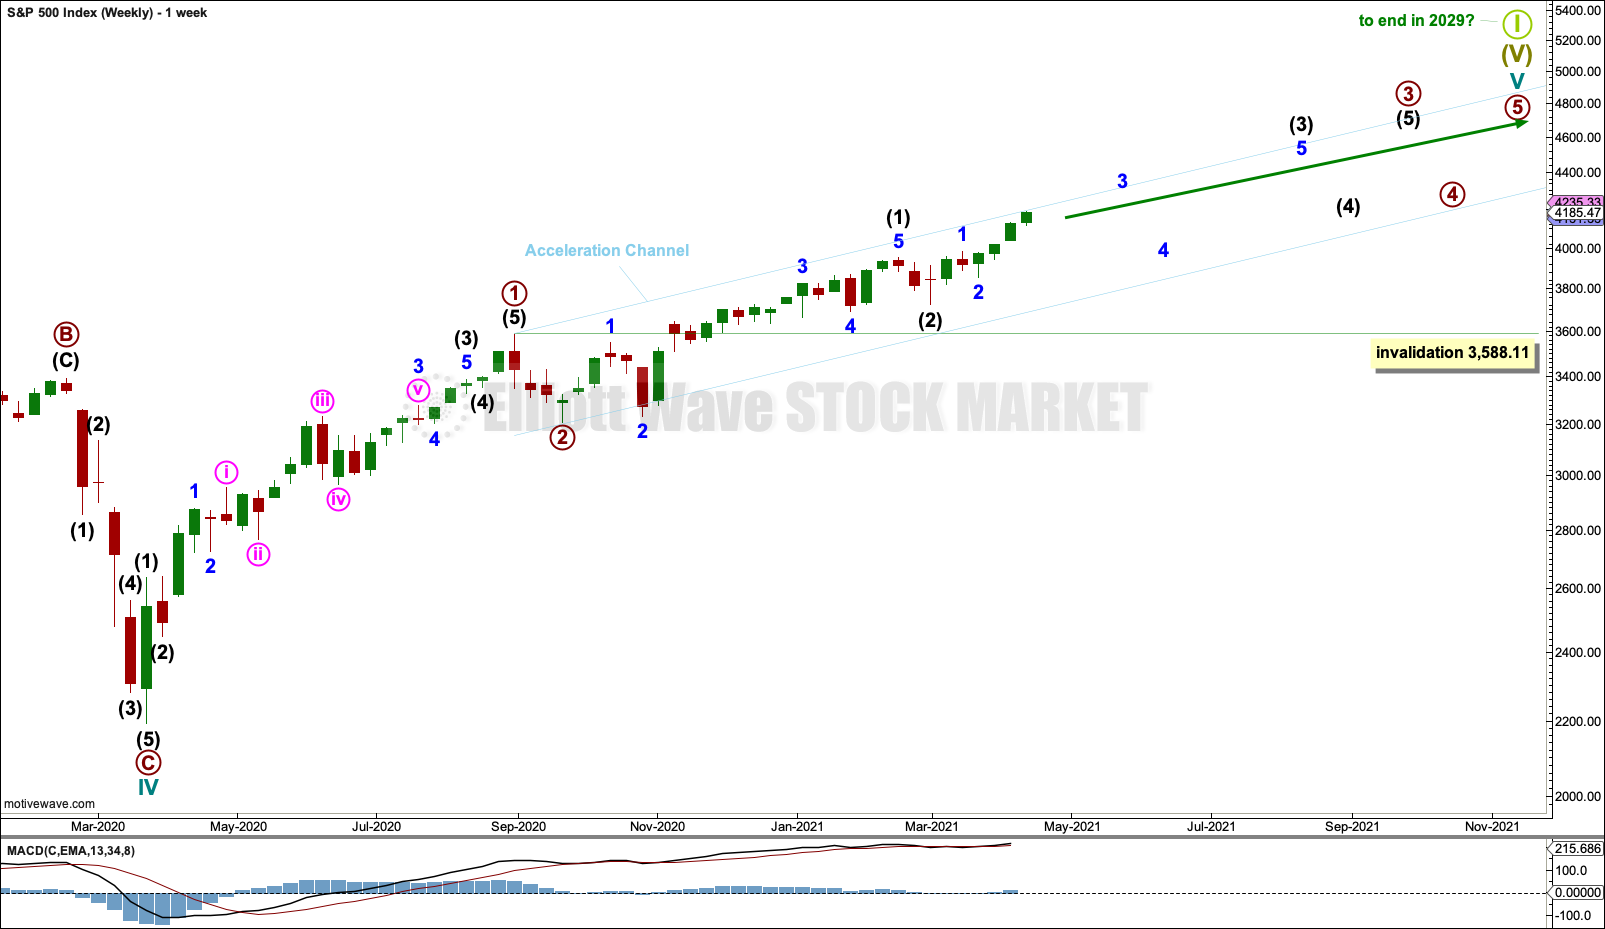
Cycle wave V may last from one to several years. So far it is in its thirteenth month.
This wave count may allow time for the AD line to diverge from price as price makes final highs before the end of the bull market. The AD line most commonly diverges a minimum of 4 months prior to the end of a bull market. A longer divergence is positively correlated with a deeper bear market. A shorter divergence is positively correlated with a more shallow bear market. With zero divergence at this stage, if a surprise bear market does develop here, then it would likely be shallow.
A longer divergence between price and the AD line would be expected towards the end of Grand Super Cycle wave I.
It is possible that cycle wave V may continue until 2029, if the 2020s mirror the 1920s.
Cycle wave V would most likely subdivide as an impulse. But if overlapping develops, then an ending diagonal should be considered. This chart considers the more common impulse.
Primary waves 1 and 2 may be complete.
Primary wave 3 may only subdivide as an impulse.
Primary wave 3 has now moved well above the end of primary wave 1. Primary wave 4 may not move into primary wave 1 price territory below 3,588.11.
There is already a Fibonacci ratio between cycle waves I and III within Super Cycle wave (V). The S&P500 often exhibits a Fibonacci ratio between two of its actionary waves but rarely between all three; it is less likely that cycle wave V would exhibit a Fibonacci ratio. The target for Super Cycle wave (V) to end would best be calculated at primary degree, but that cannot be done until all of primary waves 1, 2, 3 and 4 are complete.
The blue weekly best fit channel is slightly adjusted, so that the lower edge may better show where price may find support. Copy this over to the daily chart. Price has closed above the upper edge of this channel, which is bullish.
An acceleration channel is now drawn about cycle wave V. Draw the first trend line from the end of primary wave 1 to the last high, then place a parallel copy on the end of primary wave 2. Keep redrawing the channel as price continues higher. When primary wave 3 is complete, then this channel would be drawn using Elliott’s first technique and may show were primary wave 4 may find support.
DAILY CHART
Click chart to enlarge.
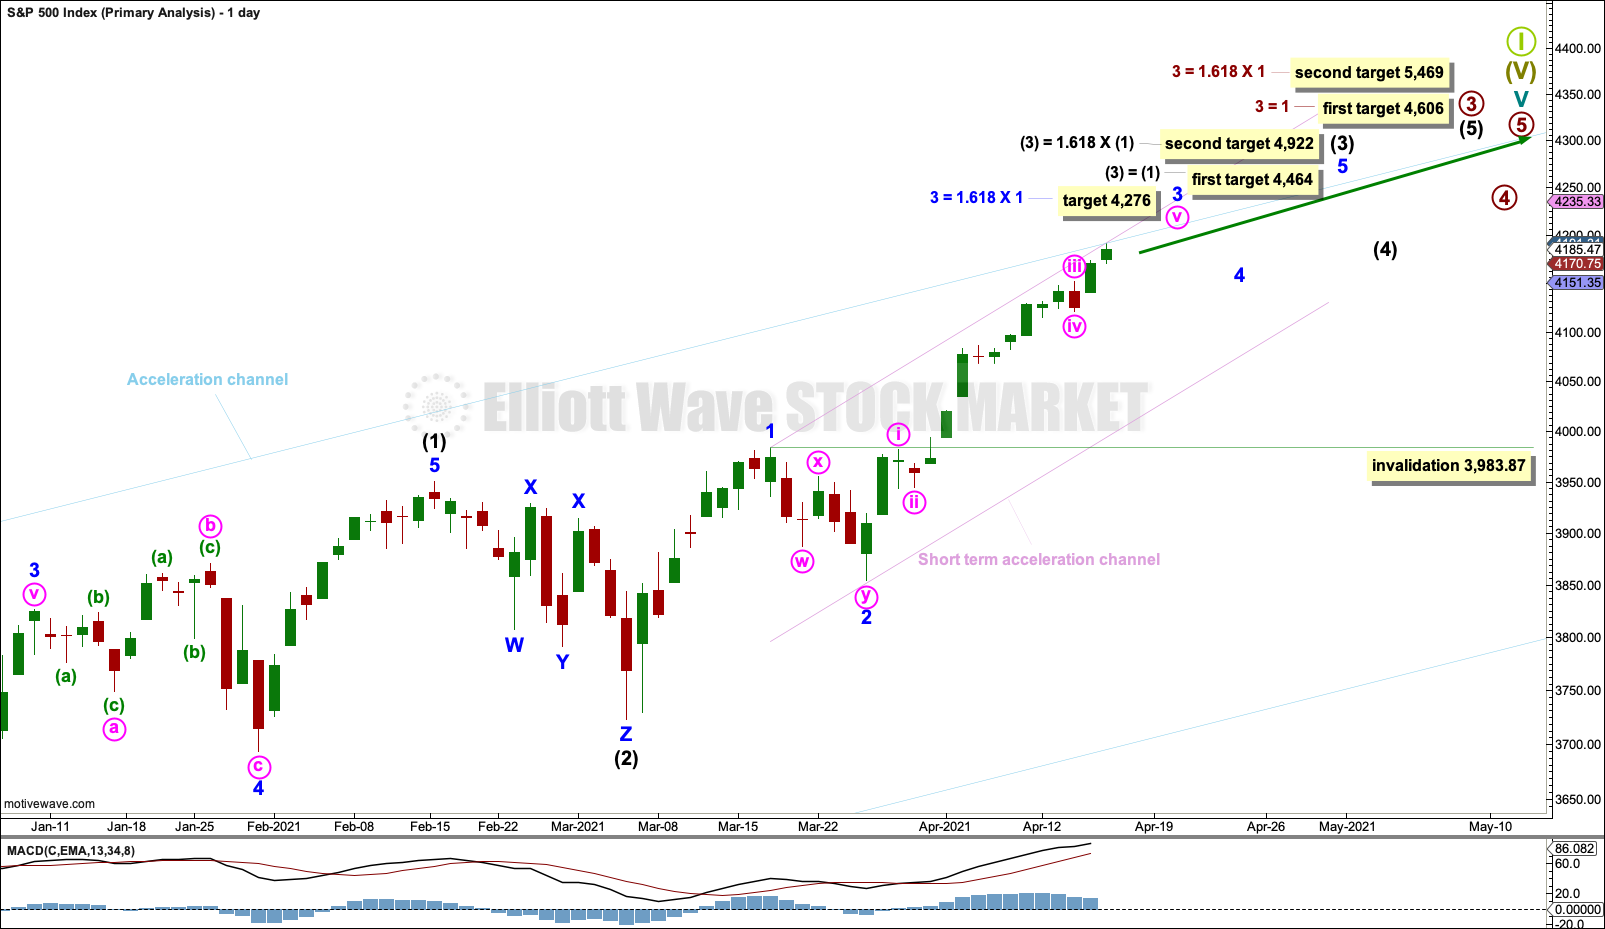
The daily chart focusses on the unfolding impulse of primary wave 3 from the end of intermediate wave (1) within it.
Intermediate wave (1) within primary wave 3 may be complete.
Intermediate wave (2) may also be complete as a triple zigzag.
Intermediate wave (3) within primary wave 3 may now be underway and may have passed its middle.
Minor waves 1 and 2 within intermediate wave (3) may now be complete. Minor wave 3 may now be underway. When minor wave 3 is complete, then the following pullback or consolidation for minor wave 4 may last about one to two weeks and may not move into minor wave 1 price territory below 3,983.87.
Targets are calculated for intermediate wave (3) and for primary wave 3. As price approaches the first target for intermediate wave (3) and if the structure is complete and technical analysis suggests a pullback may occur, then the target may be useful. But if price moves through the first target or the structure is incomplete, then the second target may be used.
The current upwards wave for this wave count is expected to be a third wave at minor, intermediate and primary degree.
Add a short-term acceleration channel to the middle of this third wave. Draw the first trend line from the end of minor wave 1 to the last high, then place a parallel copy on the end of minor wave 2. Keep redrawing this channel as price continues higher. When minor wave 3 may be complete, then this channel would be drawn using Elliott’s first technique and may show where minor wave 4 may find support.
ALTERNATE WAVE COUNT
WEEKLY CHART
Click chart to enlarge.
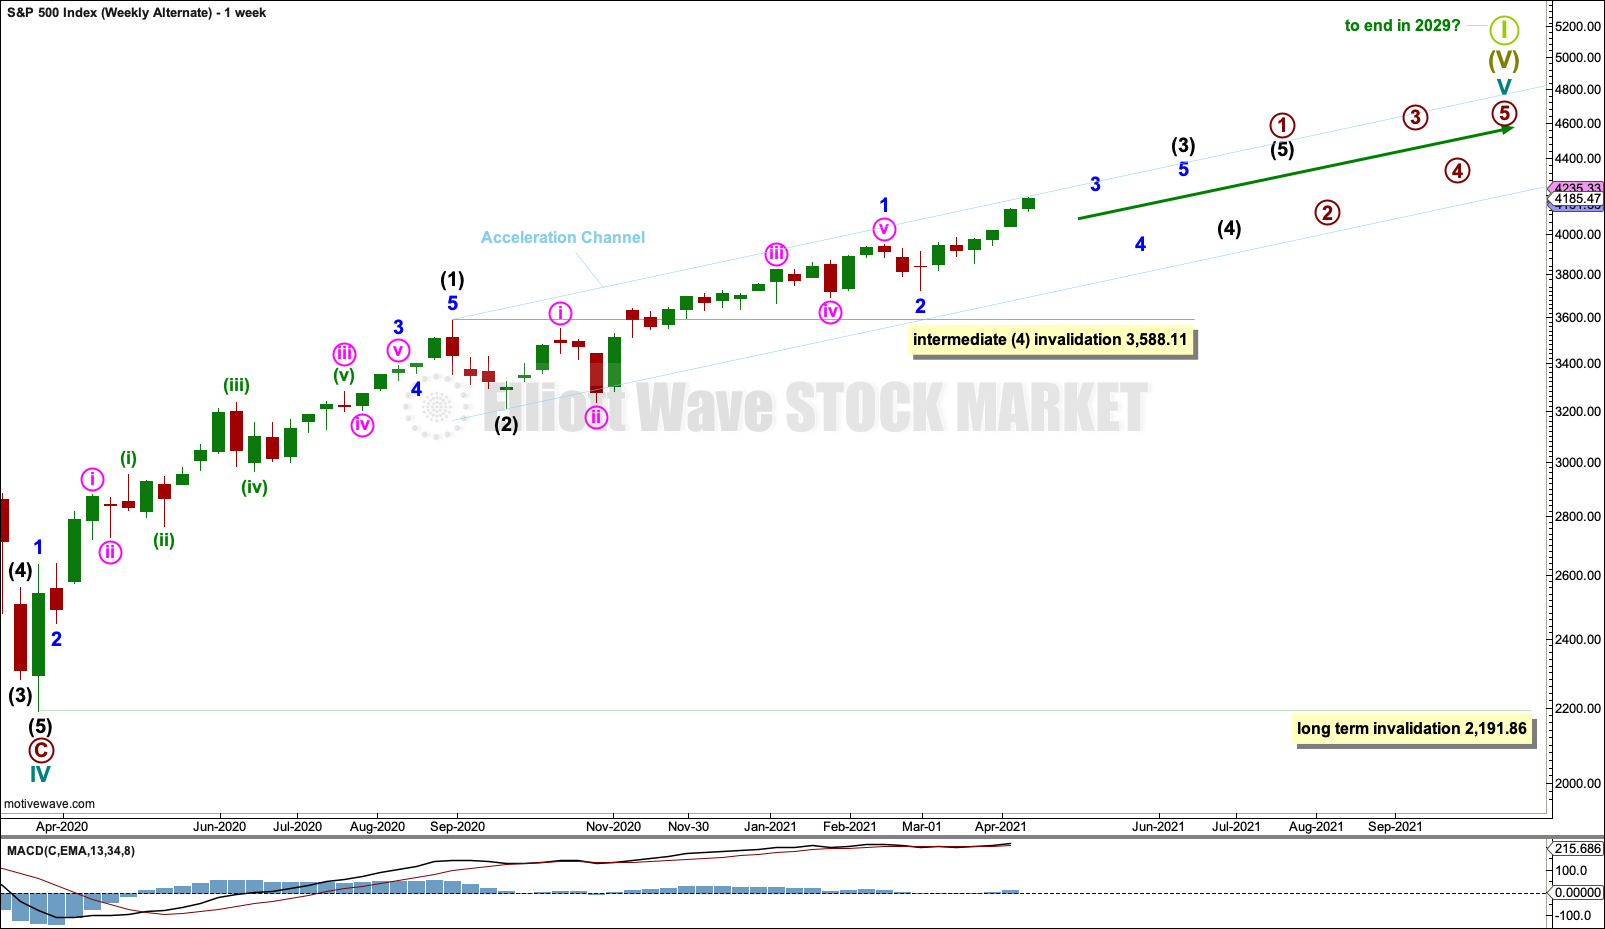
This wave count sees subdivisions within cycle wave V the same except the degree of labelling is moved down one degree. Primary wave 1 within cycle wave V may be incomplete.
Within primary wave 1: Intermediate waves (1) and (2) may be complete, intermediate wave (3) may be extending, and intermediate wave (4) may not move into intermediate wave (1) price territory below 3,588.11.
When primary wave 1 may be complete (in several months time), then a deeper and longer lasting pullback for primary wave 2 may unfold. Primary wave 2 may not move beyond the start of primary wave 1 below 2,191.86.
TECHNICAL ANALYSIS
WEEKLY CHART
Click chart to enlarge. Chart courtesy of StockCharts.com.
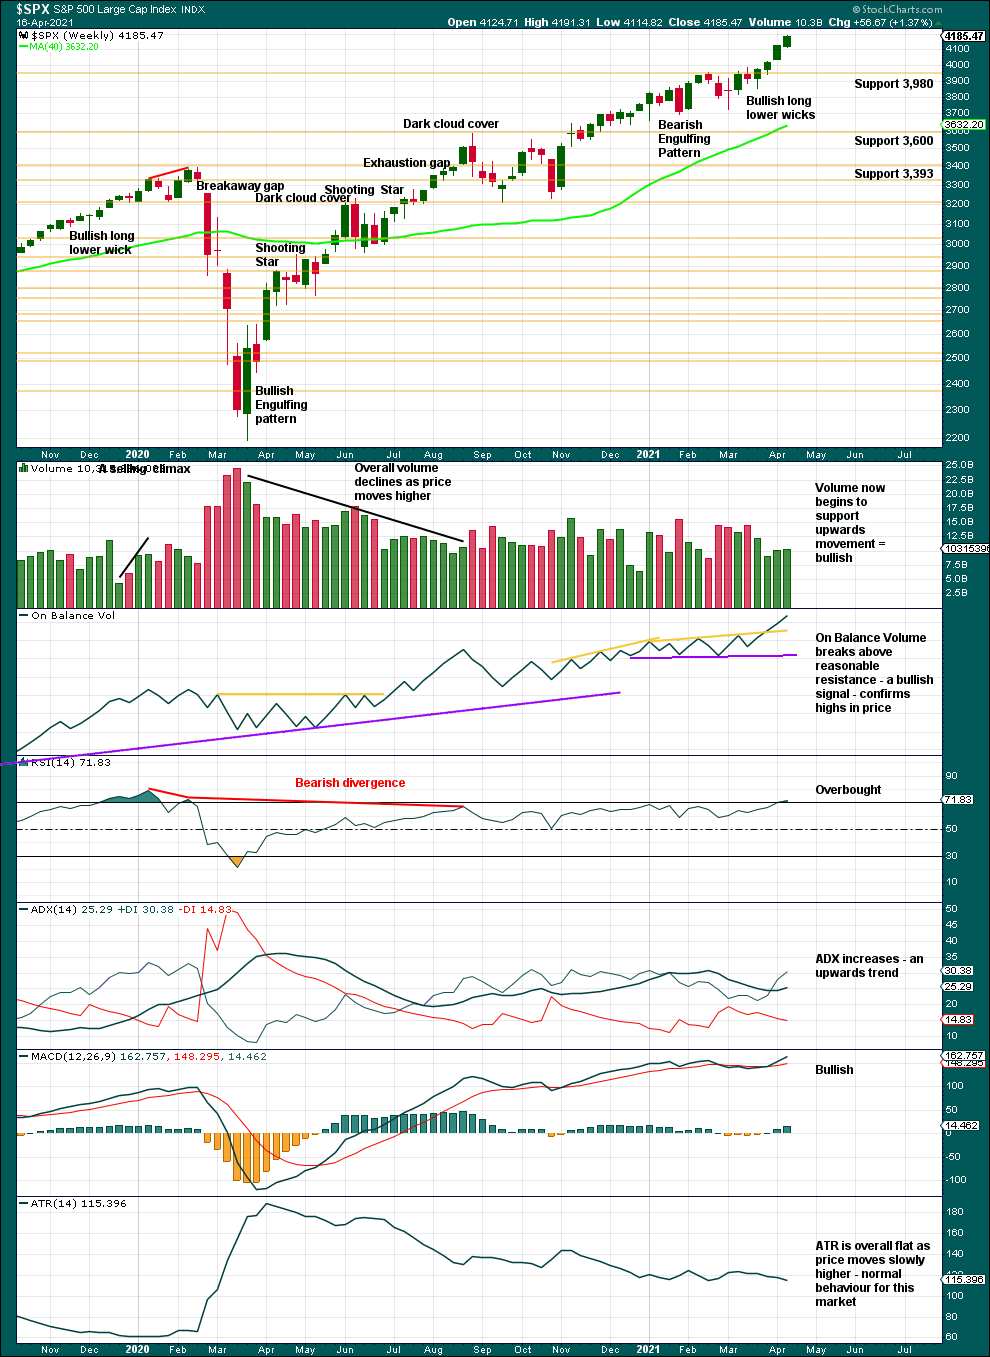
A series of higher highs and higher lows off the low of March 2020 continues. The last short-term swing low is now at 3,723.34. While this remains intact, the dominant view should be of an upwards trend. There is a long way for this trend to run before conditions may become extreme.
This chart has the look of a sustainable bull market in a relatively early stage; there is as yet no evidence that a larger correction should begin here. Although RSI has just now reached overbought, this market has a strong bullish bias and RSI can move deeply overbought and remain there for years prior to the bull market ending (for an example see May 1995 to March 2000).
WEEKLY CHART – MAY 1995 to MARCH 2020
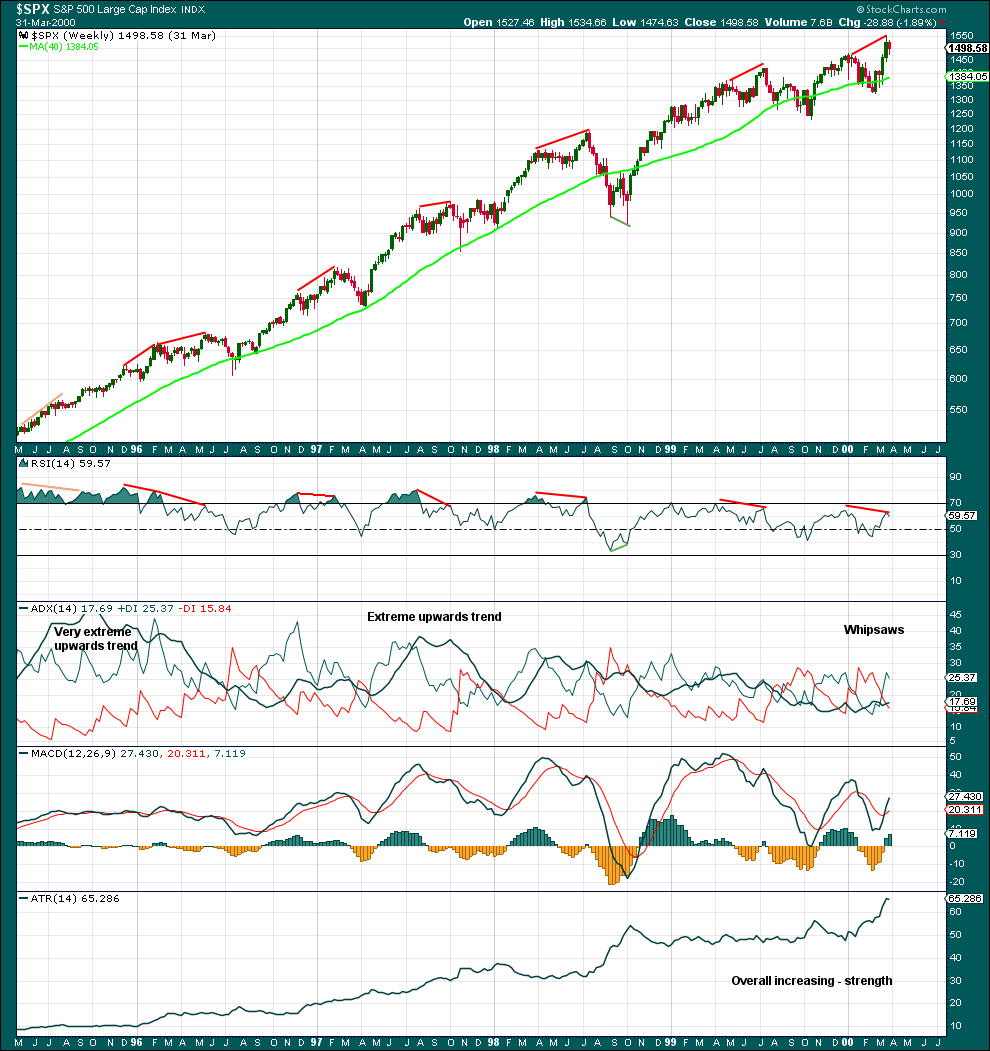
Click chart to enlarge. Chart courtesy of StockCharts.com.
The chart above covers the period of a strong bull market during May 1995 to March 2000. The last green weekly candlestick includes the high of March 24, 2000; following this was the DotCom crash.
This chart illustrates how this market, with a strong bullish bias, can sustain extreme conditions for a long period of time. Multiple instances of short-term bearish divergence between price and RSI were resolved by short to mid-term pullbacks before the bullish trend resumed. Over years longer term bearish divergence between price and RSI developed before the bullish trend was over.
ADX reached very extreme early on in this trend and was sustained for months while price travelled a considerable distance. Early on in the left hand side of the chart, illustrated by brown trend lines on price and RSI, RSI exhibited reasonably weak short-term bearish divergence and yet price continue higher for months.
Conclusion: It is important to read divergence between price and RSI carefully. For confidence in a signal the divergence should be between swing highs that are reasonably close together (one to three months) but not too close together (days or only a very few weeks), and it should be clear and strong. If this occurs while ADX is also extreme, then the bearish signal is stronger and may result in a more time consuming or deeper pullback.
The current situation with RSI and ADX does not suggest a pullback should begin here.
DAILY CHART
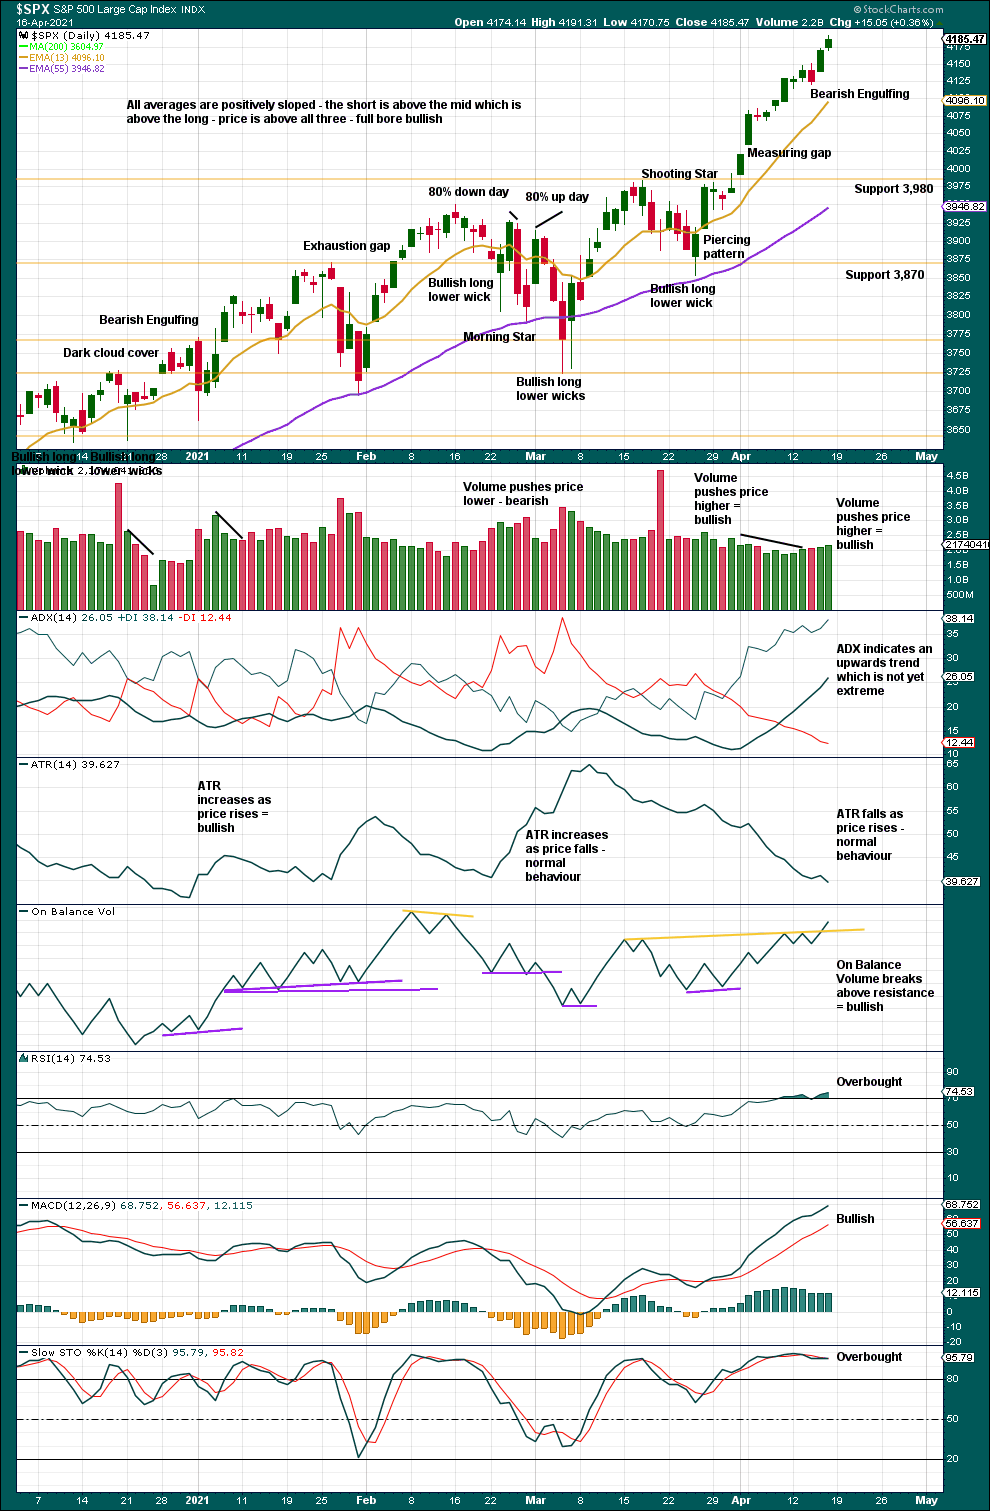
Click chart to enlarge. Chart courtesy of StockCharts.com.
The series of higher highs and higher lows from the low of the 30th of October continues.
The last swing low is the 25th of March at 3,853.50. While this remains intact, the upwards trend may be assumed to continue. Pullbacks are a normal and to be expected part of a bullish trend. If a pullback develops here or soon, then it may test support about 3,980 or the round number pivot at 4,000.
ADX is not extreme. There is plenty of room for an upwards trend to continue. This market has a strong bullish bias. RSI may reach deeply overbought and then exhibit divergence between swing highs before a more substantial pullback occurs to relieve extreme conditions. That set up may not come until minor waves 3, 4 and 5 are complete.
The measuring gap gives a target at 4,201.57. This gap may offer support at 4,020.63.
Declining volume has for years been a feature of this bull market. In the long term it may become a problem as when a bear market arrives support below would be thin and price may fall dramatically, but for now the bull market remains healthy and has proven to be able to rise sustainably on light and declining volume. At this stage, it is not of a concern for the Elliott wave count.
Volume and On Balance Volume are both bullish. At this stage, there is no technical evidence that this bull run may end in the immediate future.
BREADTH – AD LINE
WEEKLY CHART
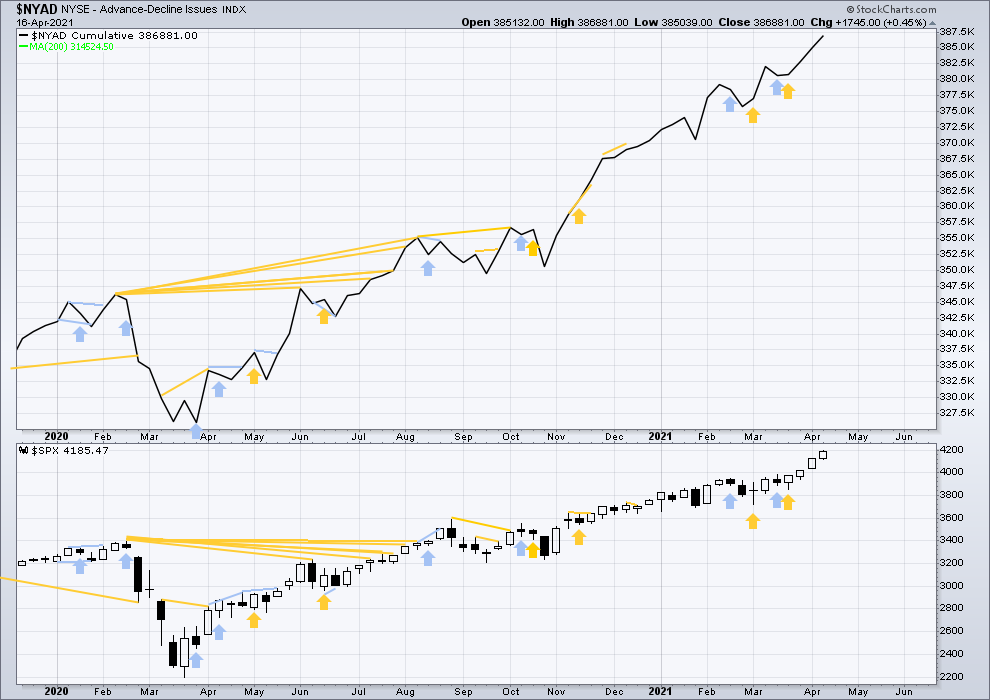
Click chart to enlarge. Chart courtesy of StockCharts.com. So that colour blind members are included, bearish signals will be noted with blue and bullish signals with yellow.
Breadth should be read as a leading indicator.
Lowry’s Operating Companies Only AD line has made a new all time high on the 15th of March. This supports the main Elliott wave count.
Large caps all time high: 4,191.31 on April 16, 2021.
Mid caps all time high: 2,727.46 on April 16, 2021.
Small caps all time high: 1,399.31 on March 12, 2021.
The last new high is found in large and mid caps. With large caps leading and small caps lagging, this last rise is bearish for the short term. This fits with the Elliott wave count that now sees a third wave in its last stages prior to a pullback or consolidation for minor wave 4. Small caps can lag and large caps can lead for some time while price travels a reasonable distance. Lagging small caps at this stage does not necessarily mean price must turn here.
Again, this week both price and the AD line have made new all time highs at the weekly chart level. This is bullish.
DAILY CHART
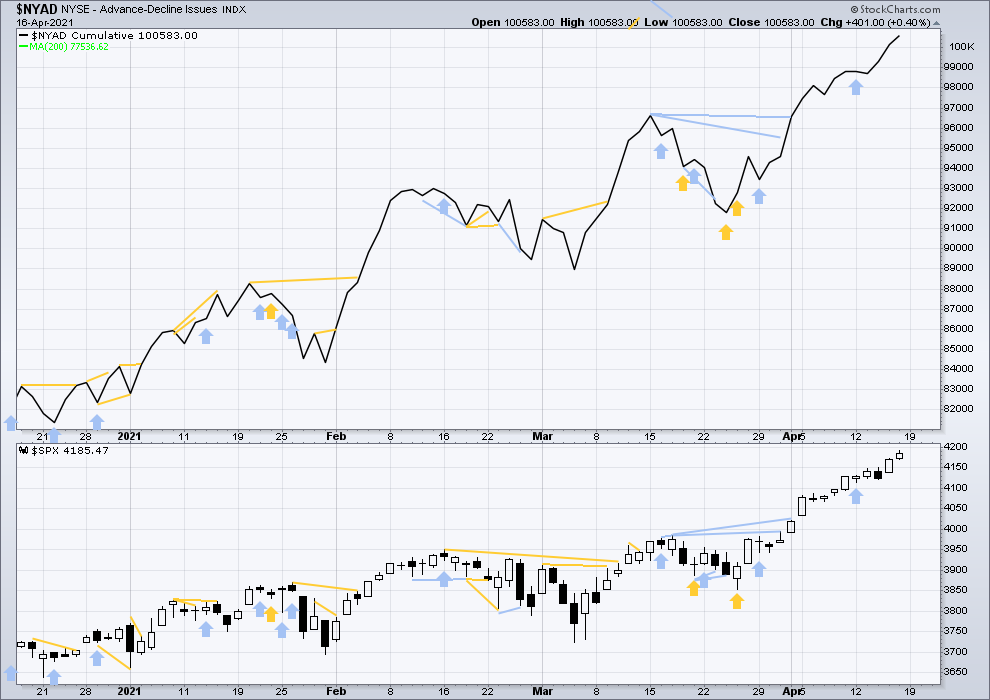
Click chart to enlarge. Chart courtesy of StockCharts.com. So that colour blind members are included, bearish signals will be noted with blue and bullish signals with yellow.
Again, price has made a new all time high with support from overall rising breadth as the AD line also makes a new all time high. This is bullish.
VOLATILITY – INVERTED VIX CHART
WEEKLY CHART
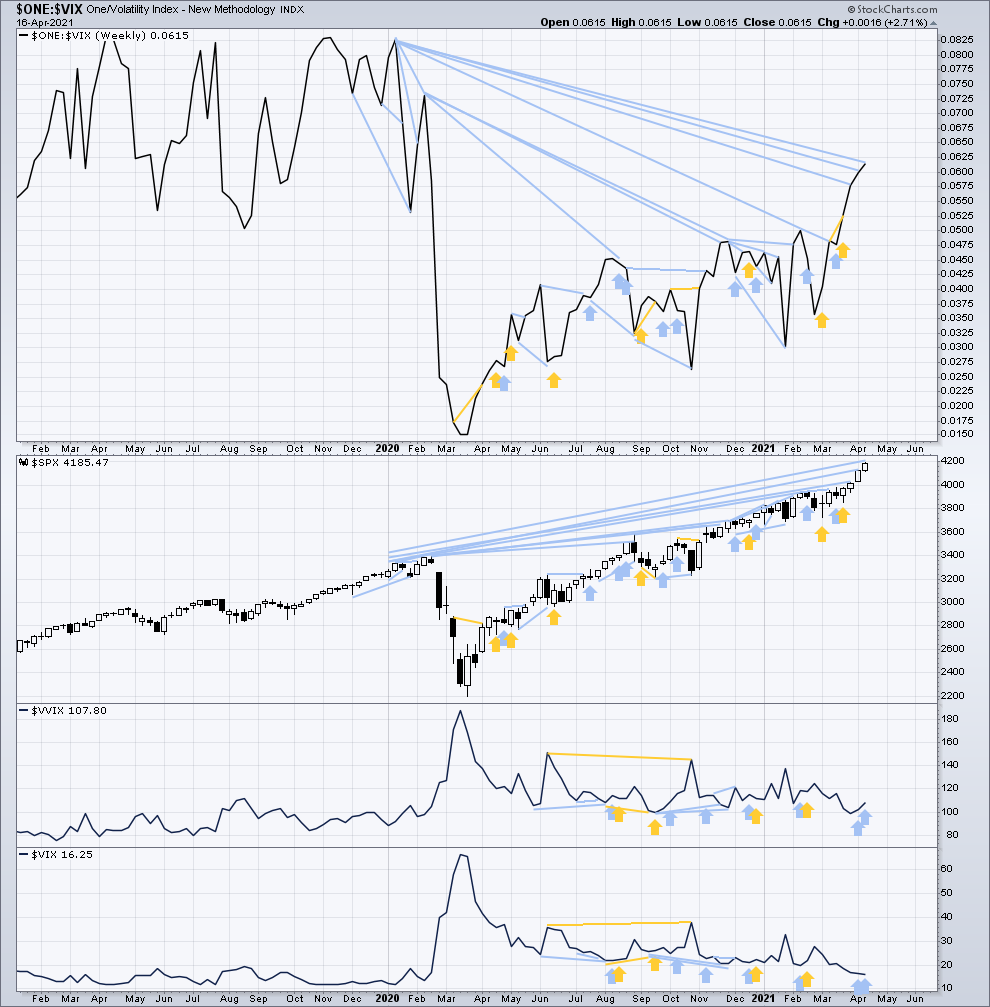
Click chart to enlarge. Chart courtesy of StockCharts.com. So that colour blind members are included, bearish signals will be noted with blue and bullish signals with yellow.
Inverted VIX remains well below all time highs. The all time high for inverted VIX was in the week beginning October 30, 2017. There is over 3 years of bearish divergence between price and inverted VIX. This bearish divergence may develop further before the bull market ends. It may be a very early indicator of an upcoming bear market, but it is not proving to be useful in timing.
Again, this week both price and inverted VIX have moved higher, but only price has made a new all time high. There is now mid and long-term bearish divergence, but there is no short-term bearish divergence.
Comparing VIX and VVIX at the weekly chart level:
This week VIX has moved lower, but VVIX has moved higher. There are now two single week instances of divergence, which is bearish for price for the short term. This may be an early warning of the approaching end of minor wave 3; it may develop further before a consolidation or pullback results.
DAILY CHART
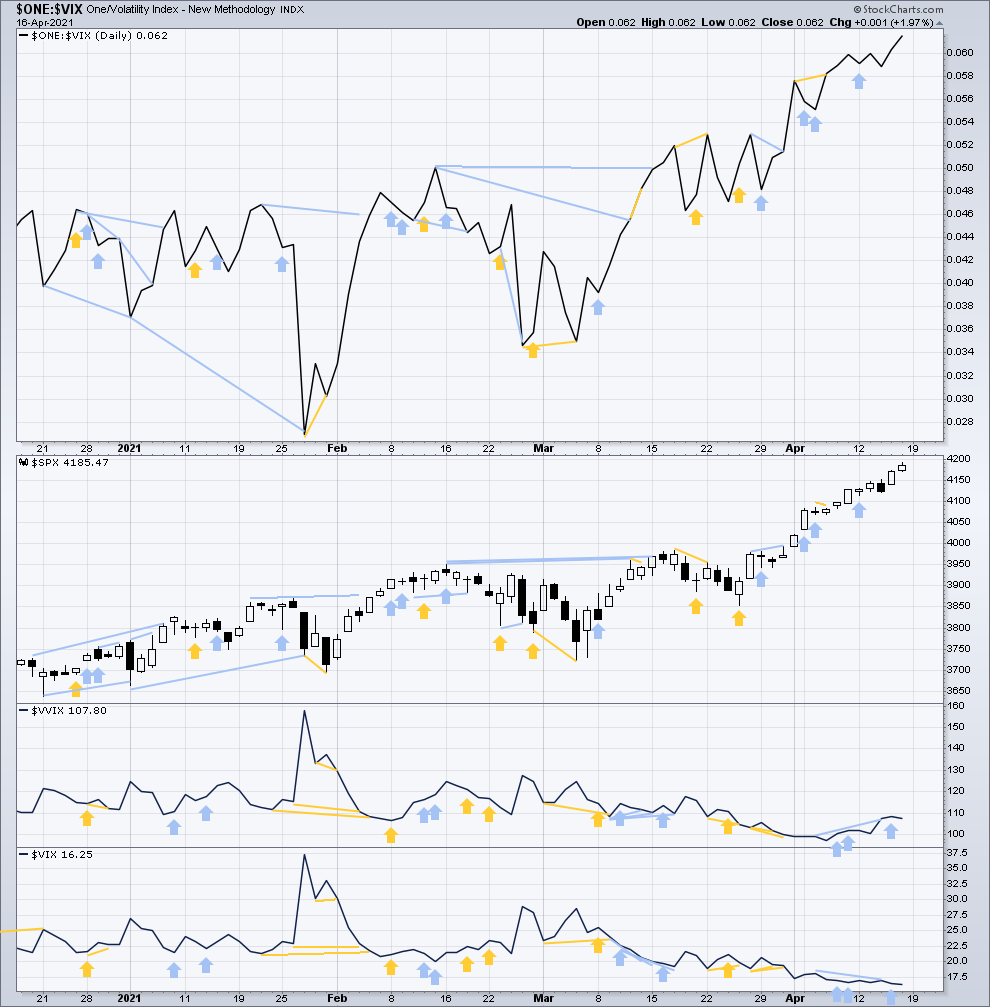
Click chart to enlarge. Chart courtesy of StockCharts.com. So that colour blind members are included, bearish signals will be noted with blue and bullish signals with yellow.
Again, price and inverted VIX have both made new short and mid-term highs. There is no new short or mid-term divergence.
Comparing VIX and VVIX at the daily chart level:
Both VIX and VVIX have moved lower for Friday. There is still a small cluster of short-term bearish divergence.
DOW THEORY
Dow Theory confirms a new bull market with new highs made on a closing basis:
DJIA: 29,568.57 – closed above on 16th November 2020.
DJT: 11,623.58 – closed above on 7th October 2020.
Most recently, this week both DJIA and DJT have made new all time highs. An ongoing bull market is again confirmed by Dow Theory.
Adding in the S&P and Nasdaq for an extended Dow Theory, confirmation of a bull market would require new highs made on a closing basis:
S&P500: 3,393.52 – closed above on 21st August 2020.
Nasdaq: 9,838.37 – closed above on June 8, 2020.
The following major swing lows would need to be seen on a closing basis for Dow Theory to confirm a change from bull to a bear market:
DJIA: 18,213.65
DJT: 6,481.20
Adding in the S&P and Nasdaq for an extended Dow Theory, confirmation of a new bear market would require new lows on a closing basis:
S&P500: 2,191.86
Nasdaq: 6,631.42
GOLD
Last analysis expected upwards movement from both Elliott wave counts.
Summary: The first wave count is bearish for the bigger picture and classic technical analysis supports this view. This wave count expects a multi-year bear market may be in its early stages to end below 1,046.
This bounce may continue towards 1,803. When the bounce is over, then the next short-term target may be calculated.
A long-term target is at 657.
The second wave count is bullish. A new upwards wave may now have begun. The target is at 2,124.
Grand SuperCycle analysis and last monthly charts are here.
FIRST ELLIOTT WAVE COUNT
WEEKLY CHART
Click chart to enlarge.
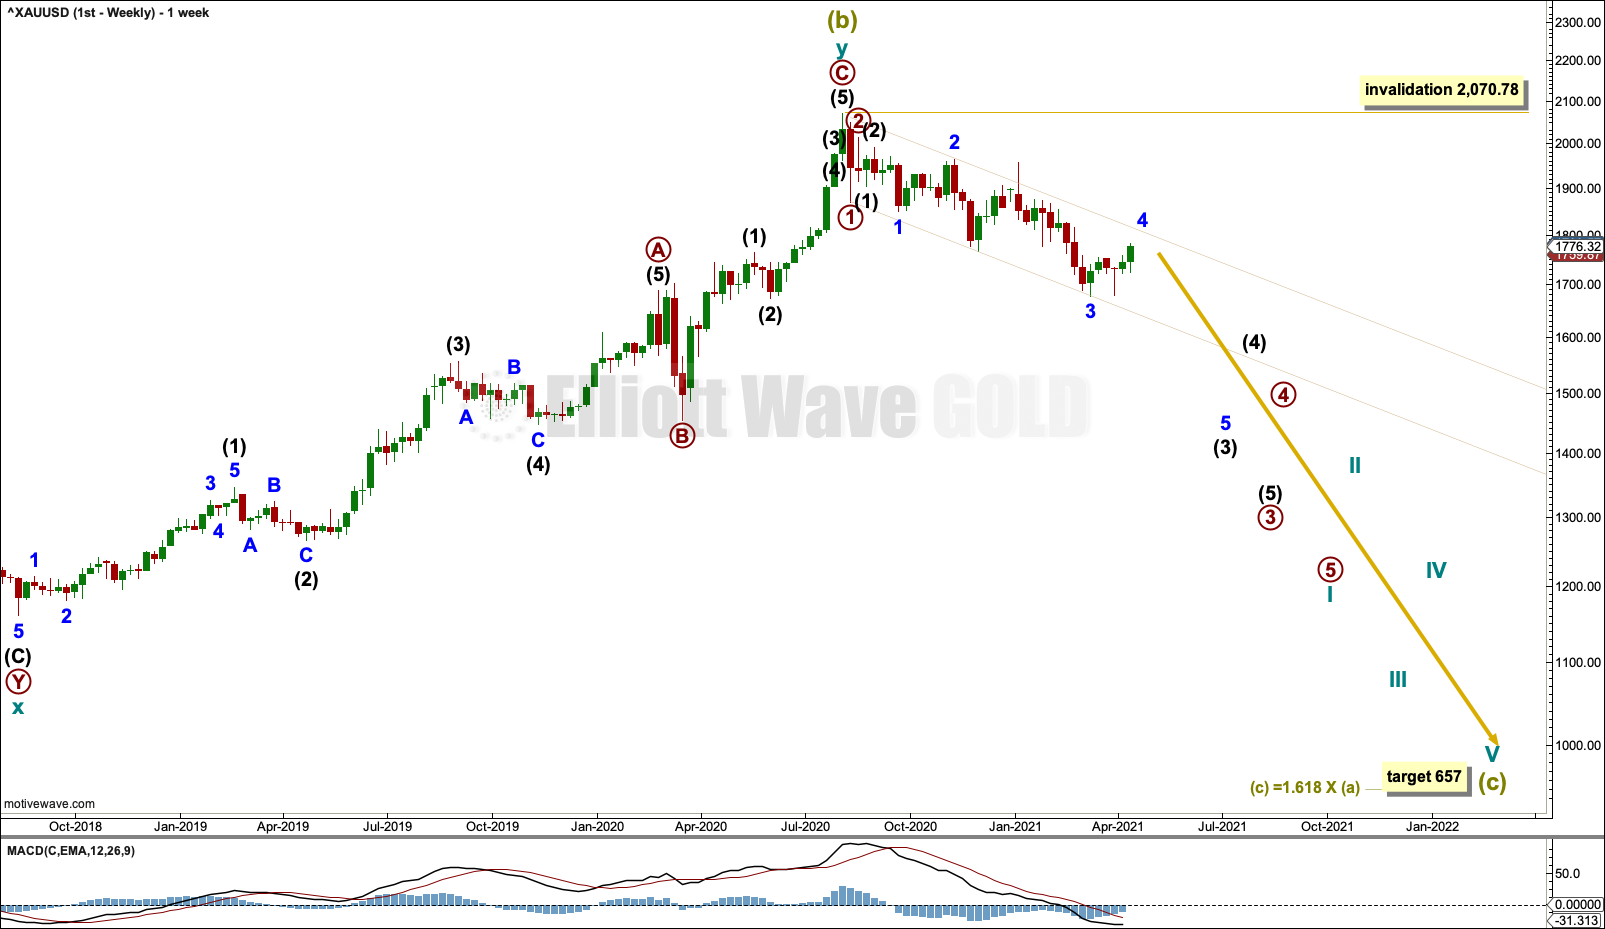
The bigger picture for this first Elliott wave count sees Gold as now within a bear market, in a three steps back pattern that is labelled Grand Super Cycle wave IV on monthly charts. Grand Super Cycle wave IV may be subdividing as an expanded flat pattern.
Super Cycle wave (b) within Grand Super Cycle wave IV may be a complete double zigzag. This wave count expects Super Cycle wave (c) to move price below the end of Super Cycle wave (a) at 1,046.27 to avoid a truncation and a very rare running flat. The target calculated expects a common Fibonacci ratio for Super Cycle wave (c).
DAILY CHART
Click chart to enlarge.
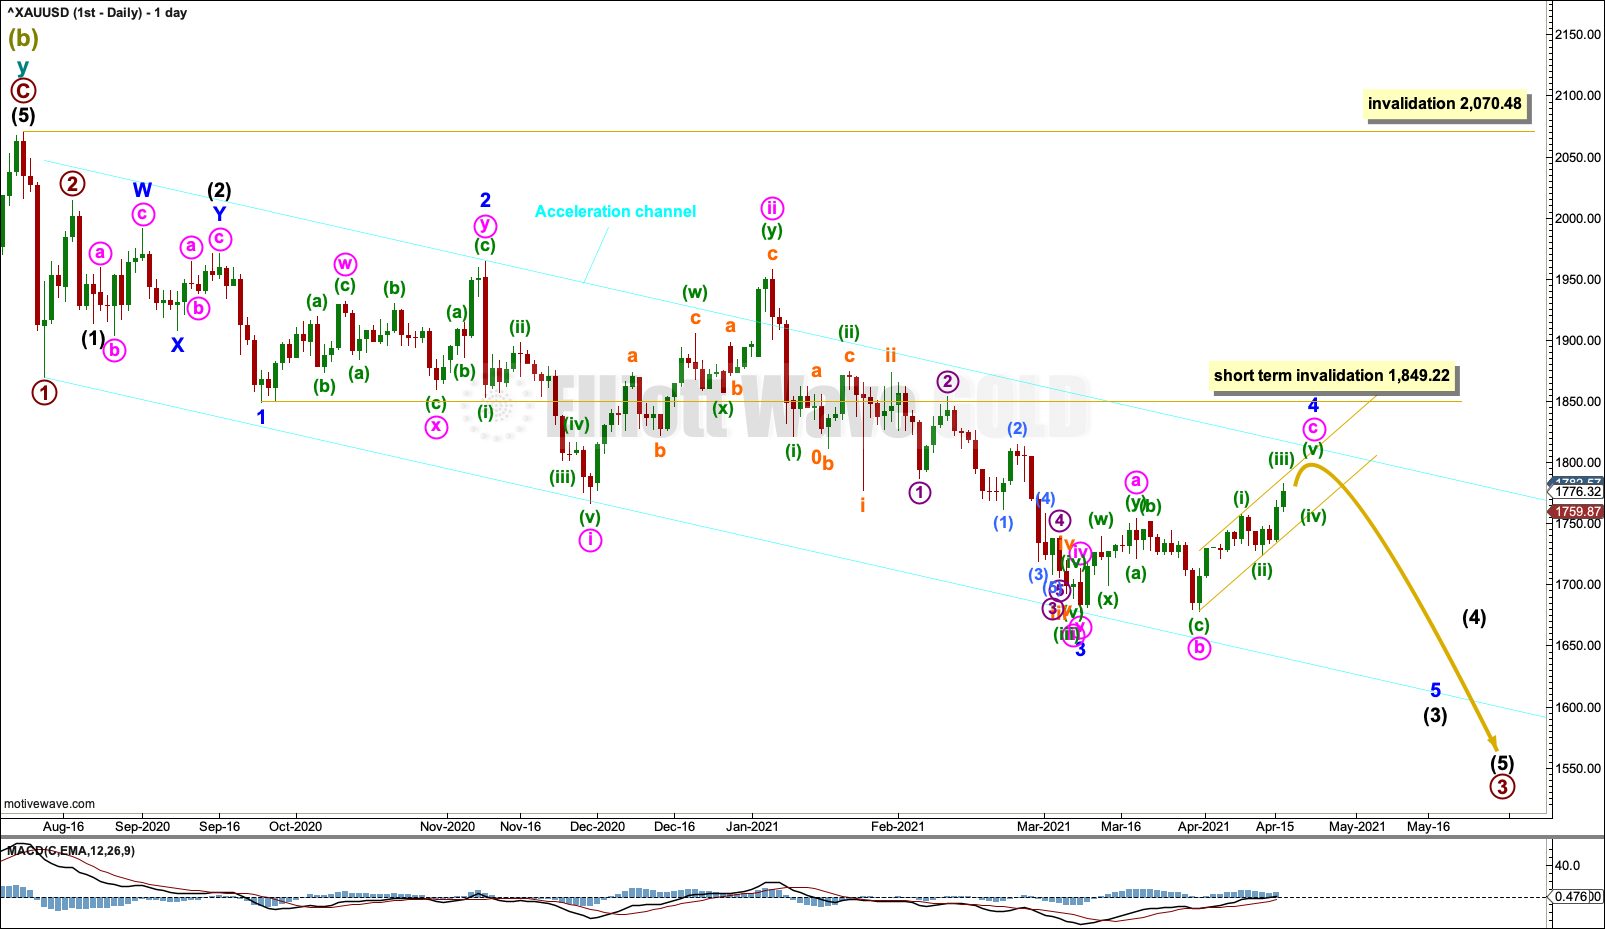
Within a new bear market, cycle wave I may be an incomplete five wave impulse.
Cycle wave II within the new downwards trend may not move beyond the start of cycle wave I above 2,070.48.
Gold typically exhibits extended and strong fifth waves; this tendency is especially prevalent for fifth waves to end third wave impulses one degree higher. One or both of minor wave 5 or intermediate wave (5) may exhibit this tendency; there may be one or more selling climaxes along the way down. Minute wave iv and minor wave 4 may be relatively brief and shallow.
Draw an acceleration channel about downwards movement. Draw the first trend line from the end of primary wave 1 to the last low, then place a parallel copy on the end of primary wave 2. Keep redrawing the channel as price continues lower. When primary wave 3 is complete, then this would be drawn using Elliott’s first technique and may show where primary wave 4 may find resistance.
Minor wave 4 may be unfolding as a flat. If it is deep, then it may find resistance at the upper edge of the cyan Acceleration channel.
Minor wave 4 may not move into minor wave 1 price territory above 1,849.22.
Draw a base channel about minute wave c within minor wave 4. From the start of minute wave c draw a trend line across the low of minuette wave (ii) within it, then place a parallel copy on the high of minuette wave (i). When this base channel is breached by downwards movement, then that may be an indication that minor wave 4 may be over.
SECOND ELLIOTT WAVE COUNT
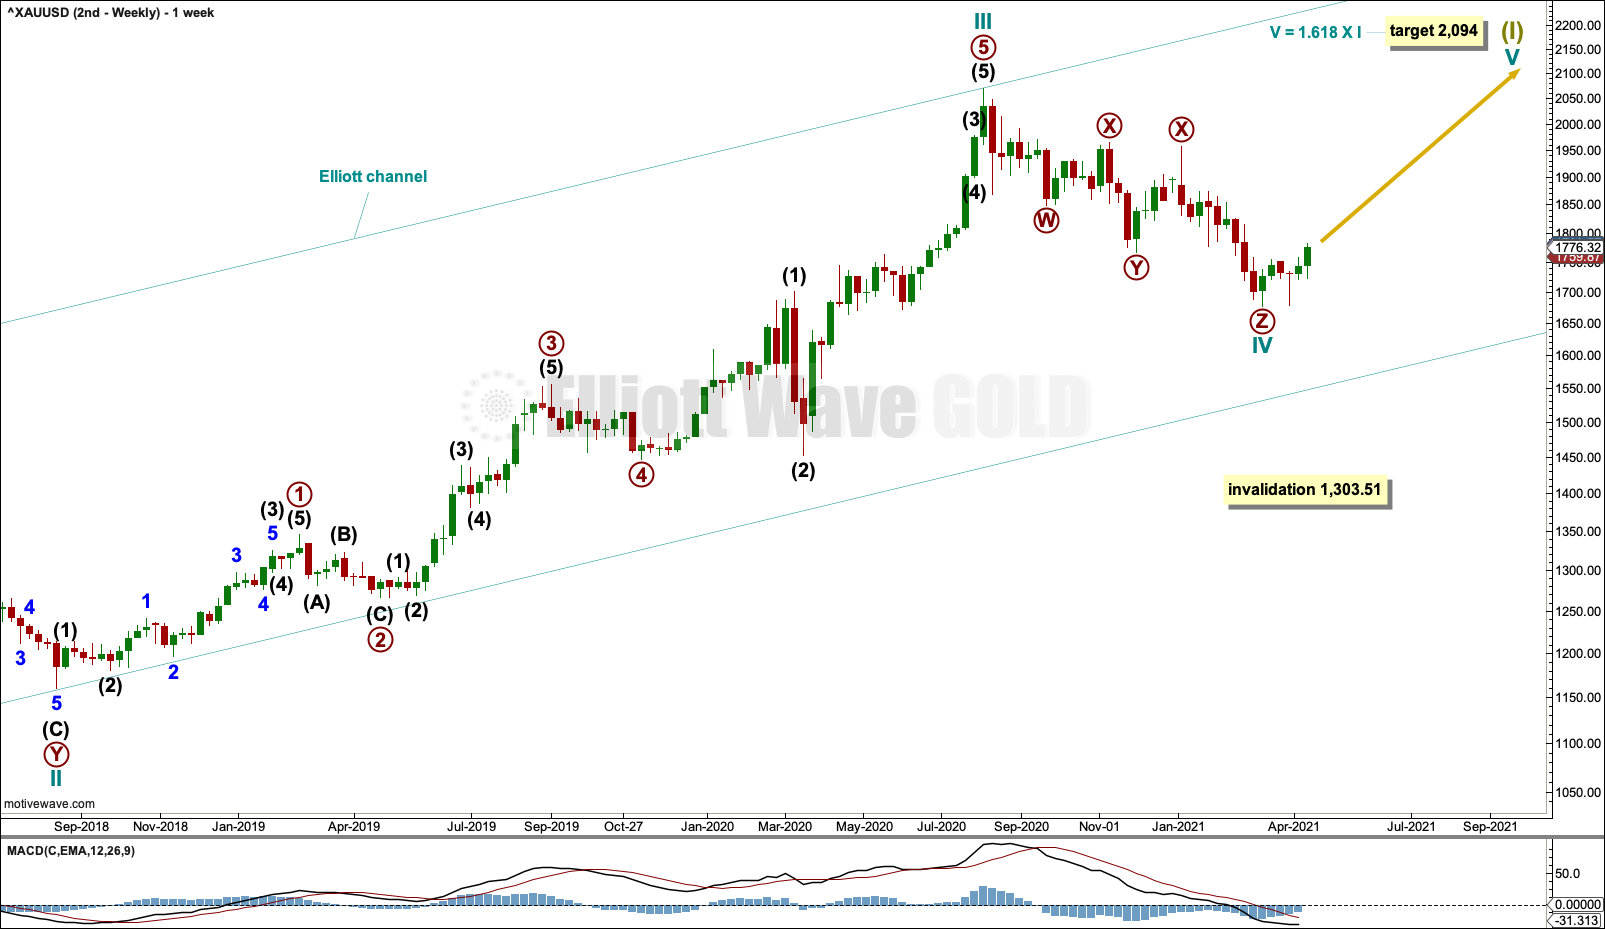
WEEKLY CHART
Click chart to enlarge.
This wave count sees the the bear market complete at the last major low for Gold on 3 December 2015.
If Gold is in a new bull market, then it should begin with a five wave structure upwards on the weekly chart.
Cycle wave I fits as a five wave impulse with reasonably proportionate corrections for primary waves 2 and 4.
Cycle wave II fits as a double flat. However, within the first flat correction labelled primary wave W, this wave count needs to ignore what looks like an obvious triangle from July to September 2016 (this can be seen labelled as a triangle on the second weekly chart on prior analysis here). This movement must be labelled as a series of overlapping first and second waves. Ignoring this triangle reduces the probability of this wave count in Elliott wave terms.
Cycle wave IV may be a complete triple zigzag. The rarity of triple zigzags reduces the probability of this wave count further.
If the third zigzag of primary wave Z continues lower, then cycle wave IV may not move into cycle wave I price territory below 1,303.51.
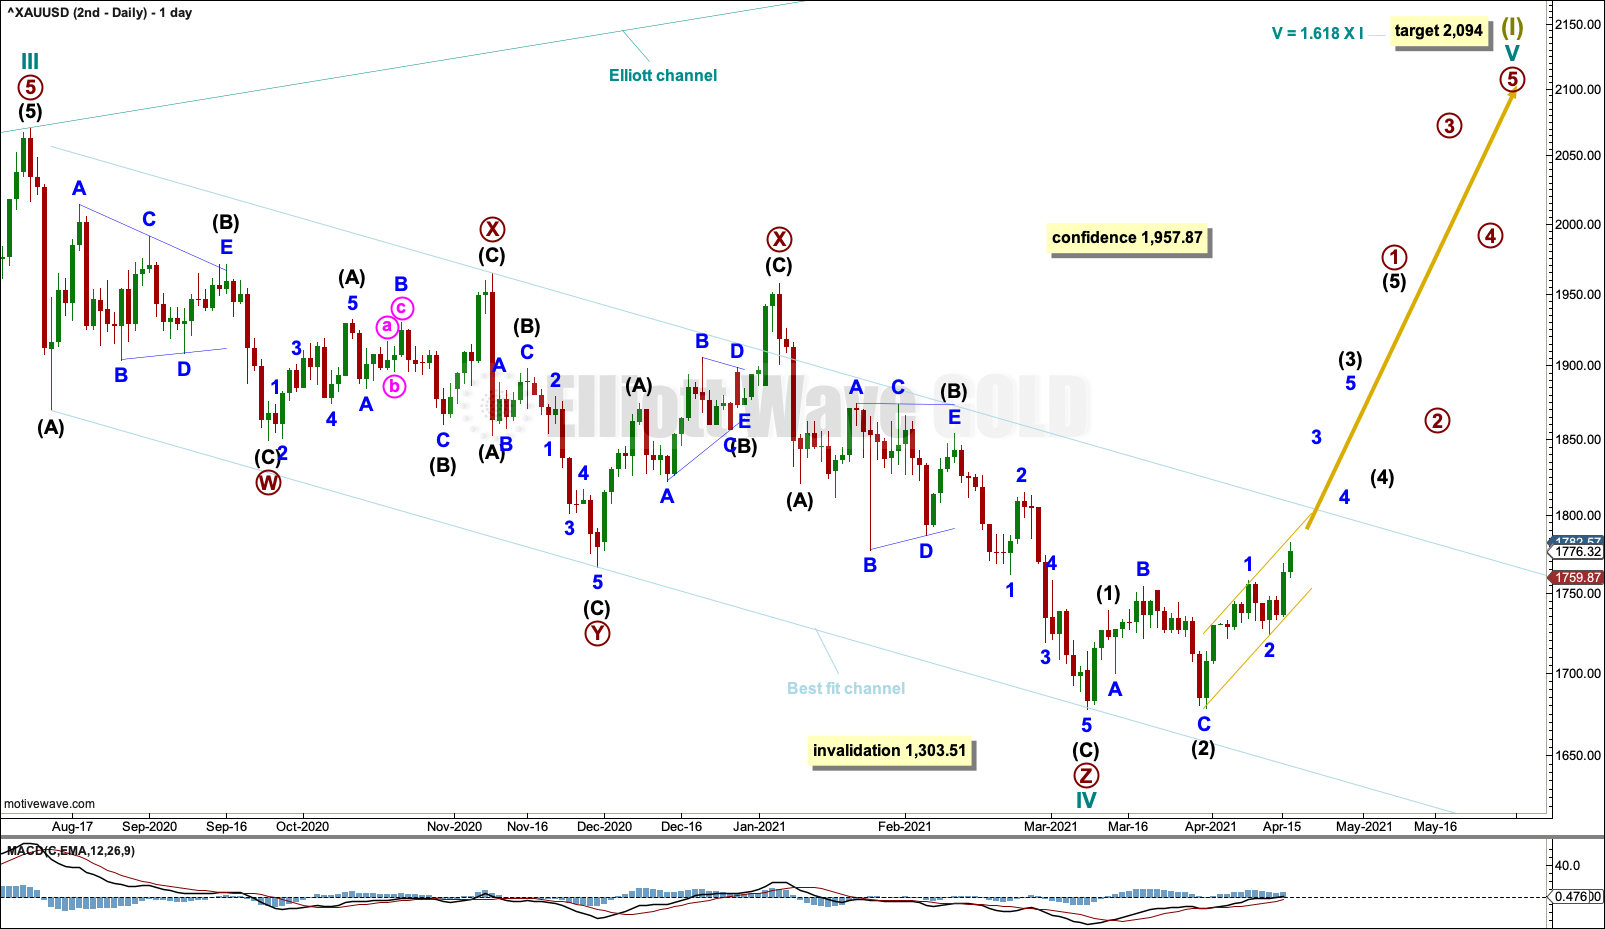
DAILY CHART
Click chart to enlarge.
Cycle wave IV may be a complete triple zigzag.
The purpose of multiple zigzags is to deepen a correction when the first zigzag does not move price deep enough. To achieve this purpose multiple zigzags normally have a clear counter trend slope. Cycle wave IV looks normal with a clear downwards slope.
A target is recalculated for cycle wave V. If cycle wave IV continues lower, then this target must again be recalculated.
A best fit channel is drawn about cycle wave IV. If this channel is breached by upwards movement with at least one full daily candlestick above and not touching the upper edge of the channel, then that may provide confidence in this second Elliott wave count. The upper edge of this channel at this stage is not breached and, in the first instance, resistance may be expected if price continues higher to the trend line.
Draw a base channel about the start of intermediate wave (3) as shown.
TECHNICAL ANALYSIS
WEEKLY CHART
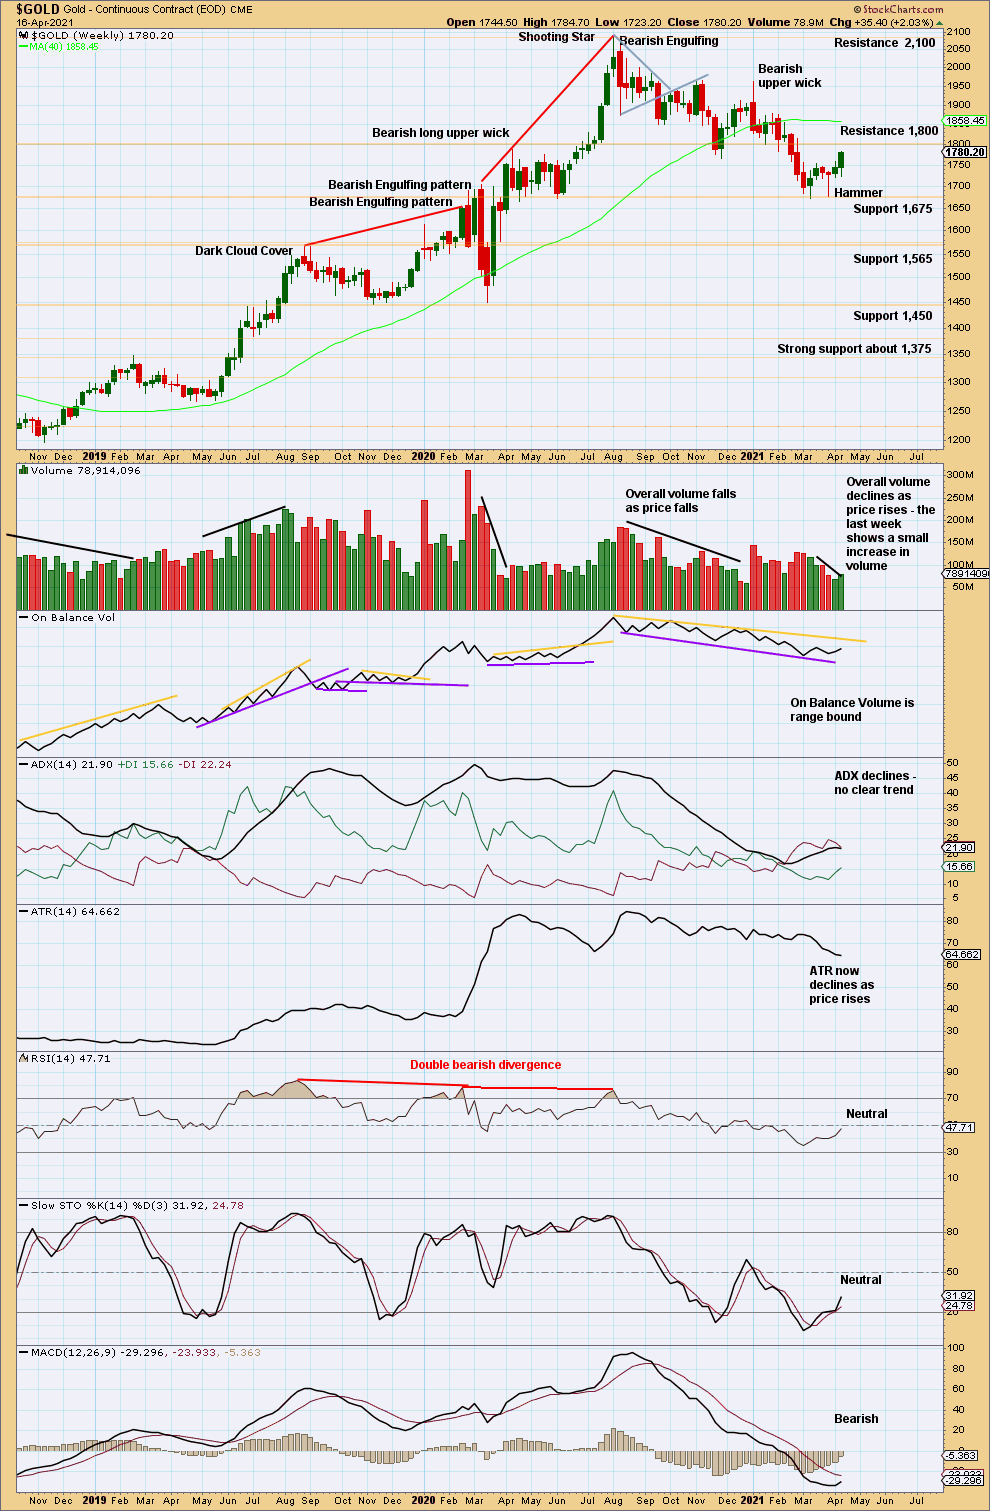
Click chart to enlarge. Chart courtesy of StockCharts.com.
There is a series of lower swing lows and lower swing highs from the last all time high in August 2020.
Neither ADX nor RSI are extreme. There is plenty of room for a downwards trend to continue. This week ADX slightly declines; no downwards trend is currently indicated.
Following a Hammer candlestick pattern is now two weeks of upwards movement. But upwards movement was weak off the low, and volume is still relatively low although it has increased for the second week. This may be another counter trend bounce.
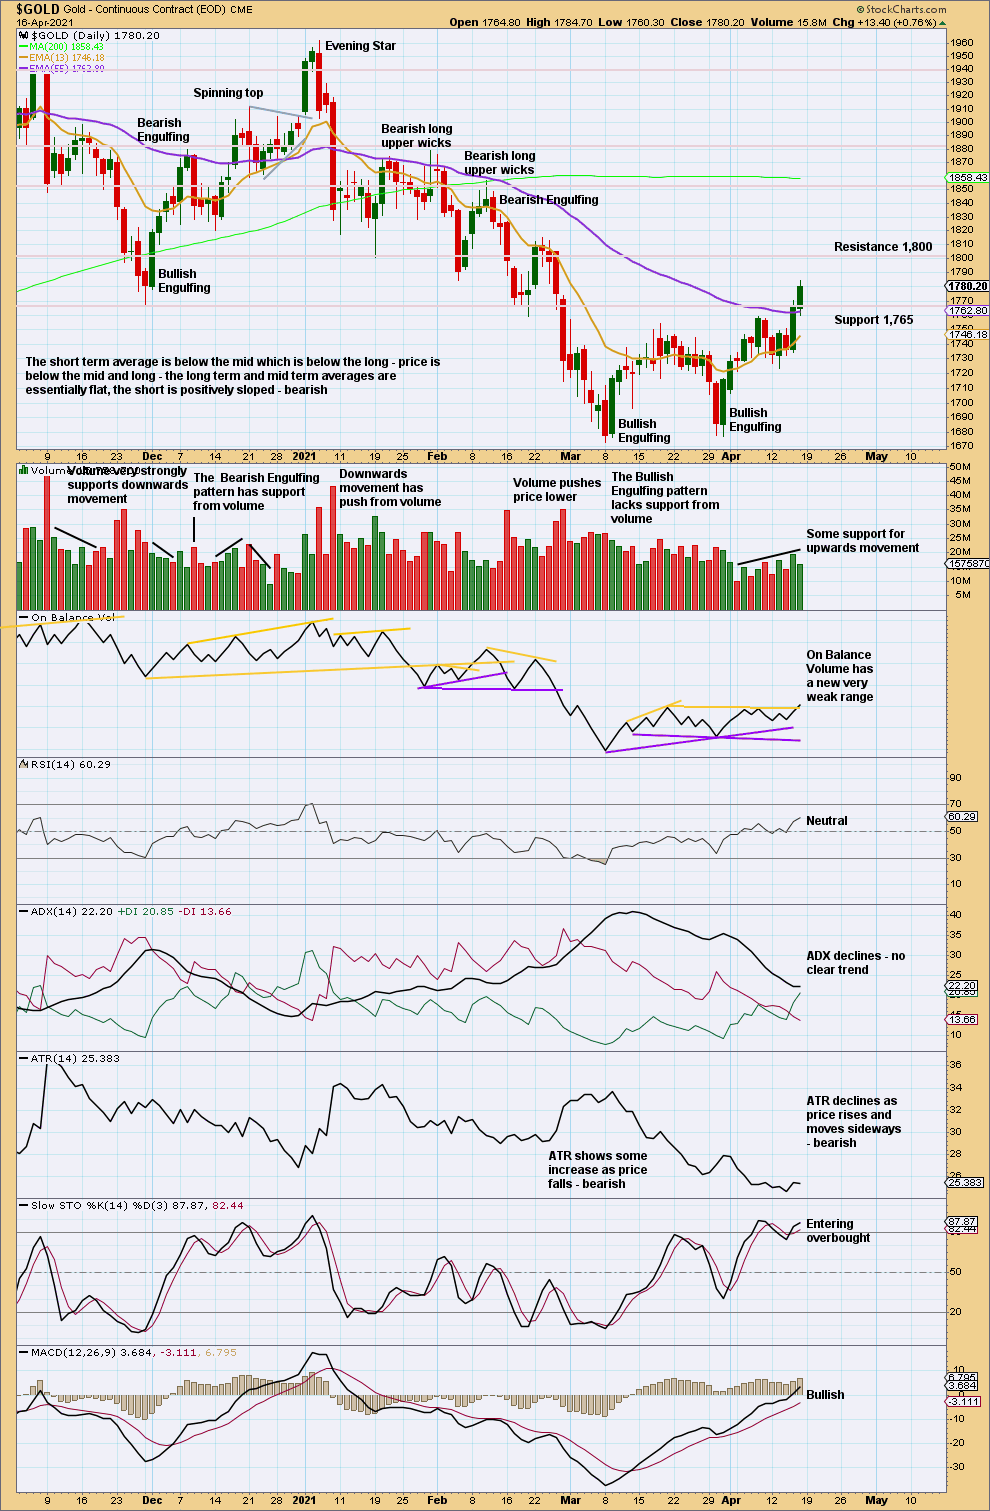
DAILY CHART
Click chart to enlarge. Chart courtesy of StockCharts.com.
ADX may reach very extreme (over 45 and above both directional lines) before a trend in this market may end. It is currently declining, indicating no clear trend. But if it again increases, then it would again indicate an extreme downwards trend.
Volume now offers some support to upwards movement, although it remains lower than at the start.
With a close near highs for Friday’s session, more upwards movement may be expected next week. Next resistance is about 1,800. This is still expected to be another counter trend bounce, most likely.
GDX WEEKLY CHART
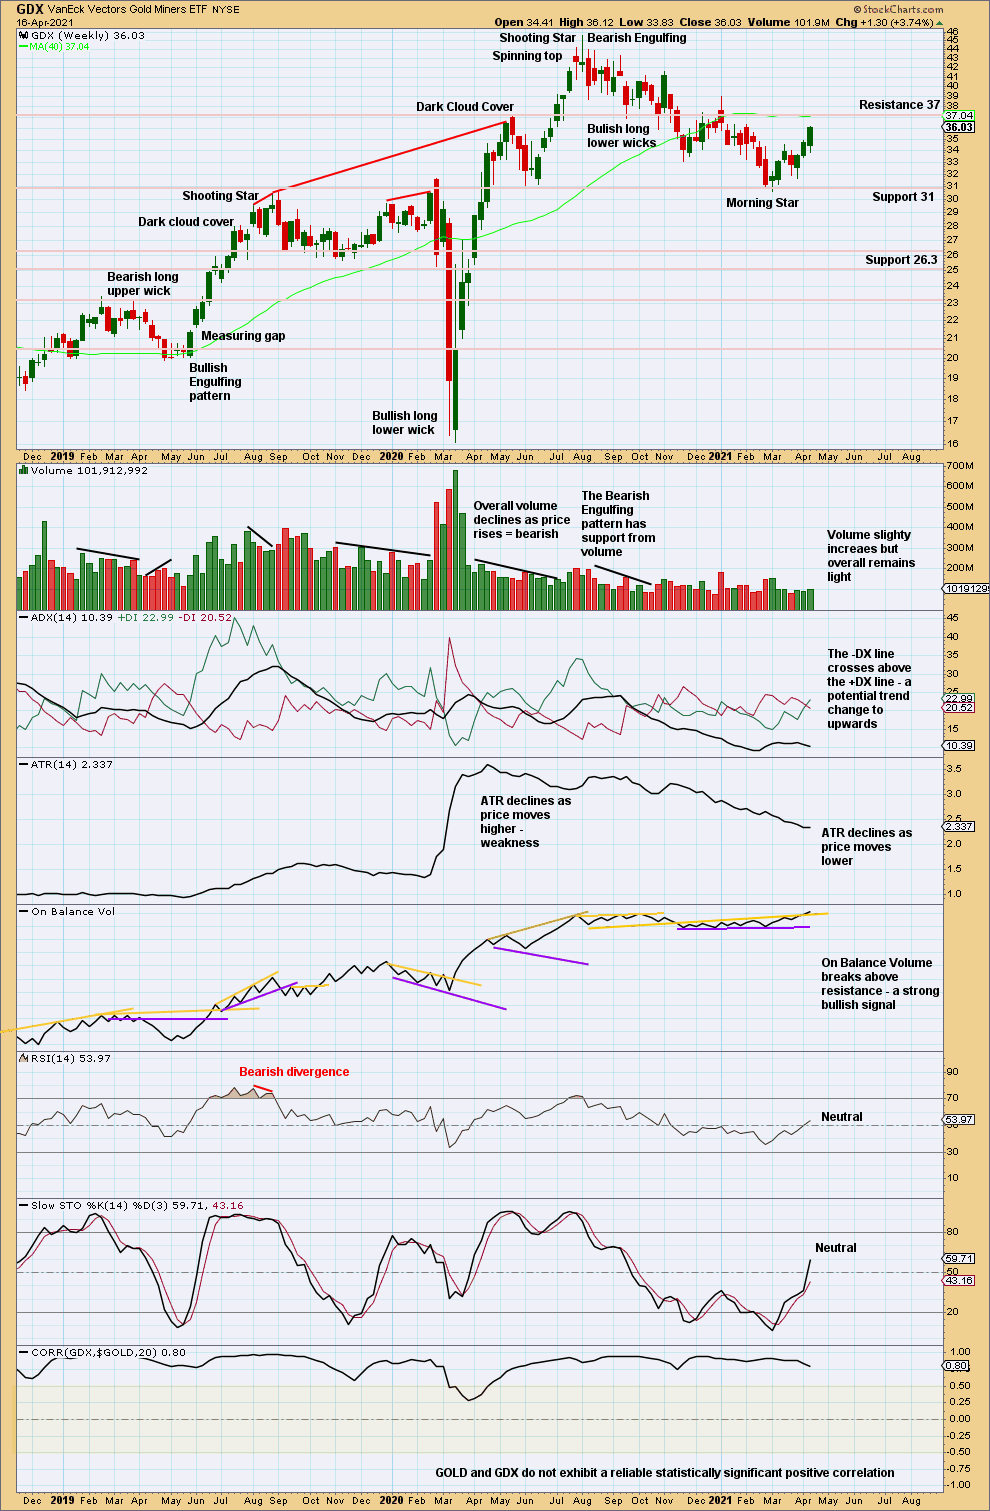
Click chart to enlarge. Chart courtesy of StockCharts.com.
For confidence in a Morning Star reversal pattern the third candlestick should have support from volume. This one does not, so confidence may not be had in this pattern.
This may be the start of a new upwards trend, but so far volume does not well support upwards movement (which is concerning for a bullish case).
Next resistance is about 37.
GDX DAILY CHART
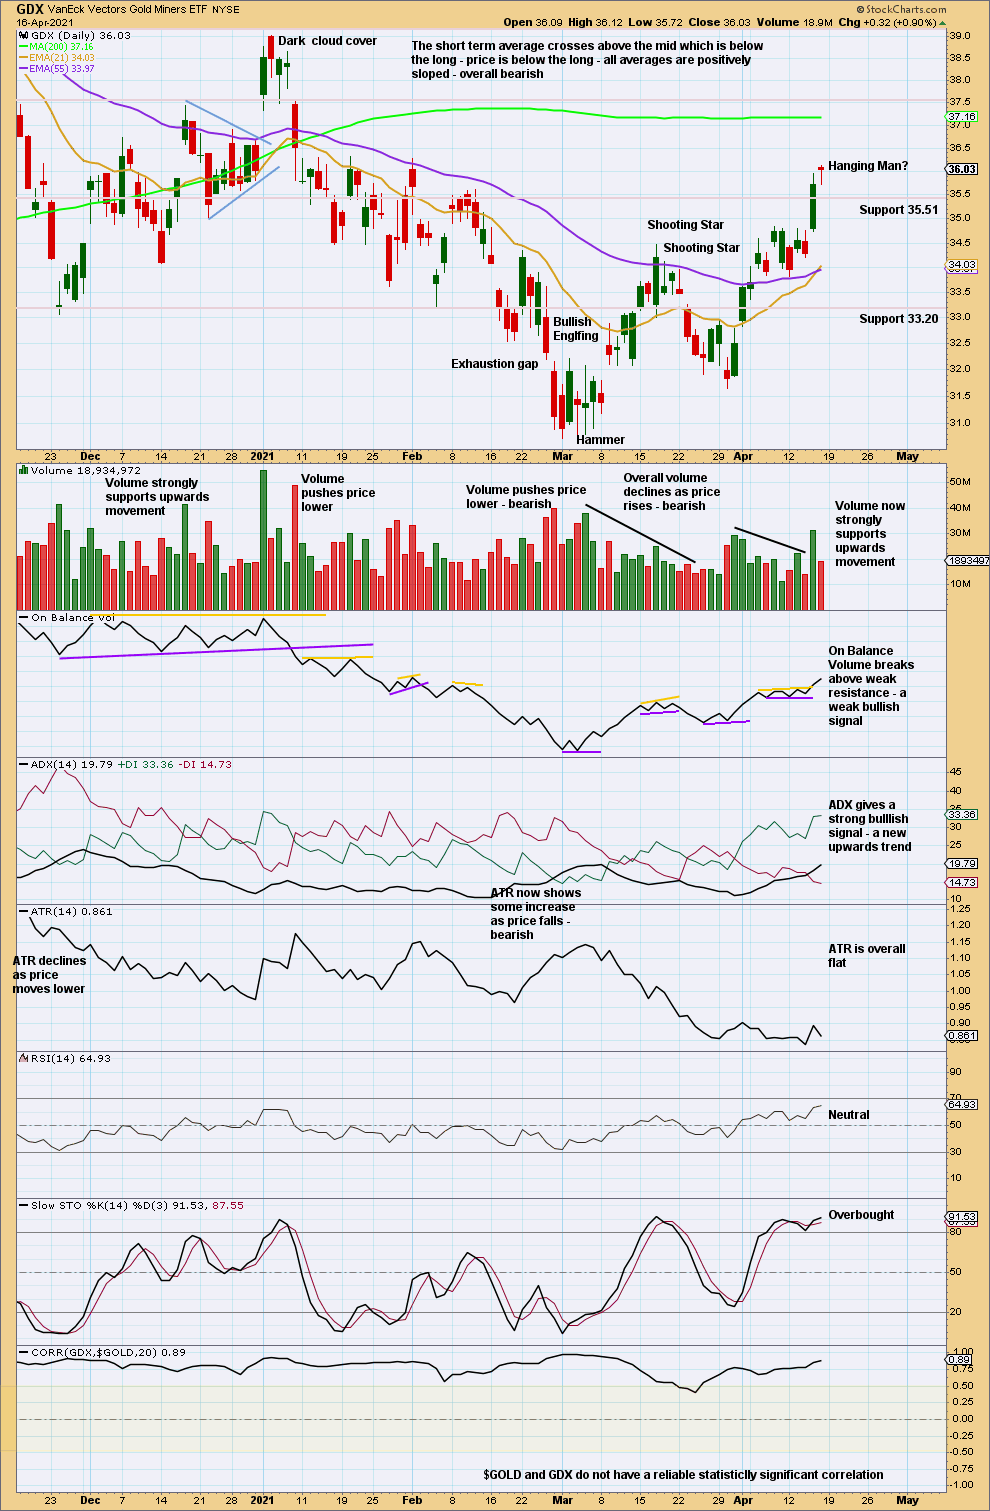
Click chart to enlarge. Chart courtesy of StockCharts.com.
ADX now indicates a new upwards trend.
GDX now looks more clearly bullish than Gold.
The bullish implication of the long lower wick on a Hanging Man candlestick pattern means it needs bearish confirmation in the following candlestick. If Monday moves price lower, then a high may be in place. Until then, expect more upwards movement.
US OIL
A little upwards movement this week sees price remain below the short-term invalidation point as a B wave continues.
The targets for a larger consolidation or pullback remain the same.
Summary: For the short term, price may continue slightly higher to 64.70 to complete a zigzag for intermediate wave (B). Thereafter, downwards movement may resume.
A pullback or consolidation may continue for a few to several weeks. A first target is at 54.86. Thereafter, the next target is at 46.76 if price keeps falling.
The larger trend remains up.
A longer-term target for a third wave is at 87.90 or 121.43.
Oil may have found a major sustainable low in April 2020.
ELLIOTT WAVE COUNT
MONTHLY CHART
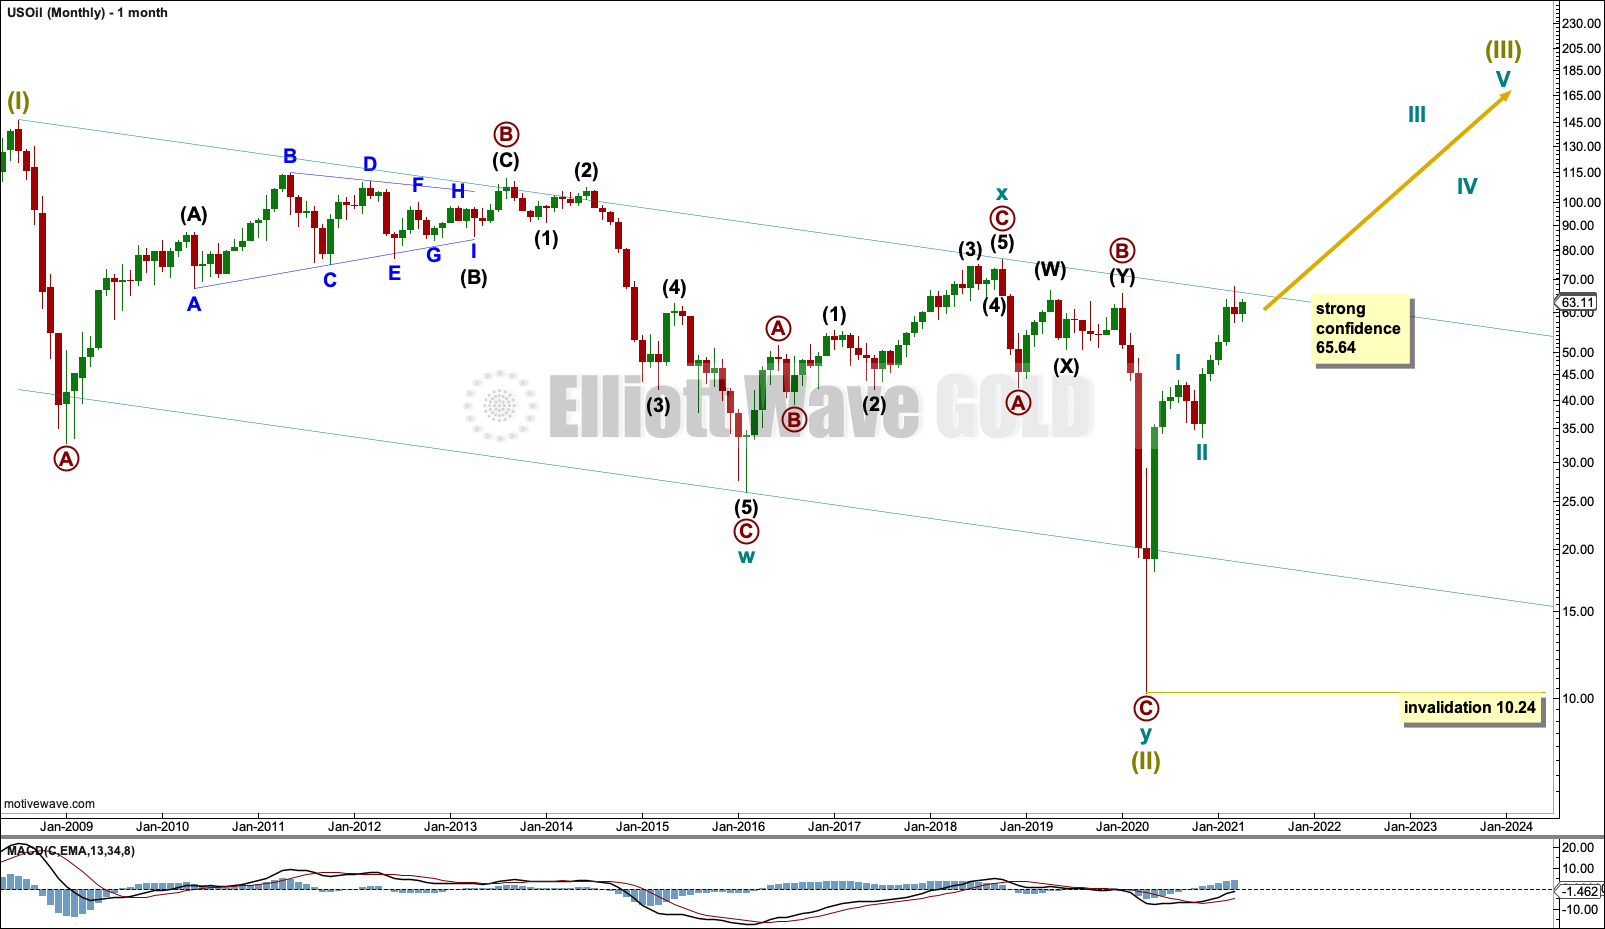
Click chart to enlarge.
The basic Elliott wave structure is five steps forward and three steps back. This Elliott wave count expects that US Oil has completed a three steps back pattern, which began in July 2008. The Elliott wave count expects that the bear market for US Oil may now be over.
Following Super Cycle wave (II), which was a correction (three steps back), Super Cycle wave (III), which may have begun, should be five steps up when complete. Super Cycle wave (III) may last a generation and must make a new high above the end of Super Cycle wave (I) at 146.73.
A channel is drawn about Super Cycle wave (II): draw the first trend line from the start of cycle wave w to the end of cycle wave x, then place a parallel copy on the end of cycle wave w. This trend line is breached to the downside, which is a typical look for the end of a movement for a commodity.
The upper edge of the channel may provide resistance. Price is reacting down from the upper edge of this channel.
Super Cycle wave (III) may only subdivide as a five wave impulse. New trends for Oil usually start out very slowly with short first waves and deep time consuming second wave corrections. However, while this is a common tendency, it is not always seen and may not have been seen in this instance. The first reasonably sized pullback may be over already.
WEEKLY CHART
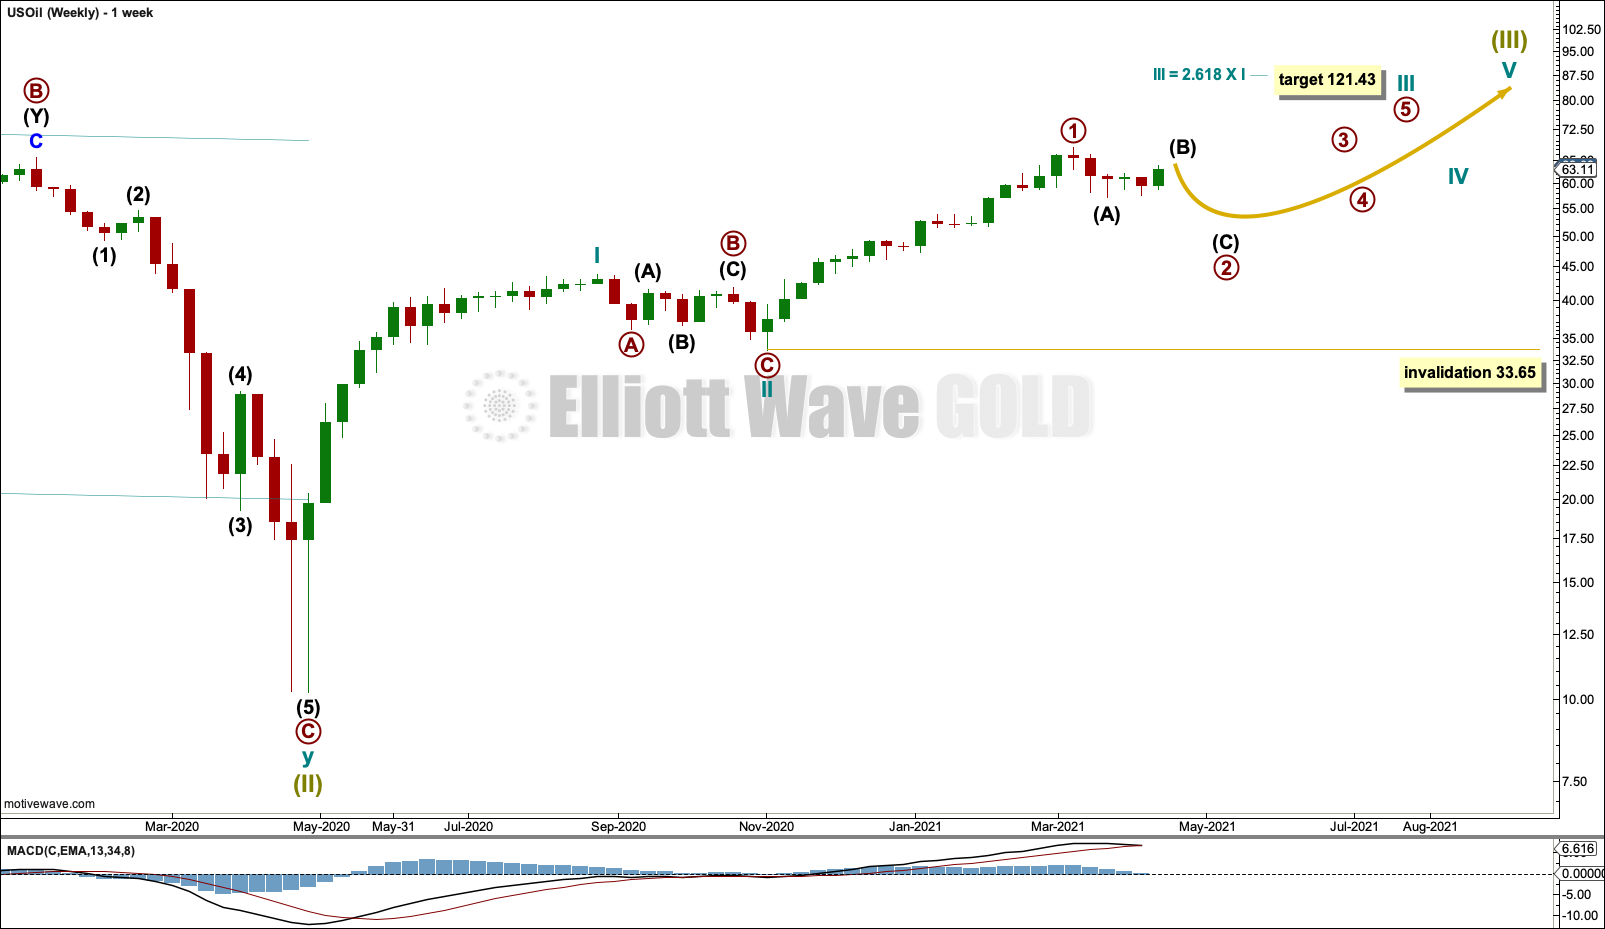
Click chart to enlarge.
Super Cycle wave (III) must subdivide as an impulse. Cycle wave I within the impulse may be complete. Cycle wave II may also now be complete, and cycle wave III upwards may now have begun. Primary wave 2 within cycle wave III may not move beyond the start of primary wave 1 below 33.65.
There is only one daily chart following this main weekly chart. An alternate is presented below on a weekly chart.
DAILY CHART
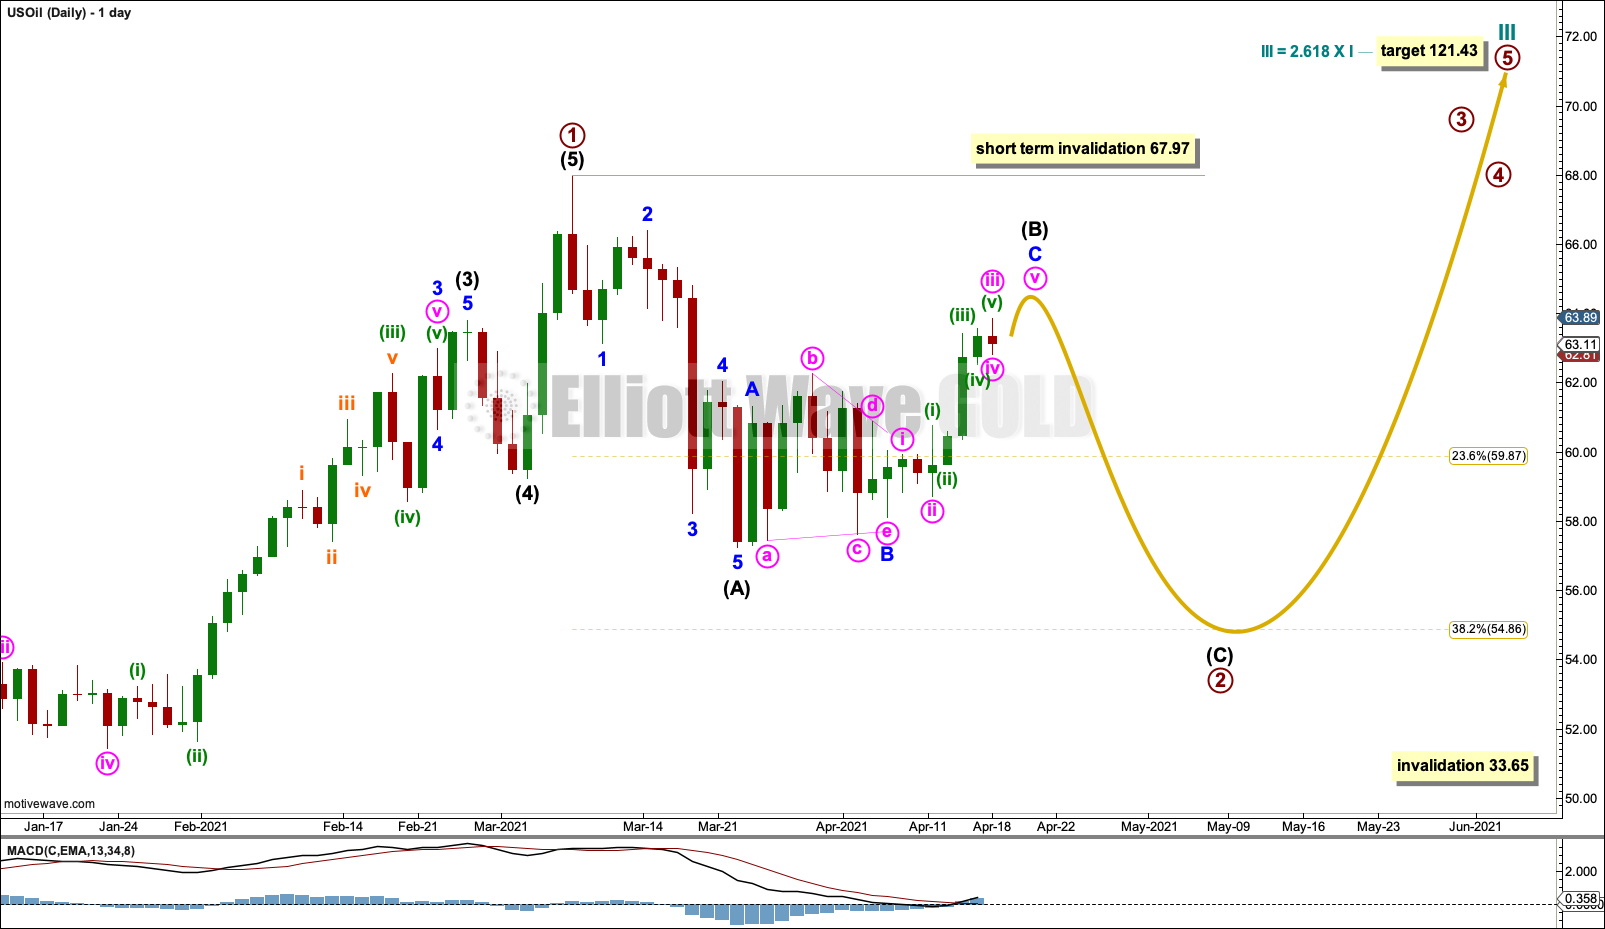
Click chart to enlarge.
Primary wave 2 would most likely subdivide as a zigzag. Intermediate wave (A) within the zigzag may be a complete impulse. Intermediate wave (B) may continue sideways and higher. If intermediate wave (A) is correctly labelled as a five wave impulse, then intermediate wave (B) may not move beyond its start above 67.97.
Intermediate wave (B) may be subdividing as a zigzag with a triangle within it for minor wave B. Minor wave C may now complete as a five wave motive structure. A target for it to end would be at 64.70 where minor wave C would reach 1.618 the length of minor wave A.
When intermediate wave (B) may be complete, then intermediate wave (C) downwards may begin. Intermediate wave (C) would be extremely likely to move at least slightly below the end of intermediate wave (A) at 57.26 to avoid a truncation.
Primary wave 2 may last weeks to months.
As price approaches the first target at the 0.382 Fibonacci ratio at 54.86 and if then the structure is complete and technical analysis indicates a low may be in place, then it may end there. But if price keeps falling and / or the structure of primary wave 2 is incomplete, then the 0.618 Fibonacci ratio at 46.76 would be the next target.
Labelling within primary wave 2 may change as it unfolds and alternate wave counts for the short-term structure may need to be considered. There are several different structures that primary wave 2 may unfold as.
Primary wave 2 may not move beyond the start of primary wave 1 below 33.65.
ALTERNATE WEEKLY CHART
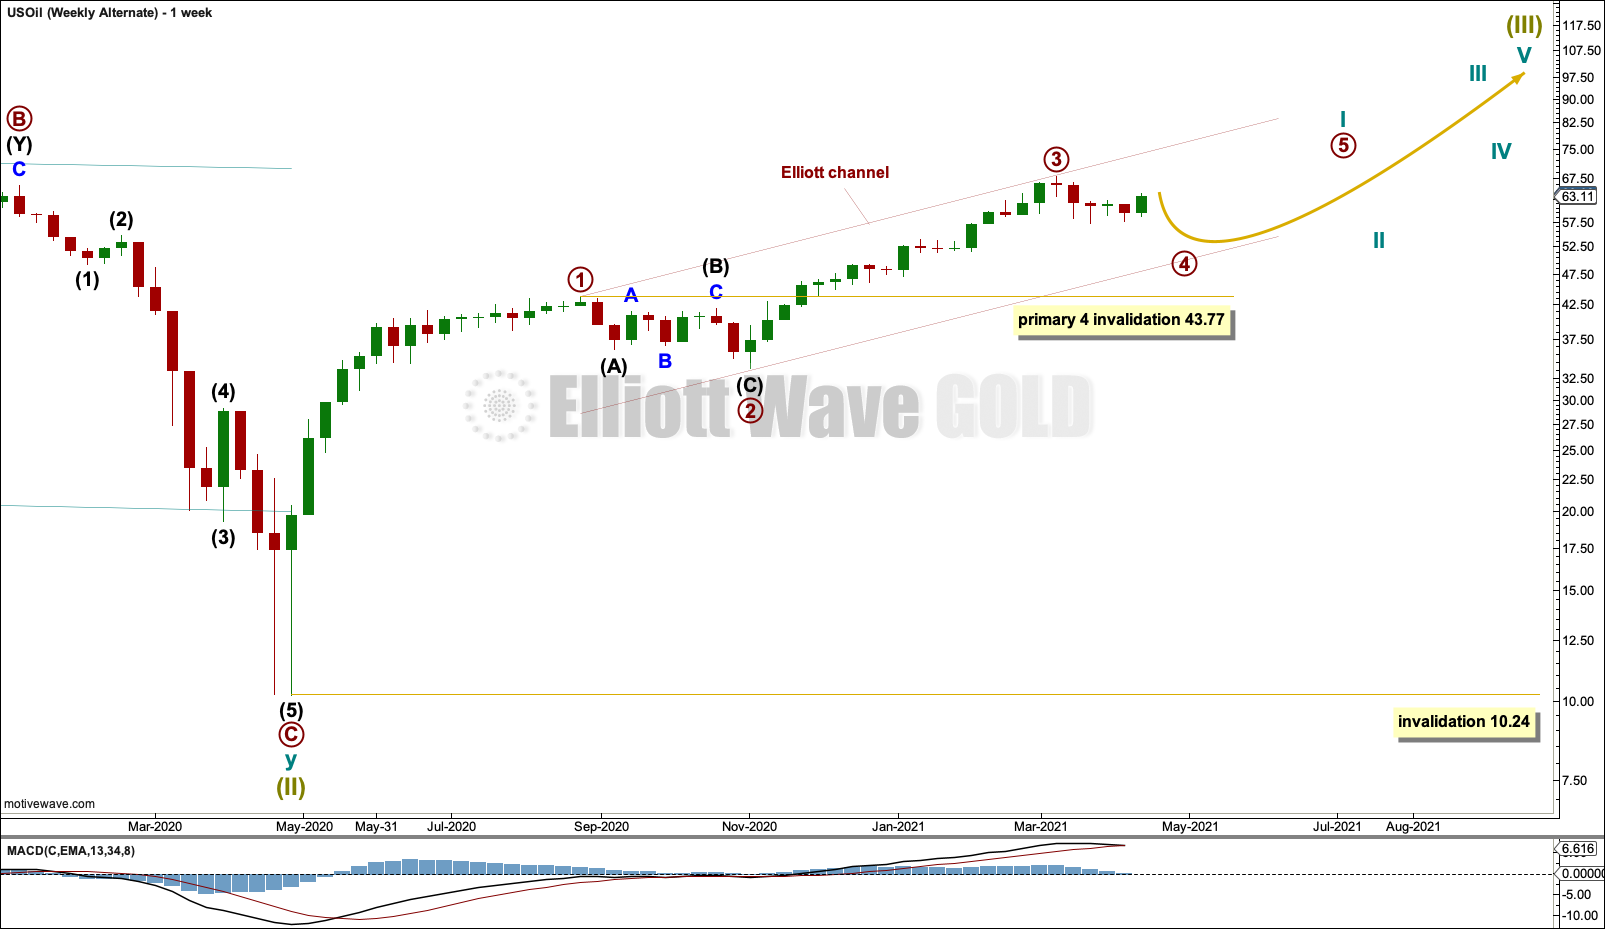
Click chart to enlarge.
This alternate wave count moves the degree of labelling within the start of the bull market down one degree. It is possible that cycle wave I is incomplete.
Primary wave 3 may have ended at the last high. Primary wave 3 is close to equal in length with primary wave 1; it is 0.79 longer than primary wave 1.
Primary wave 4 may subdivide as any corrective structure. Primary wave 4 should last weeks to months. Primary wave 4 may not move into primary wave 1 price territory below 43.77.
A daily chart for this alternate would be the same as the daily chart for the main wave count, except the pullback would be labelled primary wave 4.
TECHNICAL ANALYSIS
WEEKLY CHART
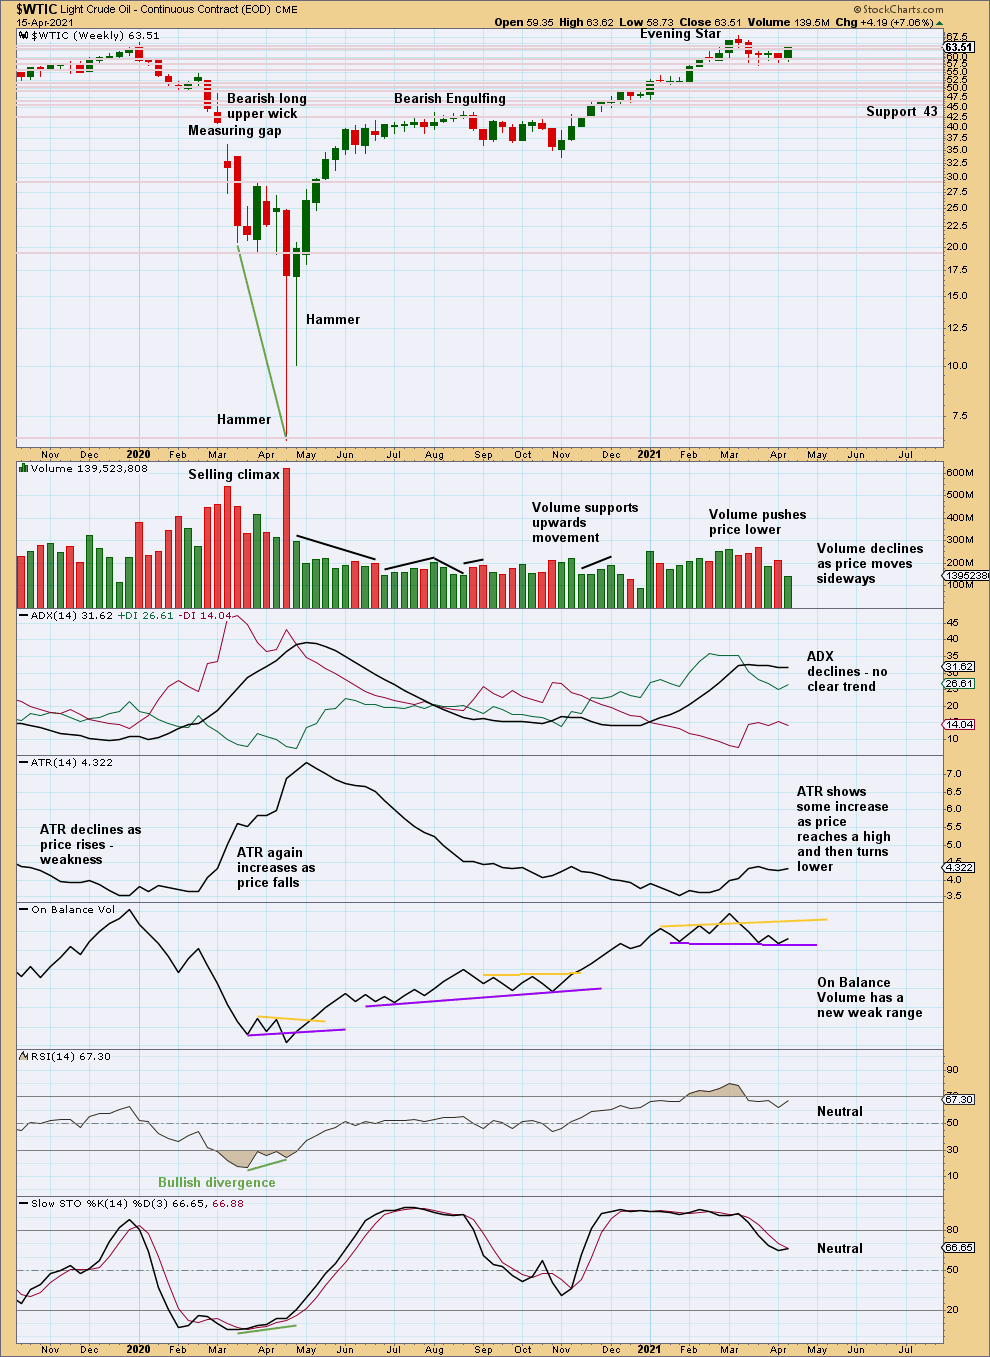
Click chart to enlarge. Chart courtesy of StockCharts.com.
A bearish candlestick pattern on the weekly chart supports the Elliott wave counts.
ADX at the high reached extreme. RSI reached extreme at the last high. Given extreme conditions a bearish candlestick pattern should be given weight. A multi-week to multi-month pullback is a reasonable expectation here.
The short-term volume profile remains bearish; this week upwards movement has lighter volume.
DAILY CHART

Click chart to enlarge. Chart courtesy of StockCharts.com.
The prior extreme upwards trend may have now ended. A multi-week to multi-month pullback or consolidation may have begun. It may continue until RSI reaches extreme oversold.
The flag pattern failed. Upwards movement lacks support from range and volume (this supports the Elliott wave count that sees upwards movement as a B wave).
—
Always practice good risk management as the most important aspect of trading. Always trade with stops and invest only 1-5% of equity on any one trade. Failure to manage risk is the most common mistake new traders make.