
GOLD: Elliott Wave and Technical Analysis | Charts – May 19, 2021
A sharp pullback on the hourly chart indicates a fourth wave correction may have arrived prior to the target.
Both Elliott wave counts expect essentially the same movement next.
Summary: The main wave count is bullish. For the short term, a pullback may end about 1,807.95. The longer-term target is at 2,094.
An alternate Elliott wave count is considered, but it has a low probability. It expects upwards movement to continue here to at least 1,920.42 and likely well above this point. The invalidation point for this alternate wave count is at 2,070.48.
Grand SuperCycle analysis and last monthly charts are here.
MAIN ELLIOTT WAVE COUNT
WEEKLY CHART
Click chart to enlarge.
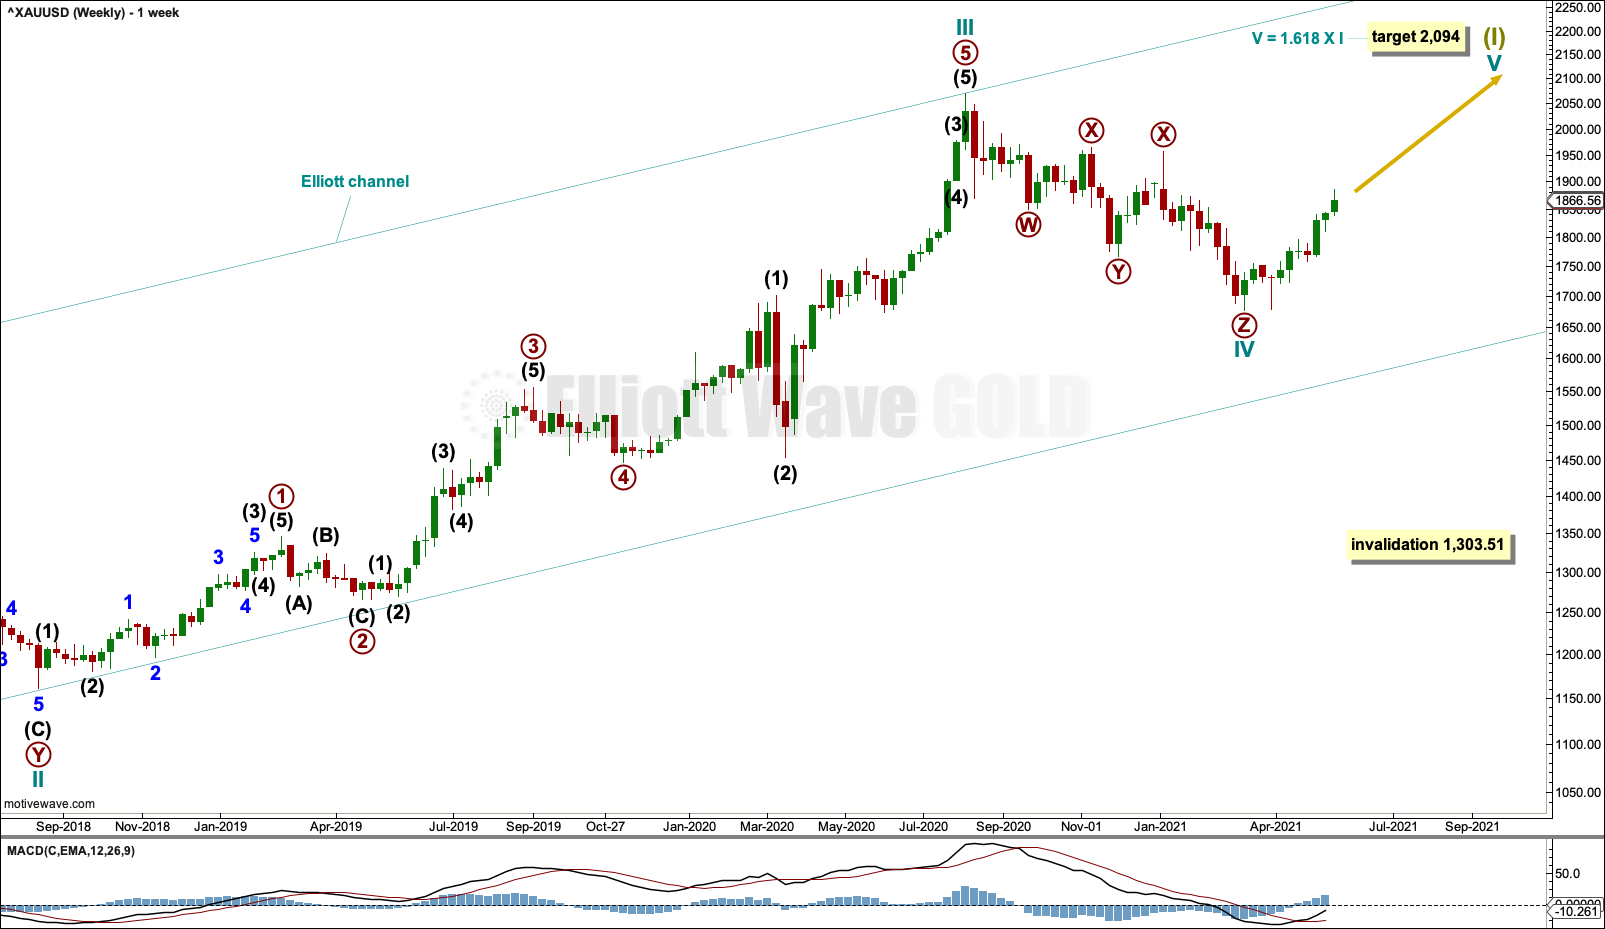
This wave count sees the the bear market complete at the last major low for Gold on 3 December 2015.
If Gold is in a new bull market, then it should begin with a five wave structure upwards on the weekly chart.
Cycle wave I fits as a five wave impulse with reasonably proportionate corrections for primary waves 2 and 4.
Cycle wave II fits as a double flat. However, within the first flat correction labelled primary wave W, this wave count needs to ignore what looks like an obvious triangle from July to September 2016 (this can be seen labelled as a triangle on the second weekly chart on prior analysis here). This movement must be labelled as a series of overlapping first and second waves. Ignoring this triangle reduces the probability of this wave count in Elliott wave terms.
Cycle wave IV may be a complete triple zigzag.
If the third zigzag of primary wave Z continues lower, then cycle wave IV may not move into cycle wave I price territory below 1,303.51.
DAILY CHART
Click chart to enlarge.
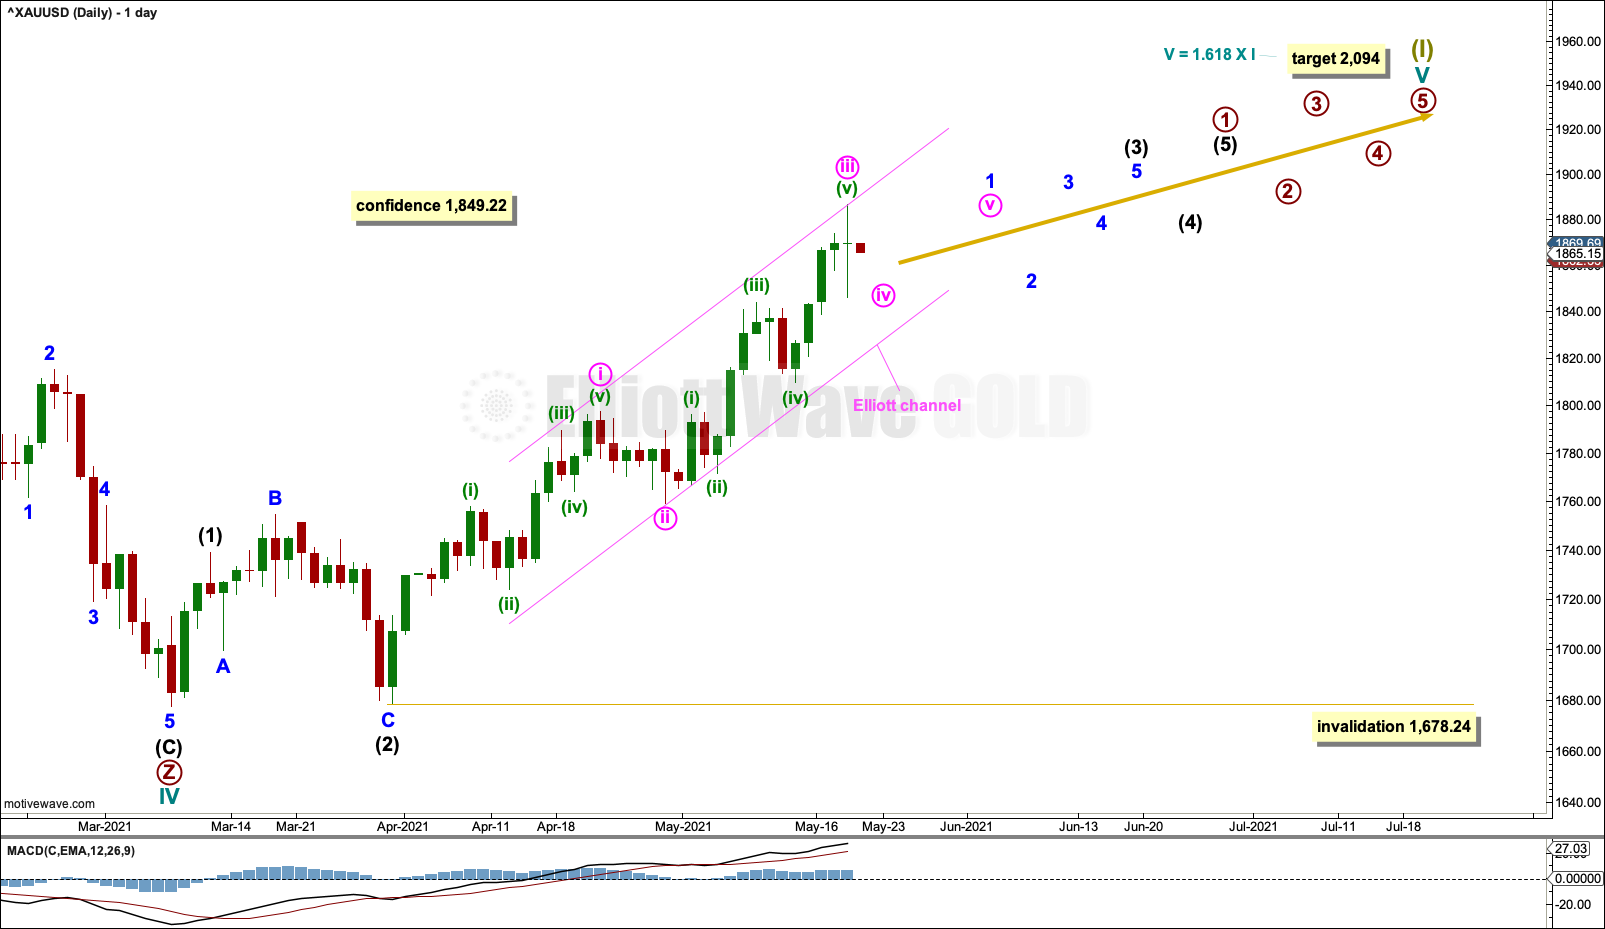
Cycle wave IV may be a complete triple zigzag.
A target is calculated for cycle wave V.
Primary wave 1 within cycle wave V may be incomplete.
Within primary wave 1: Intermediate waves (1) and (2) may be complete, and within intermediate wave (3) minor wave 2 may not move beyond the start of minor wave 1 below 1,678.24.
Minor wave 1 may be an incomplete impulse.
HOURLY CHART
Click chart to enlarge.
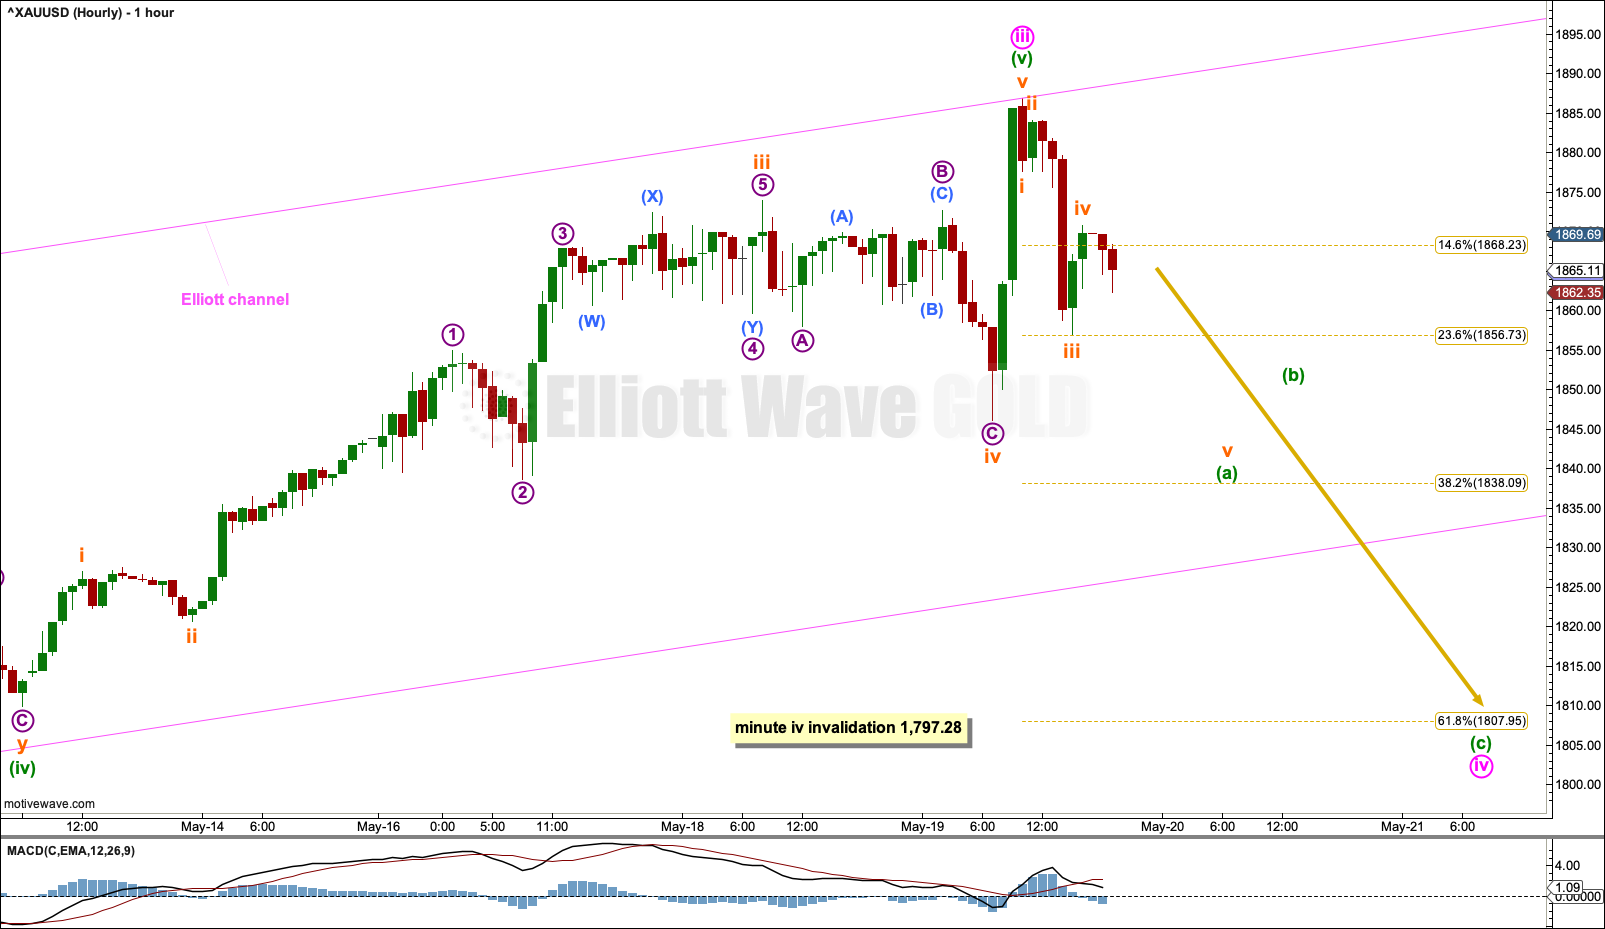
Minor wave 1 may be incomplete.
Minor wave 1 may be unfolding as an impulse.
Minute wave iii within minor wave 1 may have ended at today’s high.
Minute wave iv may now continue lower. Minute wave ii was a shallow 0.32 double zigzag that lasted five sessions. Minute wave iv may be a single zigzag, which would exhibit alternation, or it may subdivide as a flat, combination or triangle. If minute wave iv exhibits alternation in depth, then the preferred target would be the 0.618 Fibonacci ratio of minute wave iii at 1,807.95. If it reaches this target, then it may not be contained within the pink Elliott channel.
Minute wave iv may be more brief if it unfolds as a single zigzag, which may last about three sessions. If minute wave iv unfolds as a flat, triangle or combination, then it may be longer lasting; it may last five to about seven sessions.
Minute wave iv may not move into minute wave i price territory below 1,797.28.
ALTERNATE ELLIOTT WAVE COUNT
WEEKLY CHART
Click chart to enlarge.
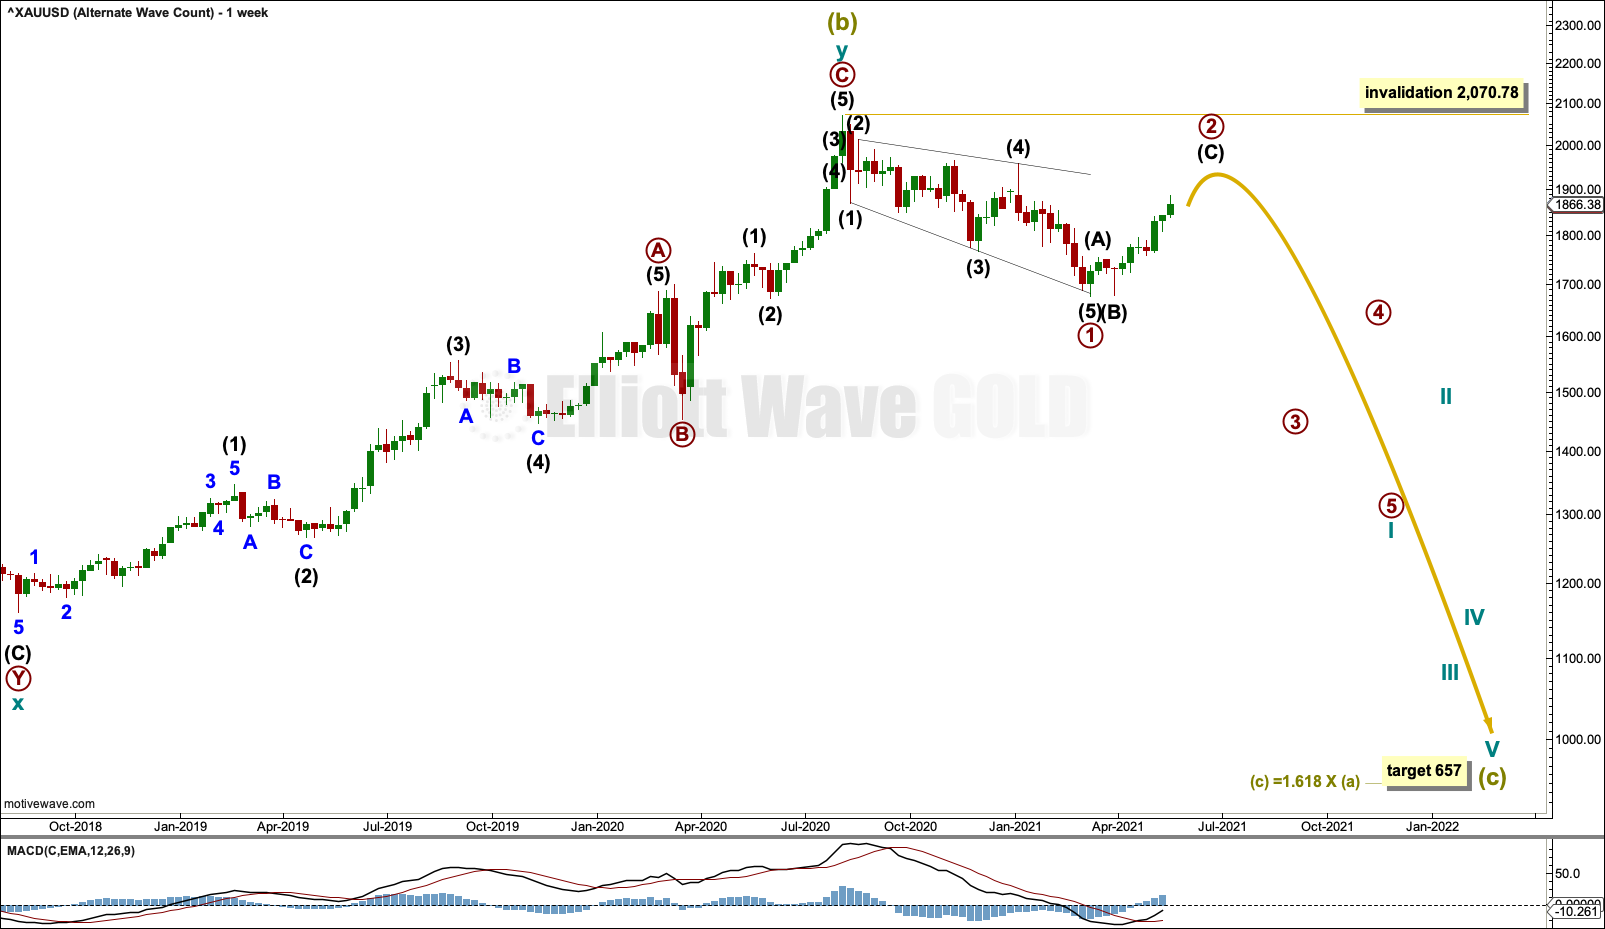
The bigger picture for this alternate Elliott wave count sees Gold as still within a bear market, in a three steps back pattern that is labelled Grand Super Cycle wave IV on monthly charts. Grand Super Cycle wave IV may be subdividing as an expanded flat pattern.
Super Cycle wave (b) within Grand Super Cycle wave IV may be a complete double zigzag. This wave count expects Super Cycle wave (c) to move price below the end of Super Cycle wave (a) at 1,046.27 to avoid a truncation and a very rare running flat. The target calculated expects a common Fibonacci ratio for Super Cycle wave (c).
Super Cycle wave (c) may have begun with a leading expanding diagonal for primary wave 1. Leading expanding diagonals in first wave positions are uncommon, so the probability of this wave count is low. However, it has a good fit and must be considered.
Second wave corrections to follow leading diagonals in first wave positions are usually very deep. Primary wave 2 may be expected to end at least about the 0.618 Fibonacci ratio at 1,920.42, and more likely a reasonable amount deeper than that. Primary wave 2 may not move beyond the start of primary wave 1 above 2,070.78.
DAILY CHART
Click chart to enlarge.
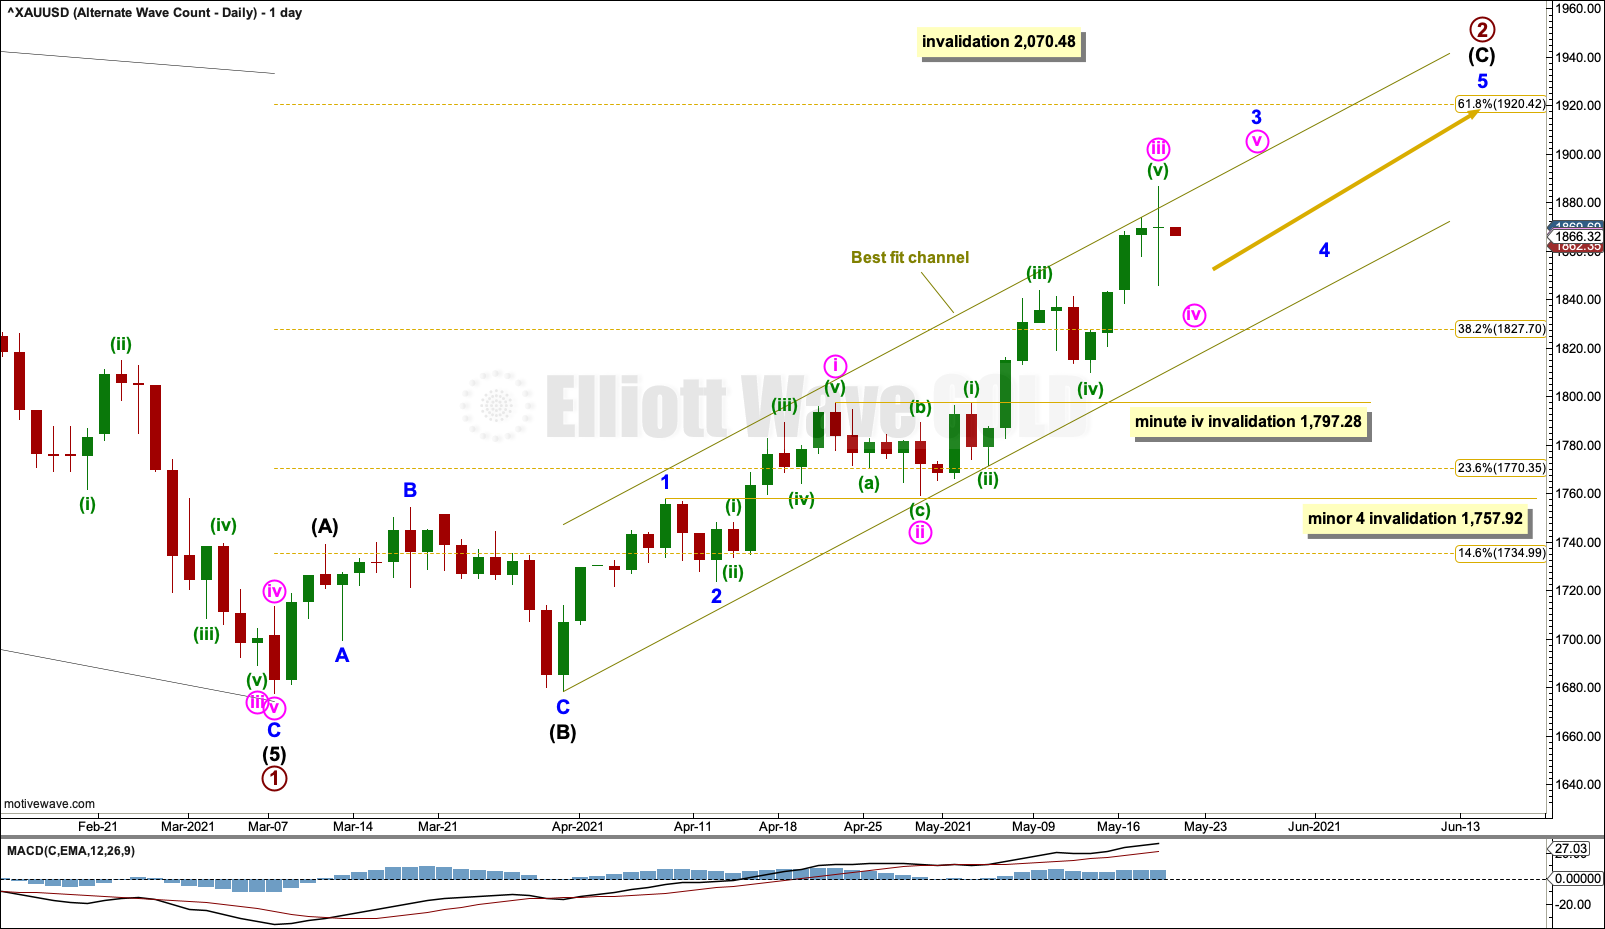
Intermediate wave (C) may be subdividing as an impulse. Minor wave 4 within intermediate wave (C) may not move into minor wave 1 price territory below 1,756.92.
TECHNICAL ANALYSIS
WEEKLY CHART
Click chart to enlarge. Chart courtesy of StockCharts.com.
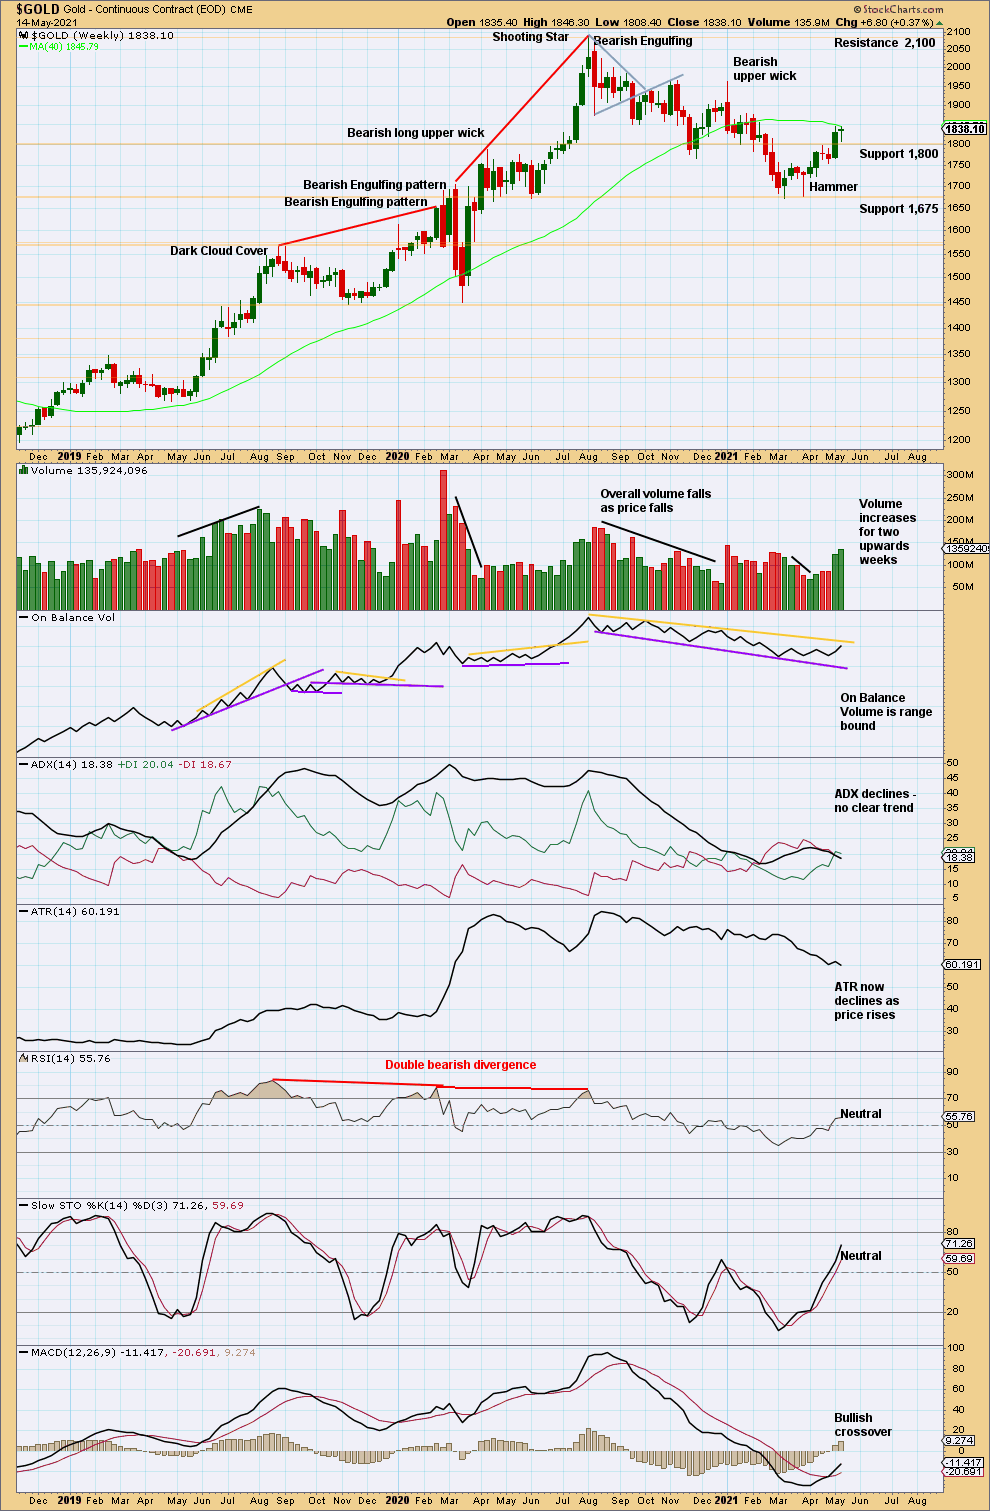
Price has closed above prior resistance at 1,800 with strong support from volume. The +DX line has crossed above the -DX line, indicating a potential trend change to upwards, but with ADX declining no clear trend is indicated.
Volume last week shows a further increase, which supports the main Elliott wave count.
DAILY CHART
Click chart to enlarge. Chart courtesy of StockCharts.com.
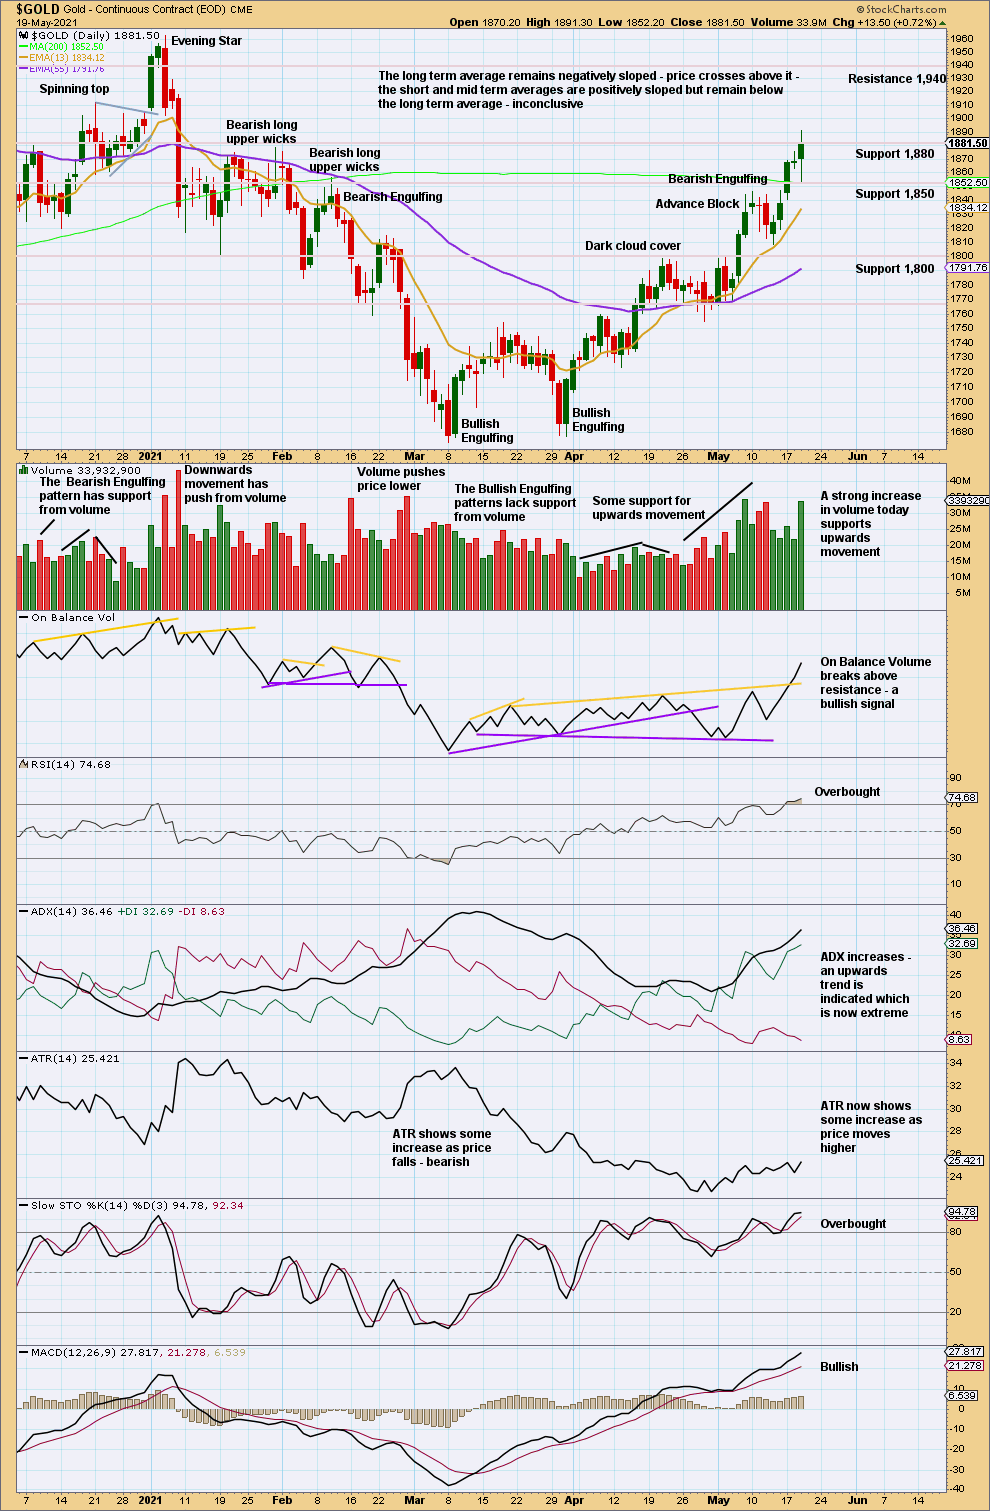
Price has consolidated just below resistance and now closed above resistance at 1,850, which may now offer support. The upwards trend continues. Next resistance about 1,880 may have forced a downwards reaction here; the long upper wick is slightly bearish today. After a strong upwards day with a volume spike, some downwards reaction may be expected before price then continues on higher.
The trend is now extreme and RSI is oversold. However, when Gold has a strong trend, these indicators may reach very extreme while price travels a considerable distance.
GDX WEEKLY CHART

Click chart to enlarge. Chart courtesy of StockCharts.com.
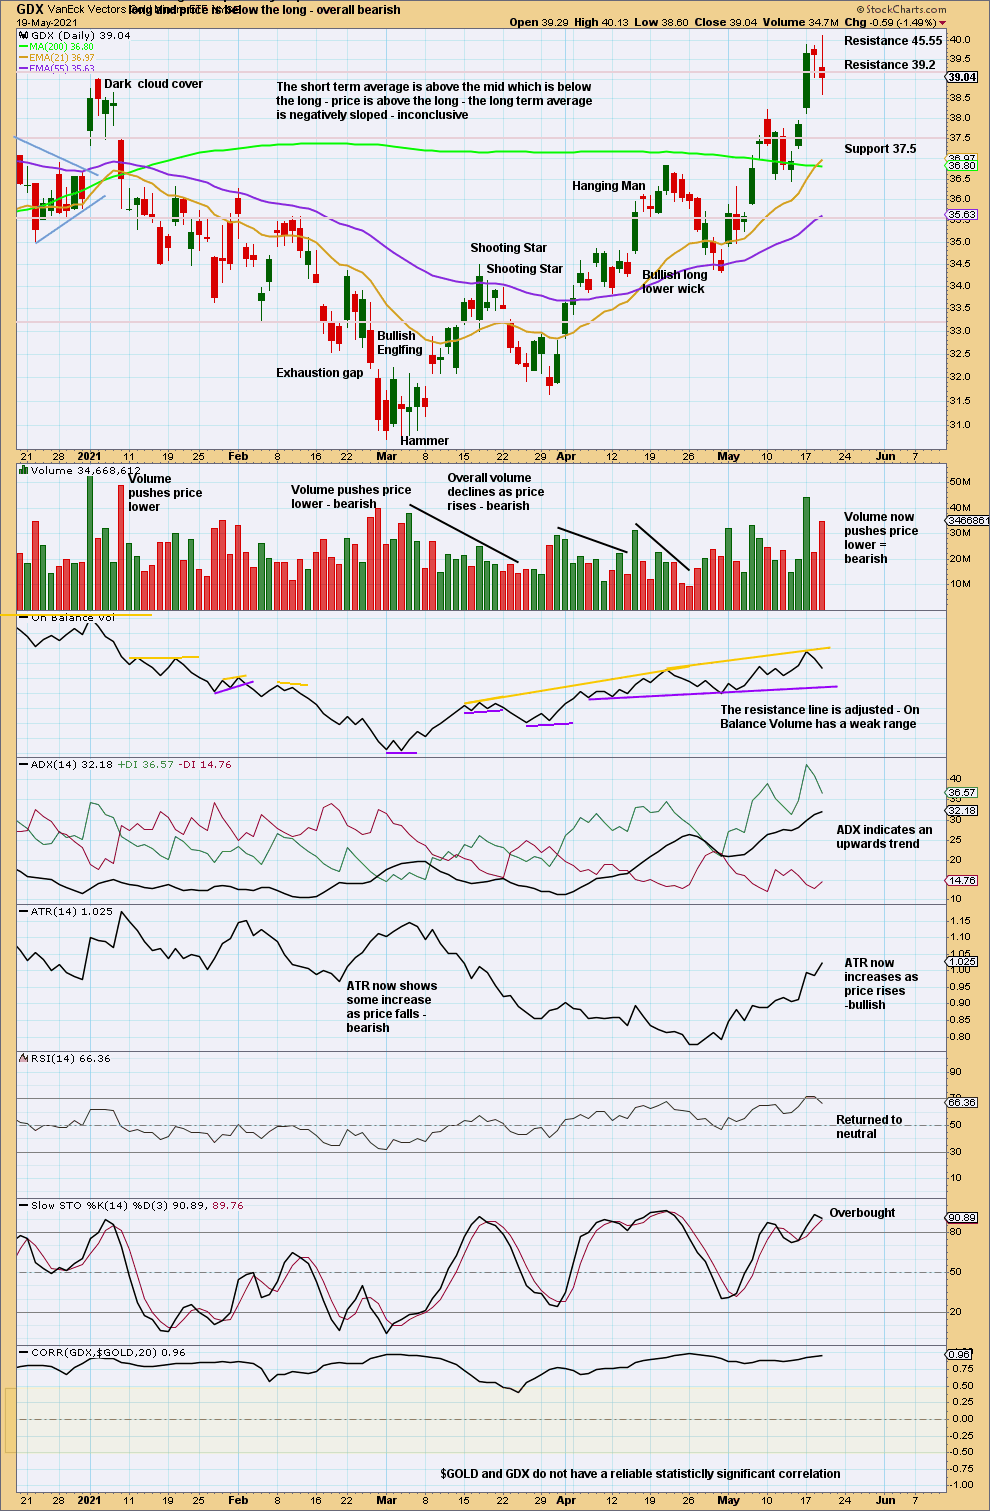
Next resistance is at 45.55.
Last week may have completed a Hanging Man bearish candlestick pattern, but the bullish implications of the long lower wick mean it requires confirmation with the following candlestick bearish.
GDX DAILY CHART
Click chart to enlarge. Chart courtesy of StockCharts.com.
The trend is up. Next strong resistance is about 45.55.
A pullback or consolidation looks likely to have begun here. Look for the last gap to provide support at 37.95.
Published @ 08:49 p.m. ET.
—
Careful risk management protects your trading account(s).
Follow my two Golden Rules:
1. Always trade with stops.
2. Risk only 1-5% of equity on any one trade.
—
New updates to this analysis are in bold.