
GOLD: Elliott Wave and Technical Analysis | Charts – June 3, 2021
Price today has found support at the lower edge of the channel on the alternate daily Elliott wave chart.
Summary: The main wave count is bullish. The longer-term target is at 2,094 although this may need to be revised higher.
For the short term, another fourth wave correction may have begun. The main Elliott wave count expects more downwards movement to a target zone at 1,854 to 1,845.
An alternate Elliott wave count is considered. It expects the fourth wave correction may have ended at support today. The next target zone for upwards movement is at 1,940 to 1,947.
Grand SuperCycle analysis and last monthly charts are here.
MAIN ELLIOTT WAVE COUNT
WEEKLY CHART
Click chart to enlarge.
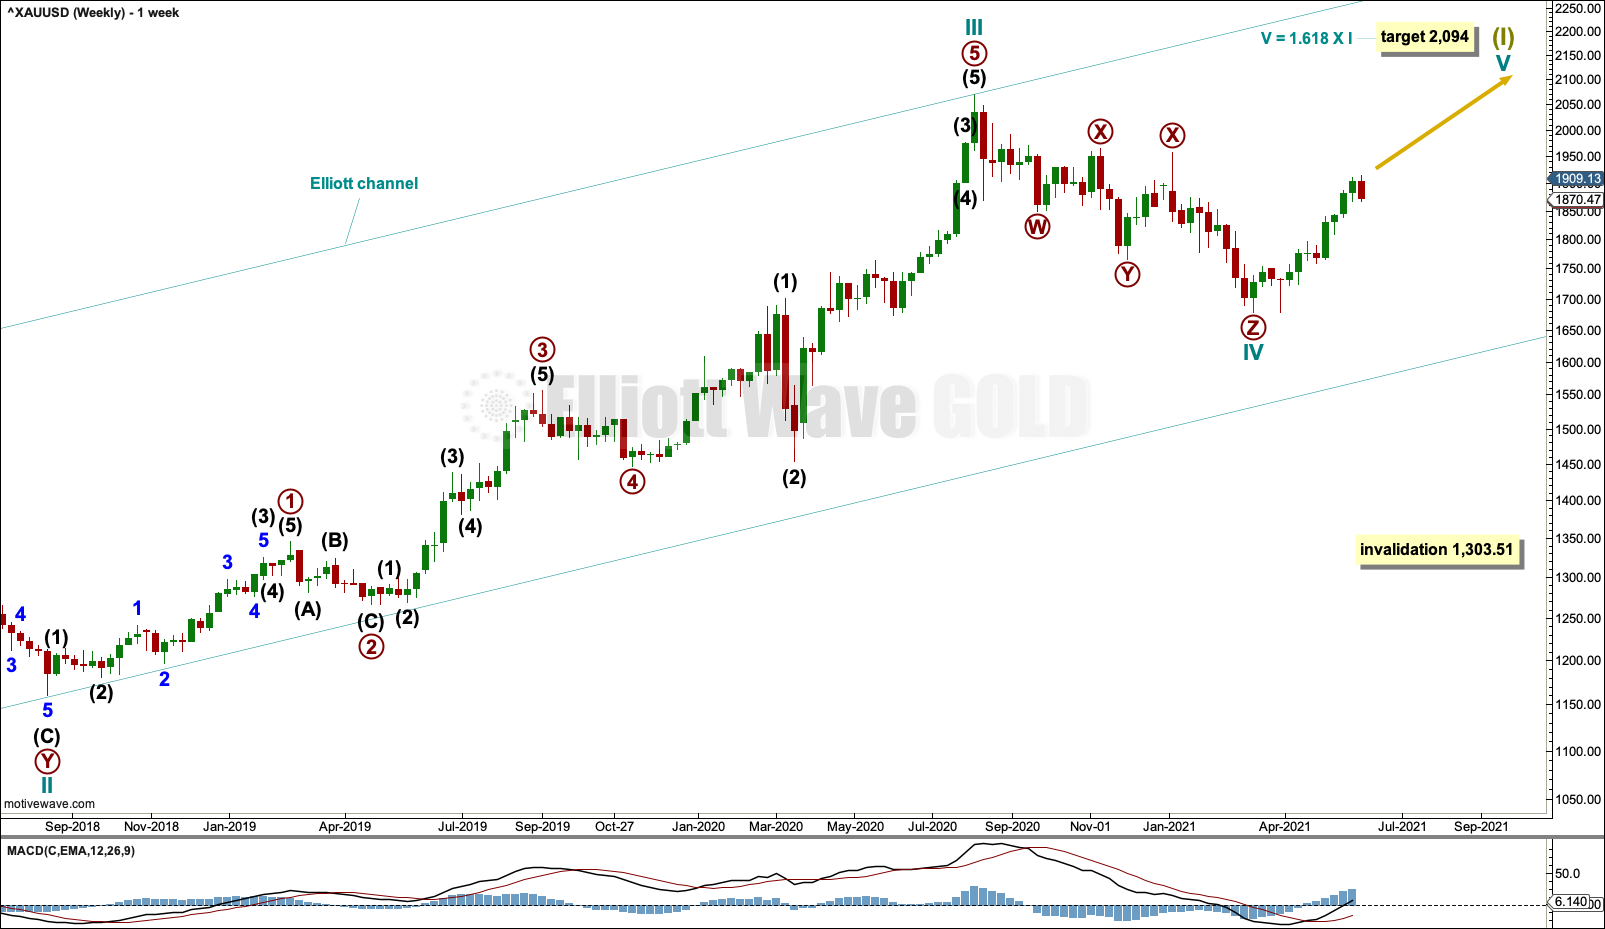
This wave count sees the the bear market complete at the last major low for Gold on 3 December 2015.
If Gold is in a new bull market, then it should begin with a five wave structure upwards on the weekly chart.
Cycle wave I fits as a five wave impulse with reasonably proportionate corrections for primary waves 2 and 4.
Cycle wave II fits as a double flat. However, within the first flat correction labelled primary wave W, this wave count needs to ignore what looks like an obvious triangle from July to September 2016 (this can be seen labelled as a triangle on the second weekly chart on prior analysis here). This movement must be labelled as a series of overlapping first and second waves. Ignoring this triangle reduces the probability of this wave count in Elliott wave terms.
Cycle wave IV may be a complete triple zigzag.
If the third zigzag of primary wave Z continues lower, then cycle wave IV may not move into cycle wave I price territory below 1,303.51.
DAILY CHART
Click chart to enlarge.
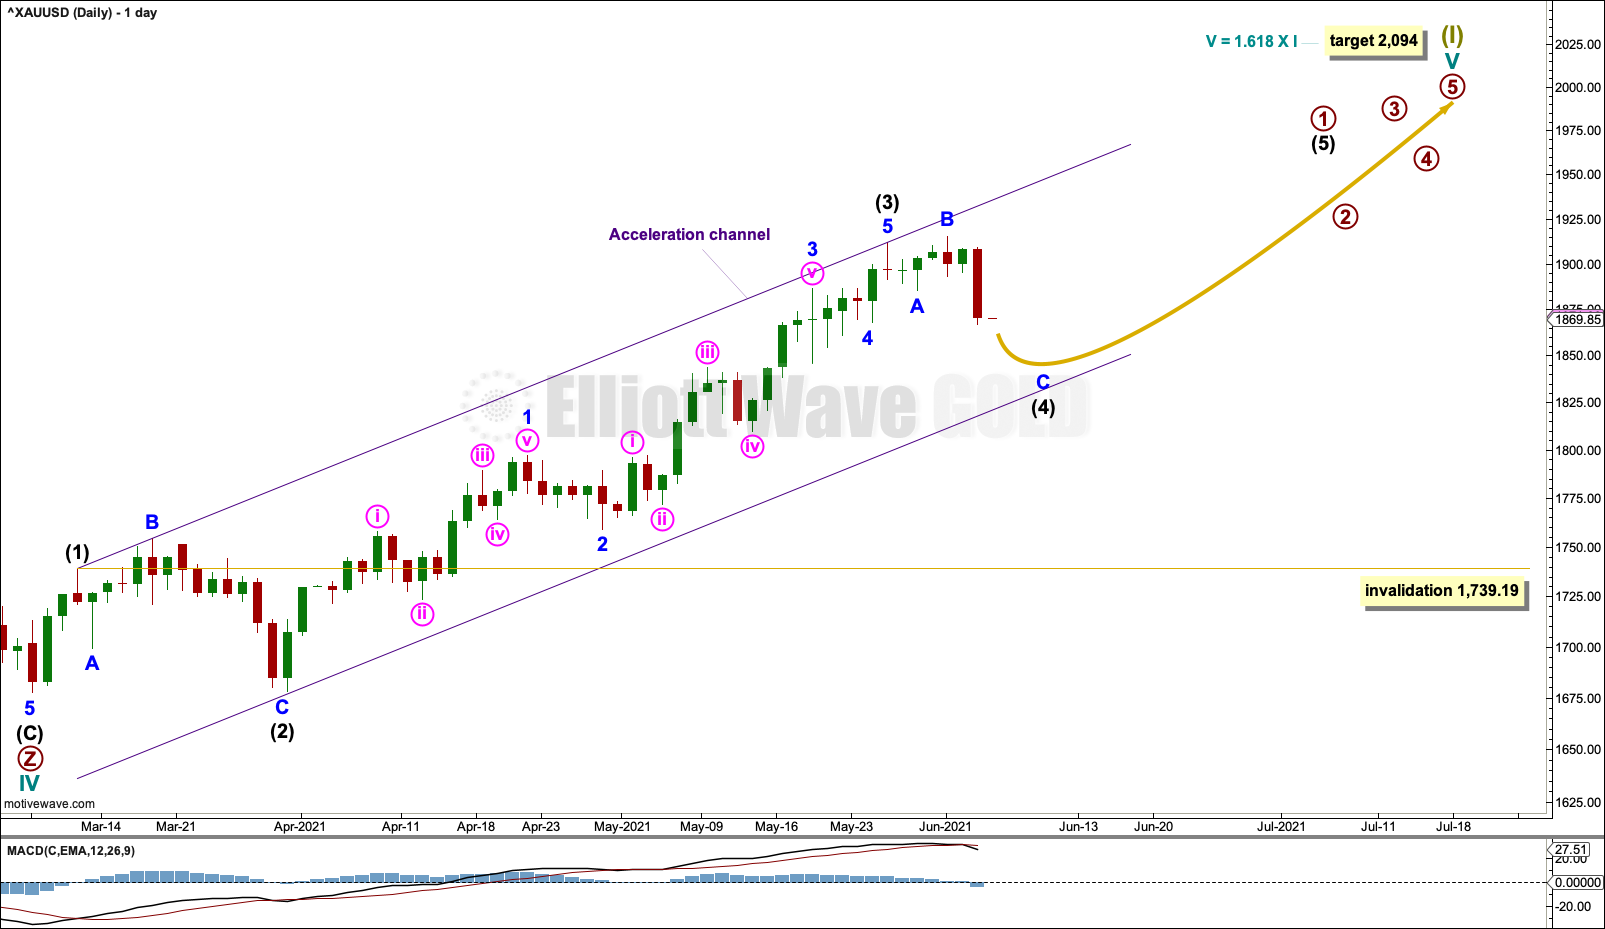
Cycle wave IV may be a complete triple zigzag.
A target is calculated for cycle wave V. If this target is wrong for this wave count, then it may be too low. As price approaches the target, if the structure is incomplete, then a higher target may be calculated.
Primary wave 1 within cycle wave V may be incomplete.
Within primary wave 1: Intermediate waves (1), (2) and (3) may be complete.
Intermediate wave (4) may continue lower as an expanded flat; it may find support about the lower edge of the Elliott channel if it is very deep.
Intermediate wave (4) may not move into intermediate wave (1) price territory below 1,739.19.
HOURLY CHART
Click chart to enlarge.
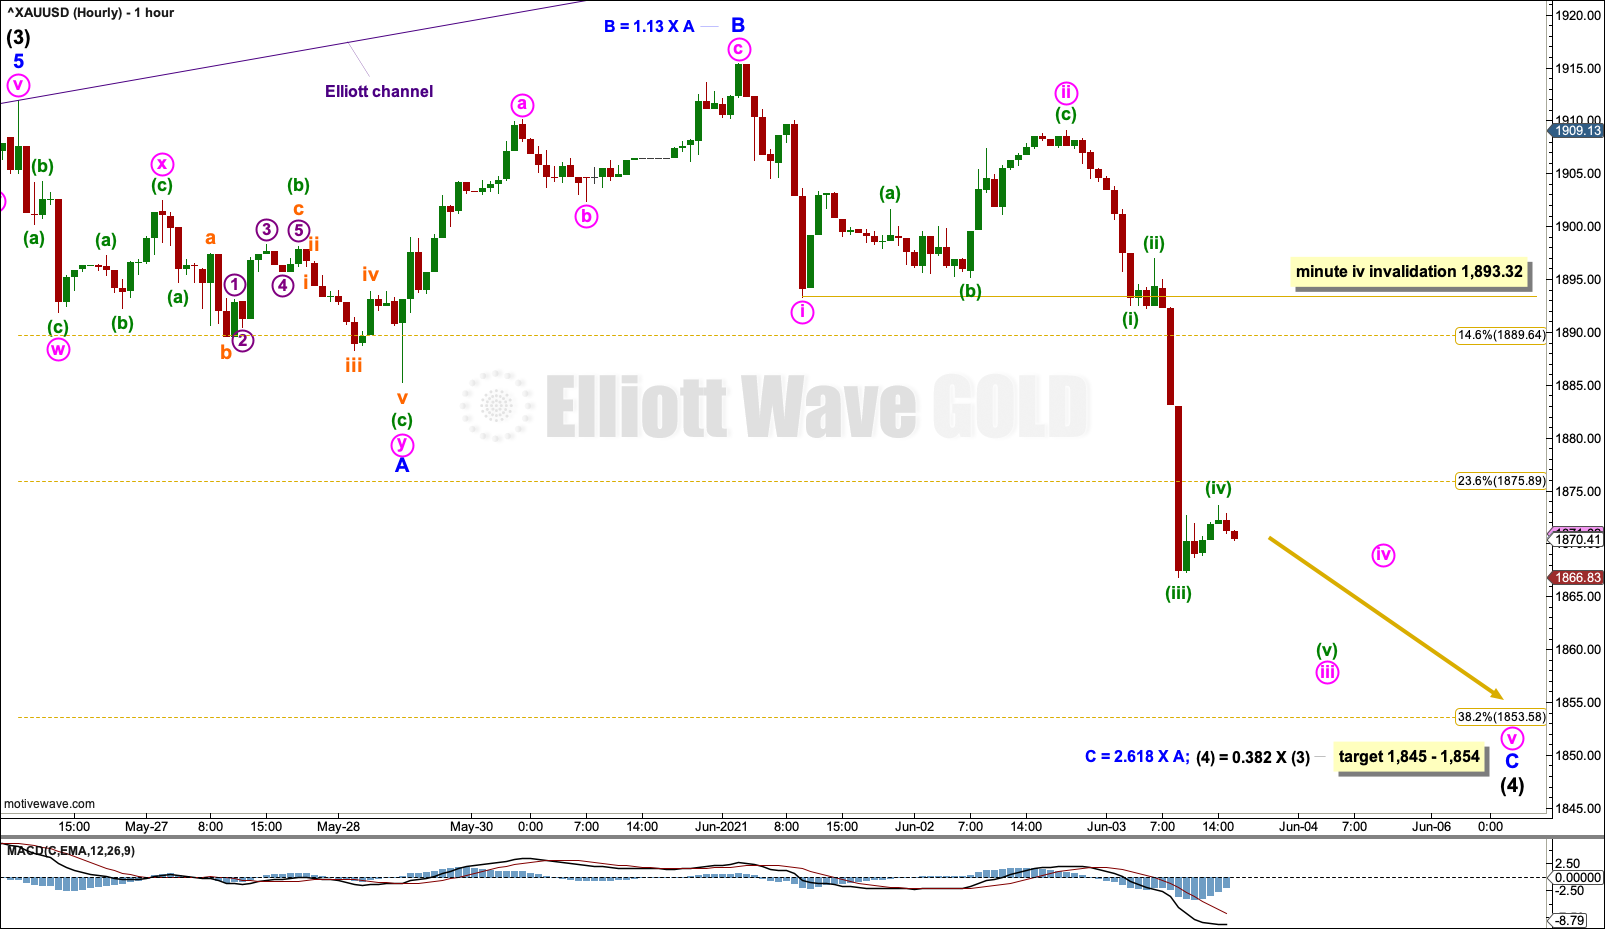
Intermediate wave (4) may be subdividing as an expanded flat. Expanded flats are common corrective structures.
Within an expanded flat: Minor waves A and B must both subdivide as corrective structures, and minor wave C must subdivide as a five wave motive structure, most likely an impulse. Minute wave iv within minor wave C may not move into minute wave i price territory above 1,893.32.
A target zone is calculated for intermediate wave (4) to end based upon two Elliott wave degrees. When minute wave iv may be complete, then the target may be calculated at a third degree. It may change at that stage.
ALTERNATE ELLIOTT WAVE COUNT
WEEKLY CHART
Click chart to enlarge.
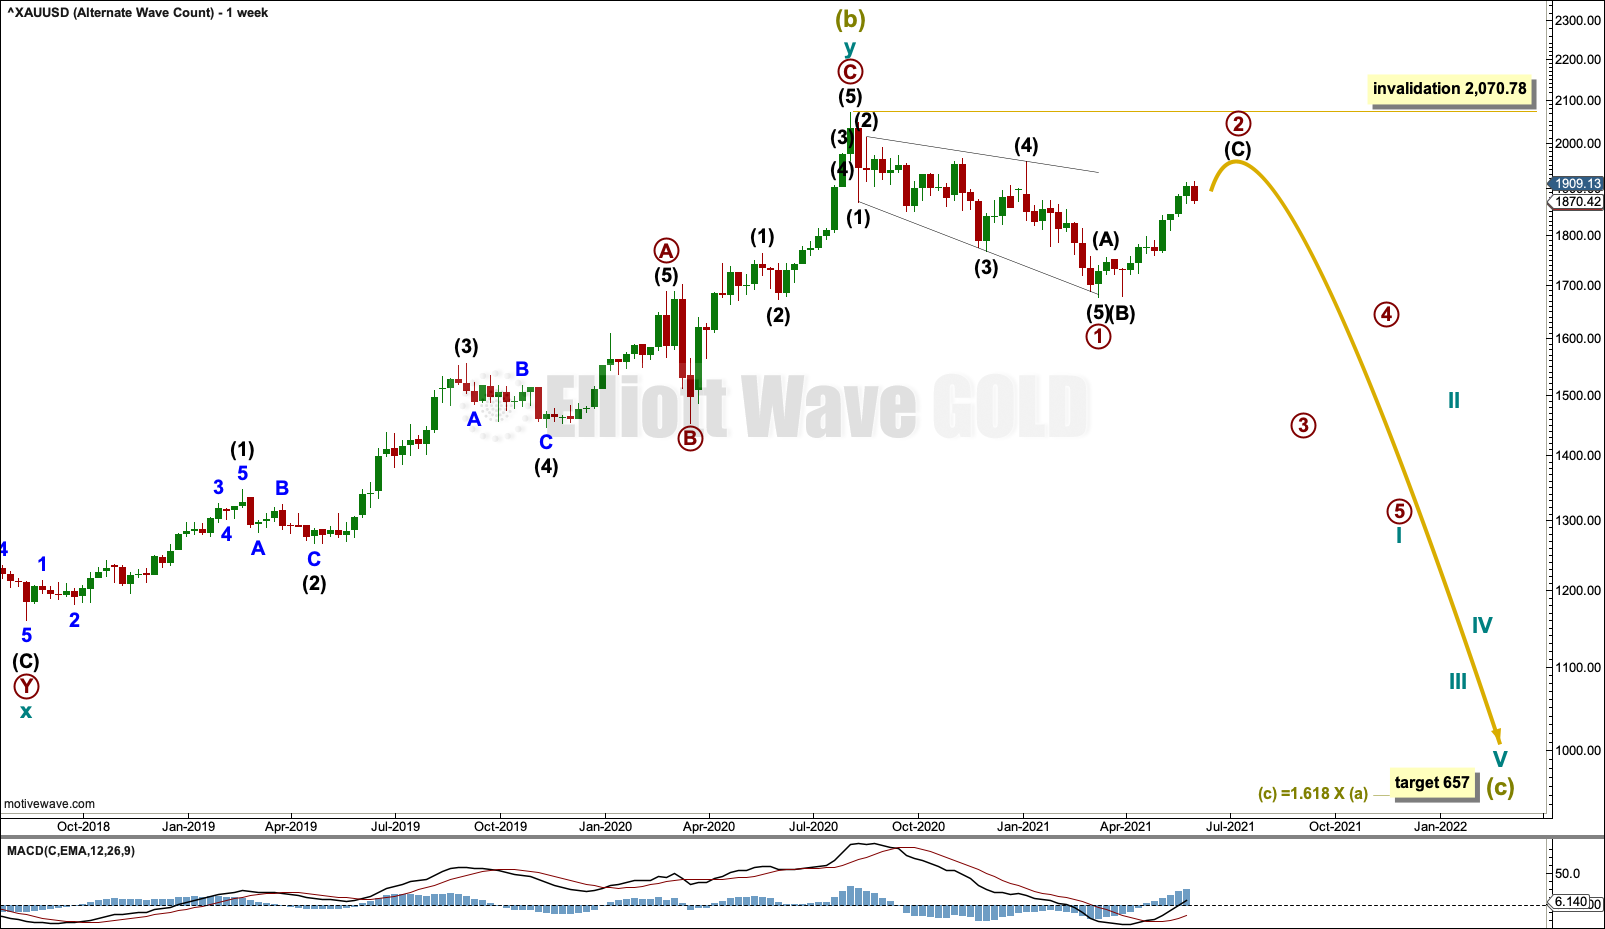
The bigger picture for this alternate Elliott wave count sees Gold as still within a bear market, in a three steps back pattern that is labelled Grand Super Cycle wave IV on monthly charts. Grand Super Cycle wave IV may be subdividing as an expanded flat pattern.
Super Cycle wave (b) within Grand Super Cycle wave IV may be a complete double zigzag. This wave count expects Super Cycle wave (c) to move price below the end of Super Cycle wave (a) at 1,046.27 to avoid a truncation and a very rare running flat. The target calculated expects a common Fibonacci ratio for Super Cycle wave (c).
Super Cycle wave (c) may have begun with a leading expanding diagonal for primary wave 1. Leading expanding diagonals in first wave positions are uncommon, so the probability of this wave count is reduced. However, it has a good fit and must be considered.
Second wave corrections to follow leading diagonals in first wave positions are usually very deep. Primary wave 2 may be expected to end at least about the 0.618 Fibonacci ratio at 1,920.42, and more likely a reasonable amount deeper than that. Primary wave 2 may not move beyond the start of primary wave 1 above 2,070.78.
DAILY CHART

Click chart to enlarge.
Intermediate wave (C) may be subdividing as an impulse. Minor wave 4 within intermediate wave (C) may now be complete as an expanded flat.
If it continues lower, then minor wave 4 may not move into minor wave 1 price territory below 1,757.92.
The target for intermediate wave (C) is now calculated at a a second wave degree, so now it widens to a zone.
TECHNICAL ANALYSIS
WEEKLY CHART
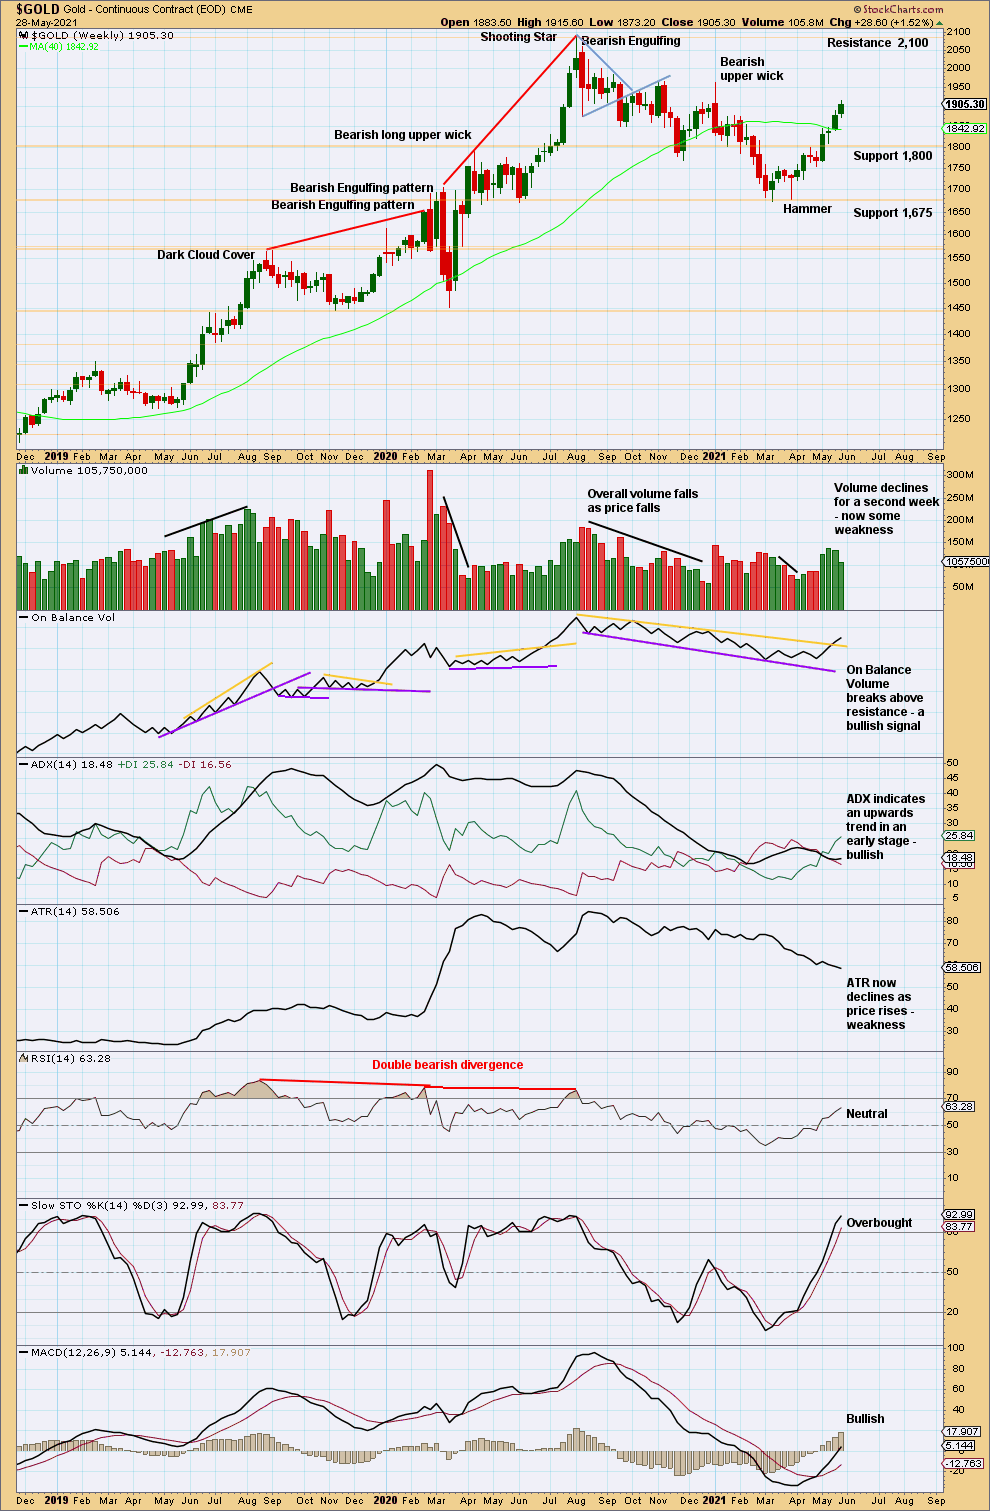
Click chart to enlarge. Chart courtesy of StockCharts.com.
There is an upwards trend now in place. However, two sessions in a row with declining volume now signal some weakness. A consolidation or pullback within the trend may occur here.
DAILY CHART
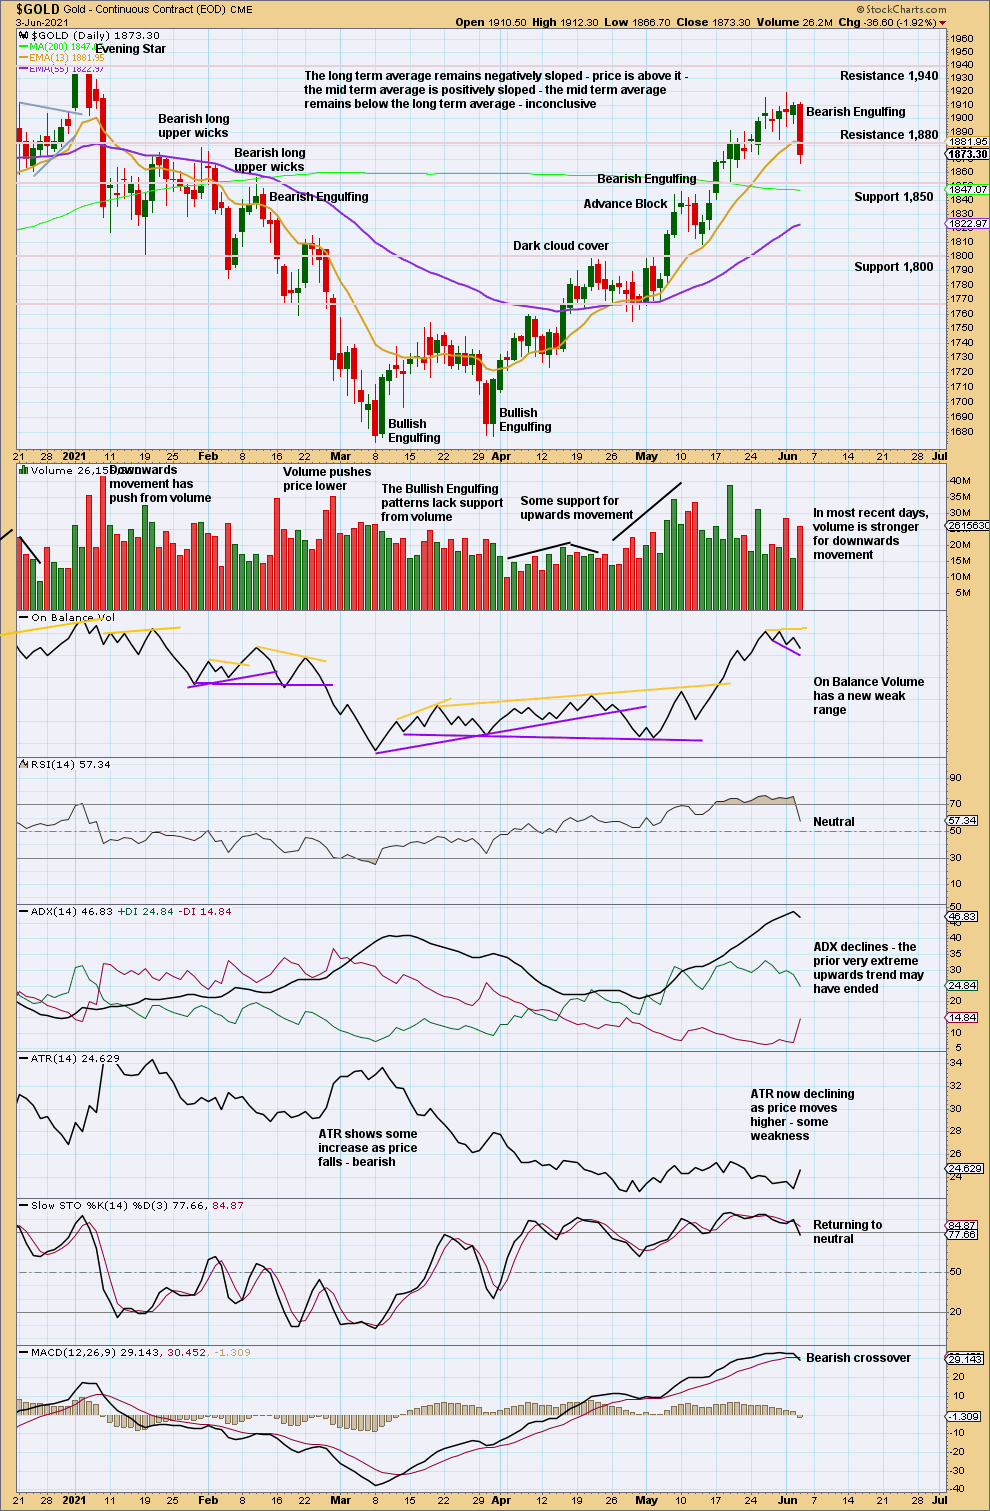
Click chart to enlarge. Chart courtesy of StockCharts.com.
With ADX indicating the prior upwards trend reached very extreme and RSI reaching overbought, a strong Bearish Engulfing pattern now has support from volume. This indicates a trend change here. More downwards movement may reasonably be expected.
GDX WEEKLY CHART
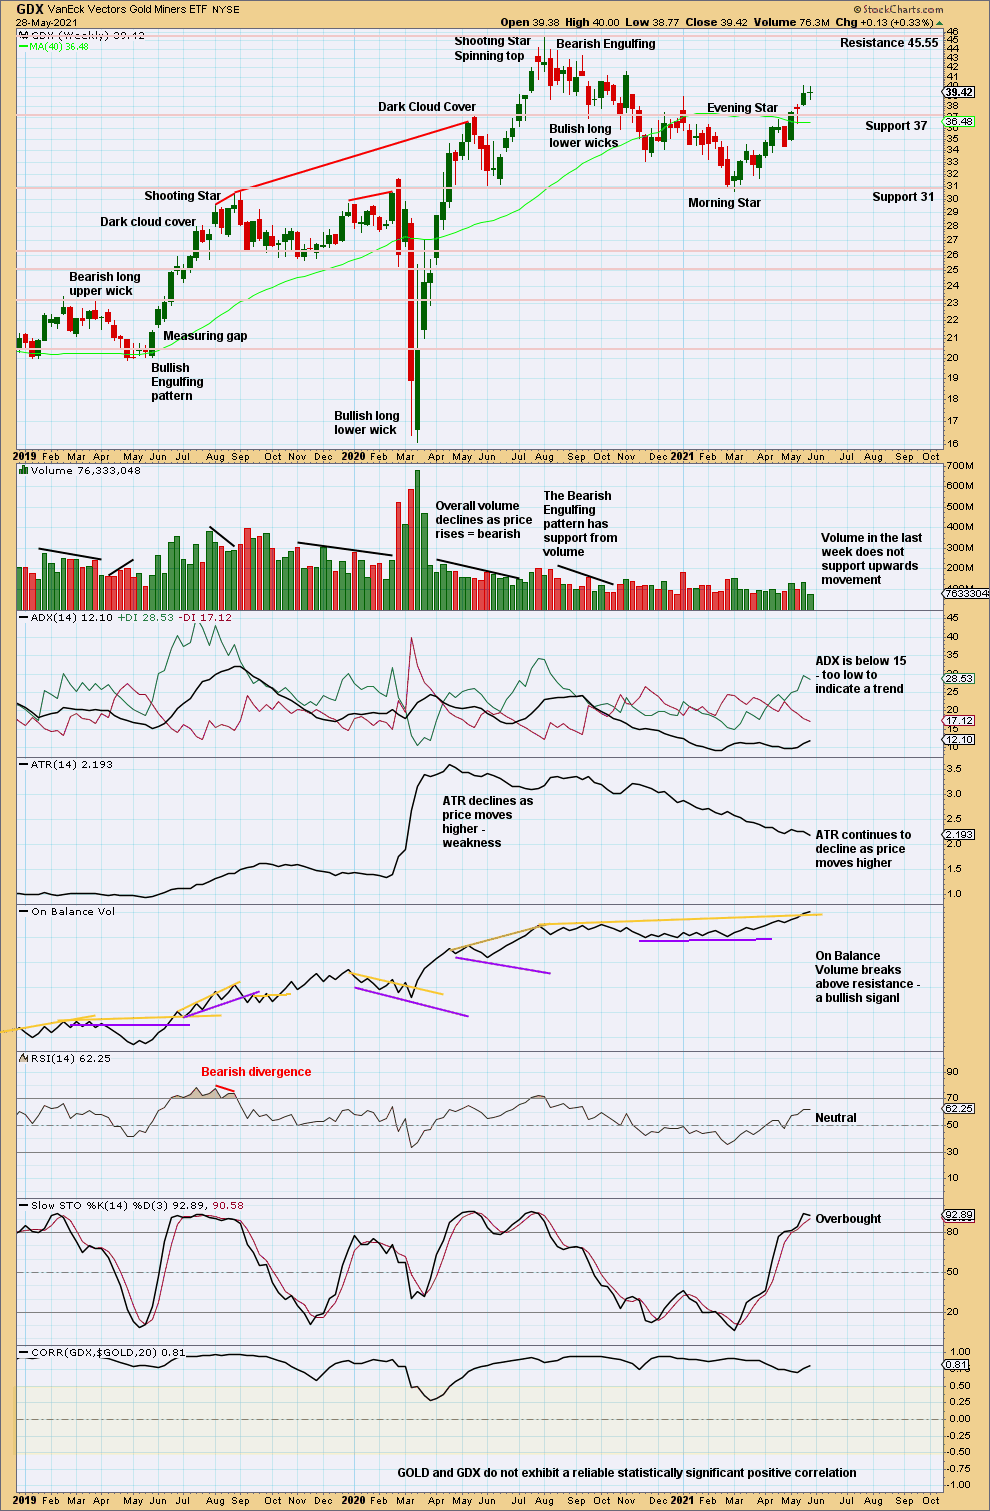
Click chart to enlarge. Chart courtesy of StockCharts.com.
Next resistance is at 45.55.
Upwards movement continues. If there is an upwards trend, then the trend would be in its very early stages; there is plenty of room for it to continue.
GDX DAILY CHART
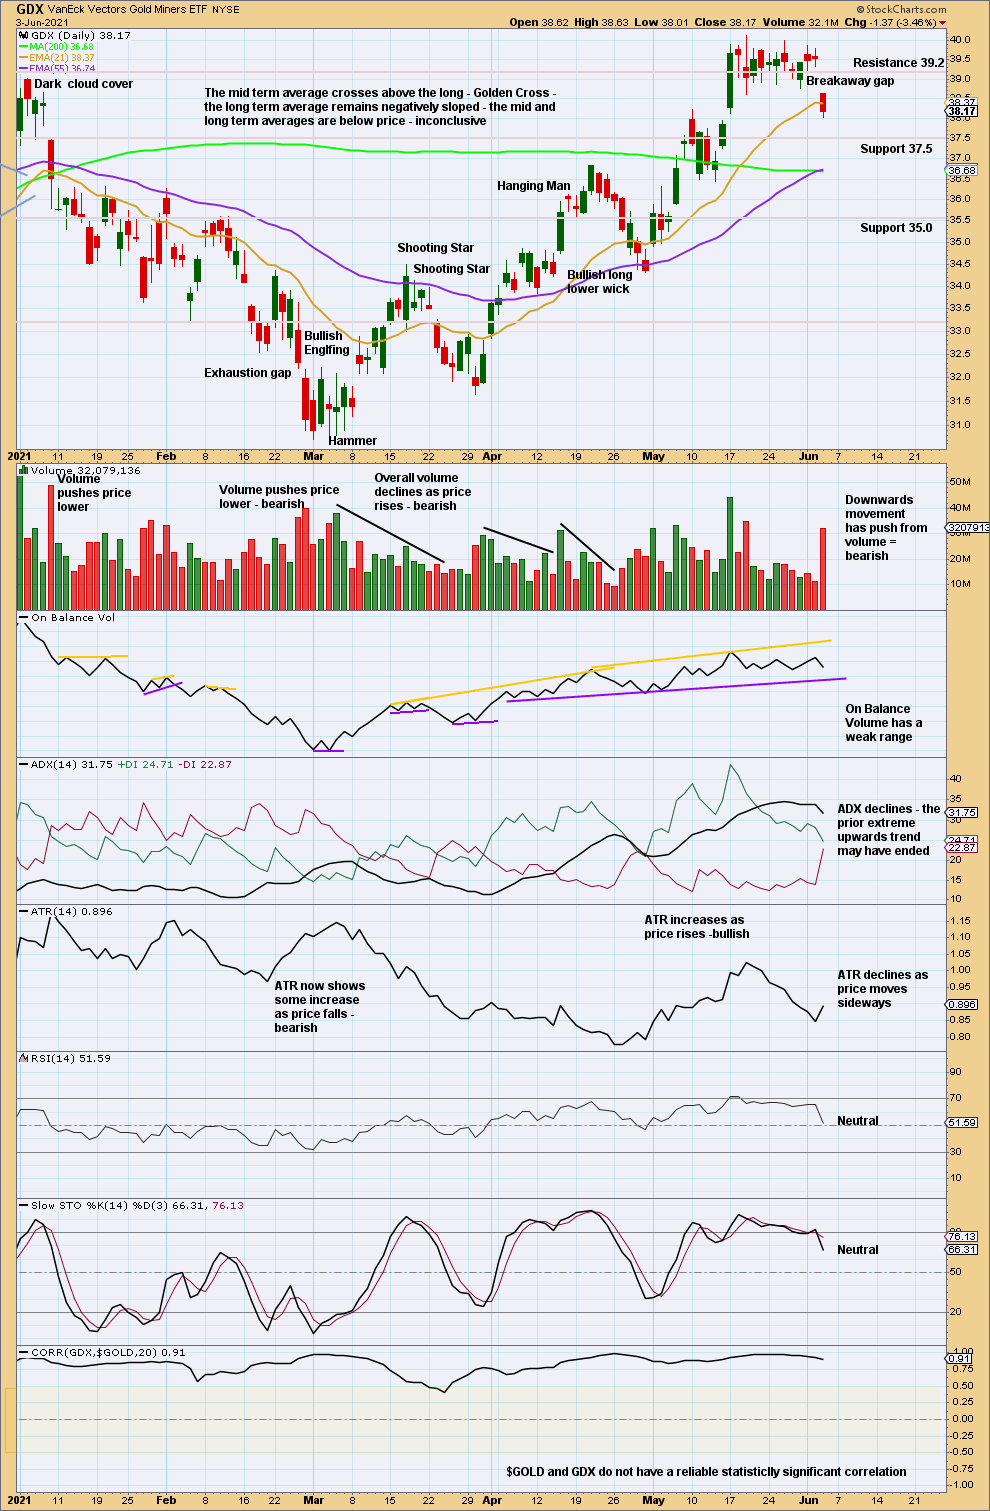
Click chart to enlarge. Chart courtesy of StockCharts.com.
A downwards breakout negates the pennant.
The breakaway gap at 39.34 may offer resistance. Price may continue to fall to support at 37.50.
Published @ 07:42 p.m. ET.
—
Careful risk management protects your trading account(s).
Follow my two Golden Rules:
1. Always trade with stops.
2. Risk only 1-5% of equity on any one trade.
—
New updates to this analysis are in bold.
—