
GOLD: Elliott Wave and Technical Analysis | Charts – June 10, 2021
A downwards session closes green with a long lower wick.
A signal today from On Balance Volume supports both Elliott wave counts, which expect the same direction next.
Summary: The main wave count is bullish. The next mid-term target is at 1,923. The longer-term target is at 2,094 although this may need to be revised higher.
An alternate Elliott wave count is considered. The next target zone for upwards movement is at 1,940 to 1,941.
Grand SuperCycle analysis and last monthly charts are here.
MAIN ELLIOTT WAVE COUNT
WEEKLY CHART
Click chart to enlarge.
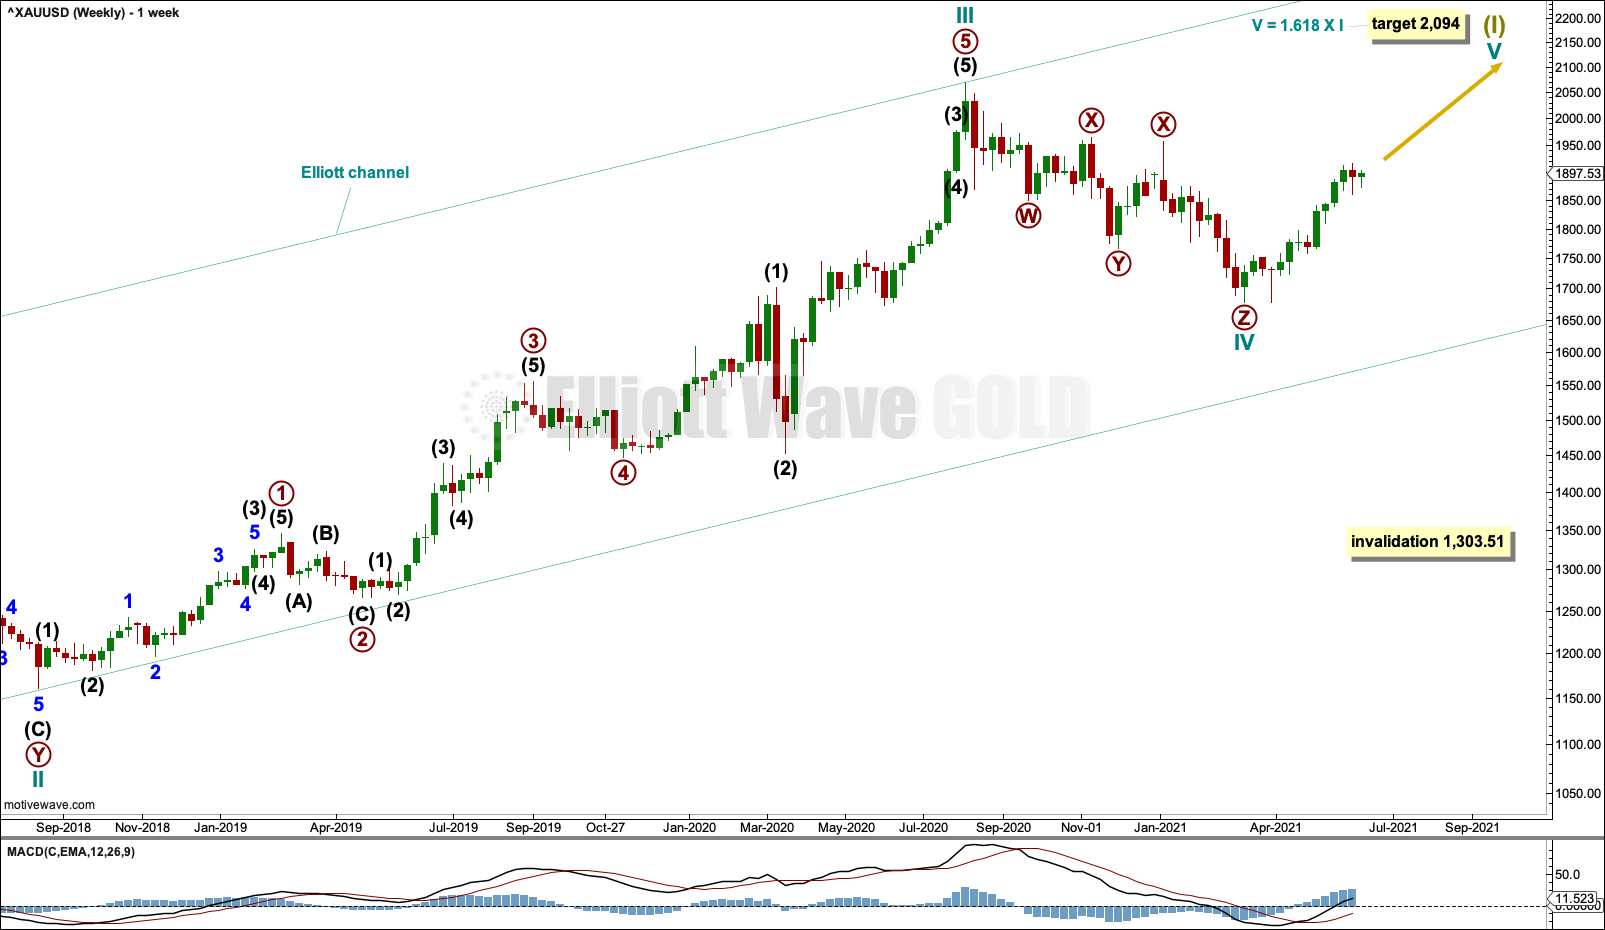
This wave count sees the the bear market complete at the last major low for Gold on 3 December 2015.
If Gold is in a new bull market, then it should begin with a five wave structure upwards on the weekly chart.
Cycle wave I fits as a five wave impulse with reasonably proportionate corrections for primary waves 2 and 4.
Cycle wave II fits as a double flat. However, within the first flat correction labelled primary wave W, this wave count needs to ignore what looks like an obvious triangle from July to September 2016 (this can be seen labelled as a triangle on the second weekly chart on prior analysis here). This movement must be labelled as a series of overlapping first and second waves. Ignoring this triangle reduces the probability of this wave count in Elliott wave terms.
Cycle wave IV may be a complete triple zigzag. Triple zigzags are not rare structures, but they are not common. The probability of this wave count is further reduced in Elliott wave terms. This is one reason why an alternate is still considered.
If the third zigzag of primary wave Z continues lower, then cycle wave IV may not move into cycle wave I price territory below 1,303.51.
DAILY CHART

Click chart to enlarge.
Cycle wave IV may be a complete triple zigzag.
A target is calculated for cycle wave V. If this target is wrong for this wave count, then it may be too low. As price approaches the target, if the structure is incomplete, then a higher target may be calculated.
Primary wave 1 within cycle wave V may be incomplete.
Within primary wave 1: Intermediate waves (1), (2) and (3) may be complete.
Intermediate wave (4) may be complete as an expanded flat. It may also continue lower or sideways as a double flat or double combination to find support about the lower edge of the Elliott channel.
Intermediate wave (4) may not move into intermediate wave (1) price territory below 1,739.19.
HOURLY CHART
Click chart to enlarge.
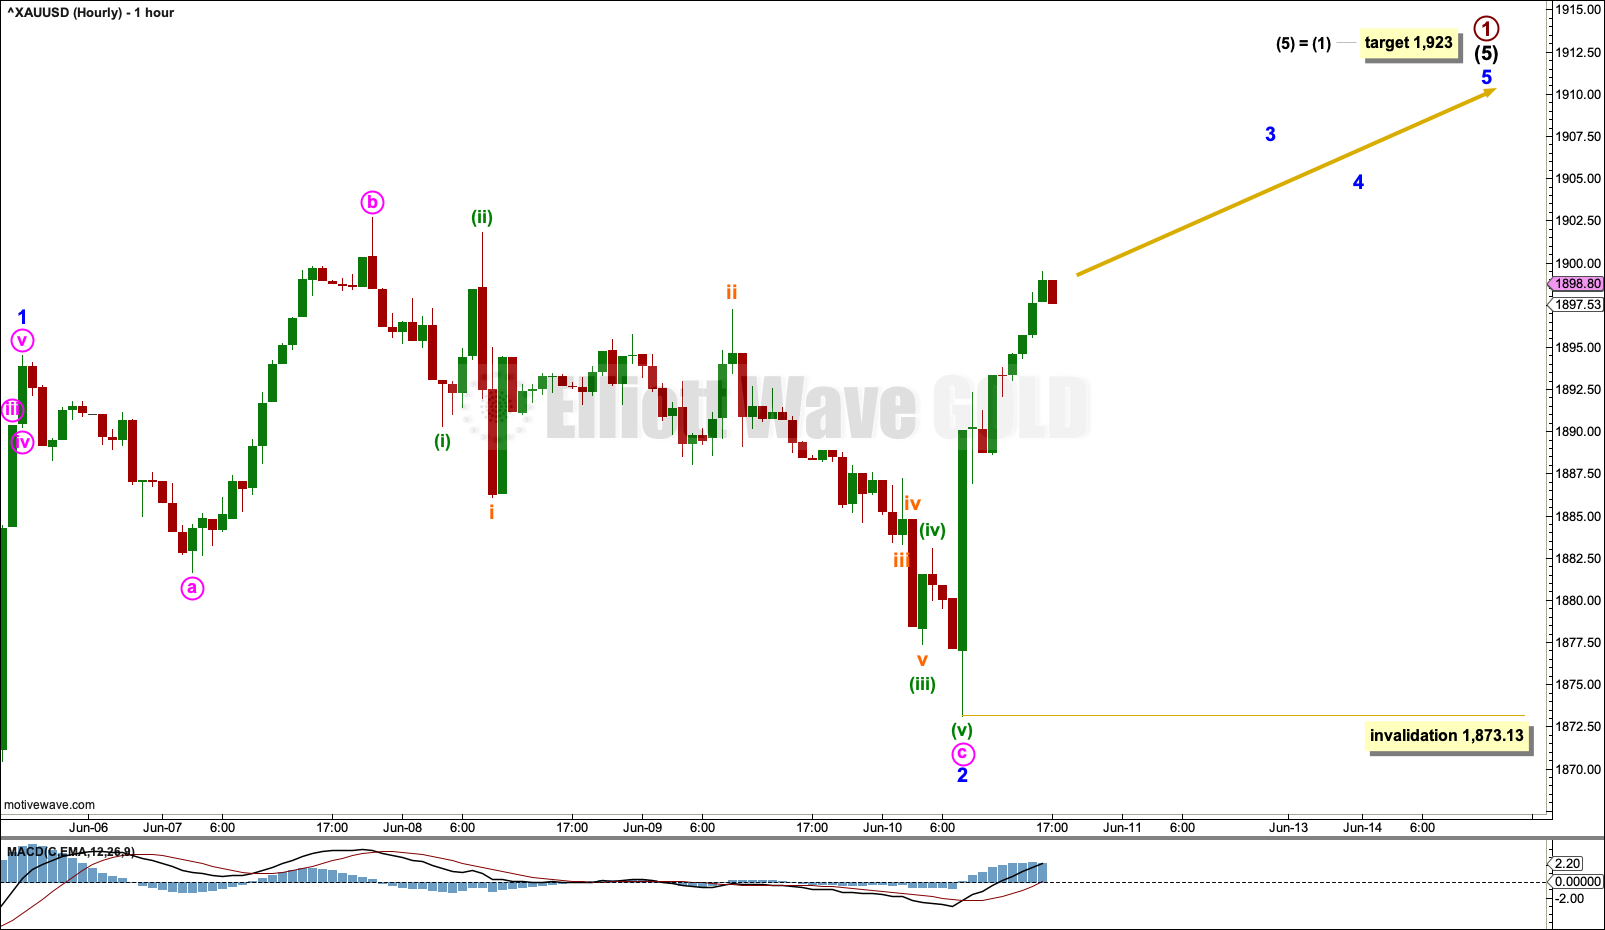
Intermediate wave (5) may have begun.
Intermediate wave (5) may continue for a few more sessions. The target calculated expects intermediate wave (5) to exhibit the most common Fibonacci ratio to intermediate wave (1).
Minor wave 2 may be complete as an expanded flat.
Minor wave 3 may have begun. An increase in upwards momentum may be expected.
ALTERNATE ELLIOTT WAVE COUNT
WEEKLY CHART
Click chart to enlarge.
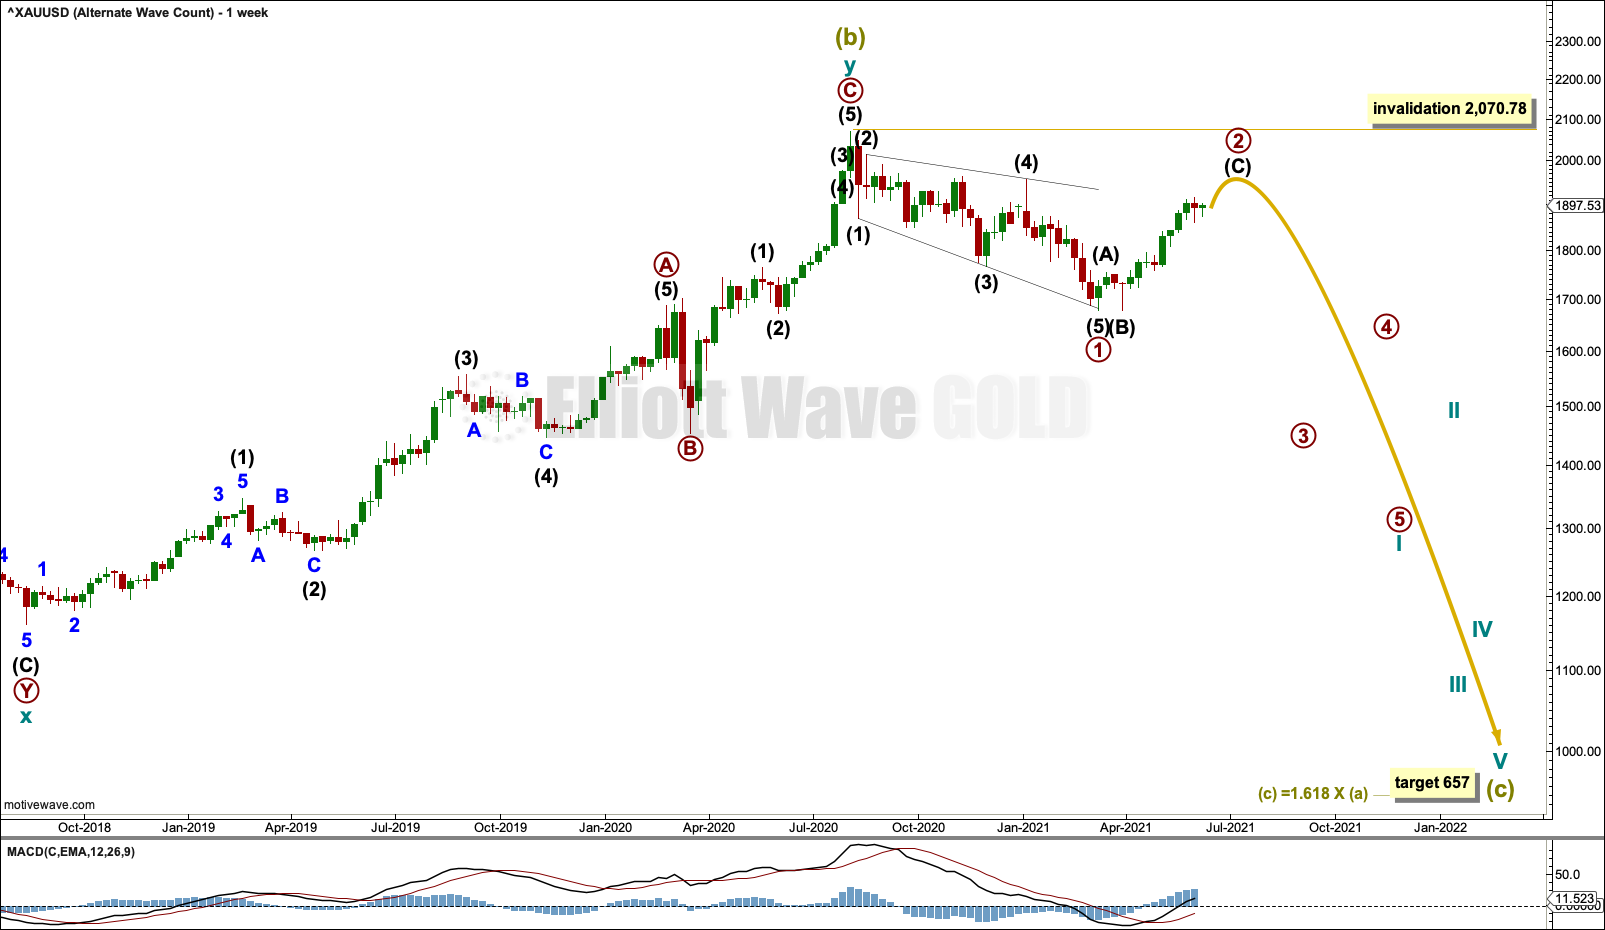
The bigger picture for this alternate Elliott wave count sees Gold as within a bear market, in a three steps back pattern that is labelled Grand Super Cycle wave IV on monthly charts. Grand Super Cycle wave IV may be subdividing as an expanded flat pattern.
Super Cycle wave (b) within Grand Super Cycle wave IV may be a complete double zigzag. This wave count expects Super Cycle wave (c) to move price below the end of Super Cycle wave (a) at 1,046.27 to avoid a truncation and a very rare running flat. The target calculated expects a common Fibonacci ratio for Super Cycle wave (c).
Super Cycle wave (c) may have begun with a leading expanding diagonal for primary wave 1. Leading expanding diagonals in first wave positions are uncommon, so the probability of this wave count is reduced. However, it has a good fit and must be considered.
Second wave corrections to follow leading diagonals in first wave positions are usually very deep. Primary wave 2 may be expected to end at least about the 0.618 Fibonacci ratio at 1,920.42, and more likely a reasonable amount deeper than that. Primary wave 2 may not move beyond the start of primary wave 1 above 2,070.78.
DAILY CHART
Click chart to enlarge.
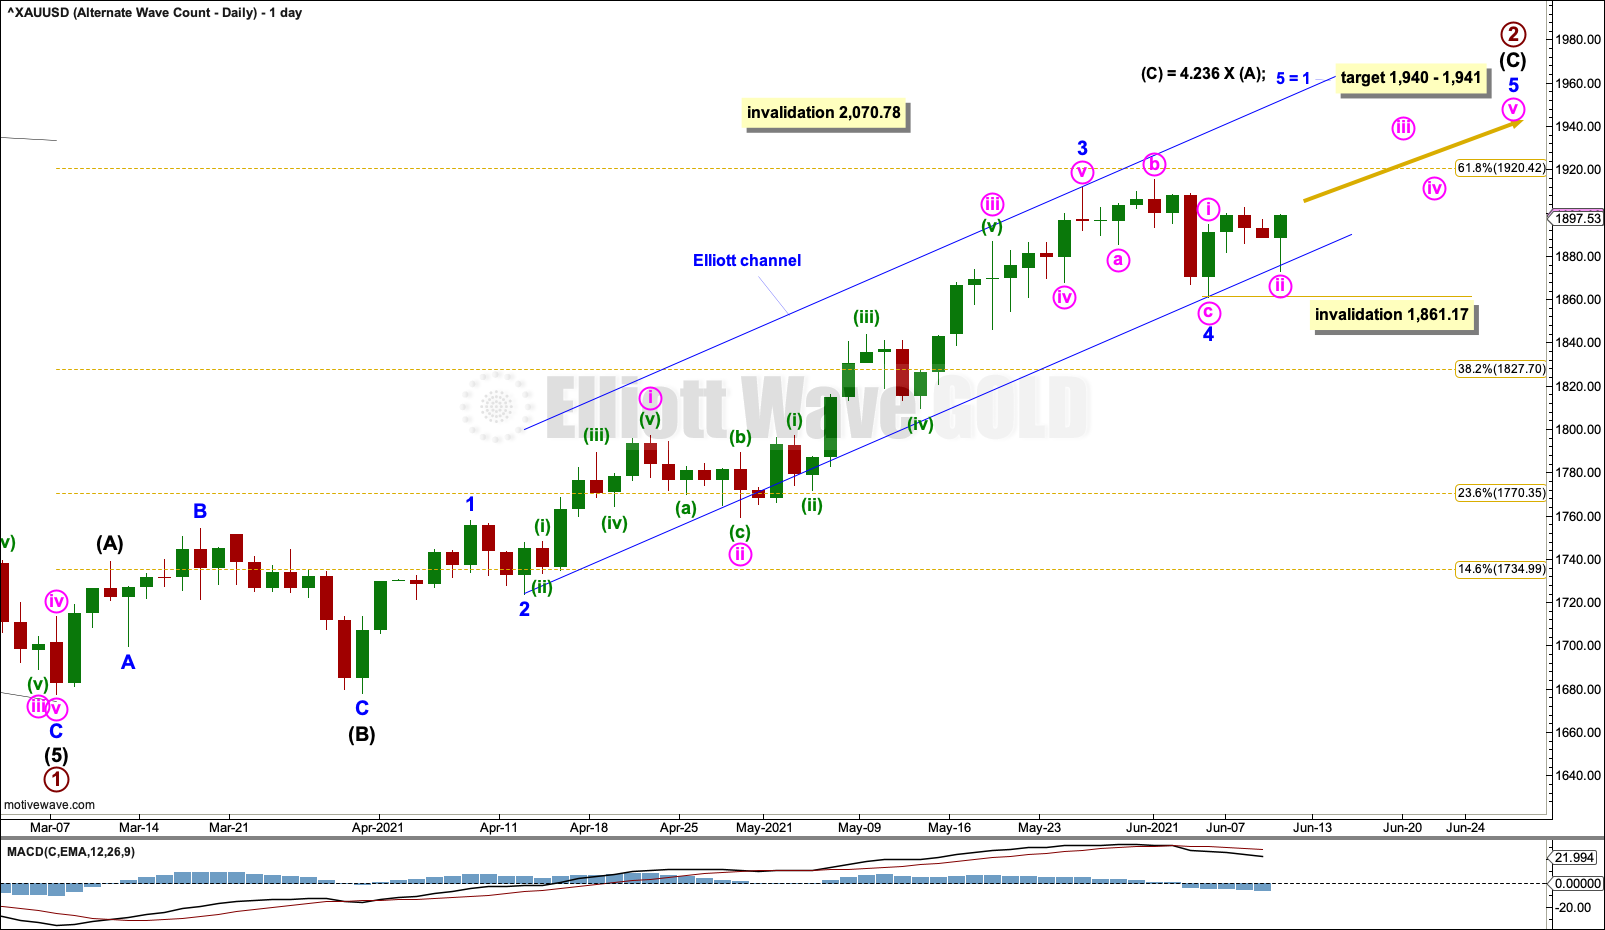
Intermediate wave (C) may be subdividing as an impulse. Minor wave 4 within intermediate wave (C) may now be complete as an expanded flat.
The target for intermediate wave (C) is now calculated at a a second wave degree, so now it widens to a zone.
No second wave correction within minor wave 5 may move beyond the start of its first wave below 1,861.17.
The channel is redrawn using Elliott’s second technique, because minor wave 4 breached a channel drawn using the first technique. Draw the first trend line from the ends of minor waves 2 to 4, then place a parallel copy on the end of minor wave 3. Minor wave 5 may end either mid way within the channel or about the upper edge. When the channel is breached by subsequent downwards movement, then it may then be used to indicate a trend change.
TECHNICAL ANALYSIS
WEEKLY CHART
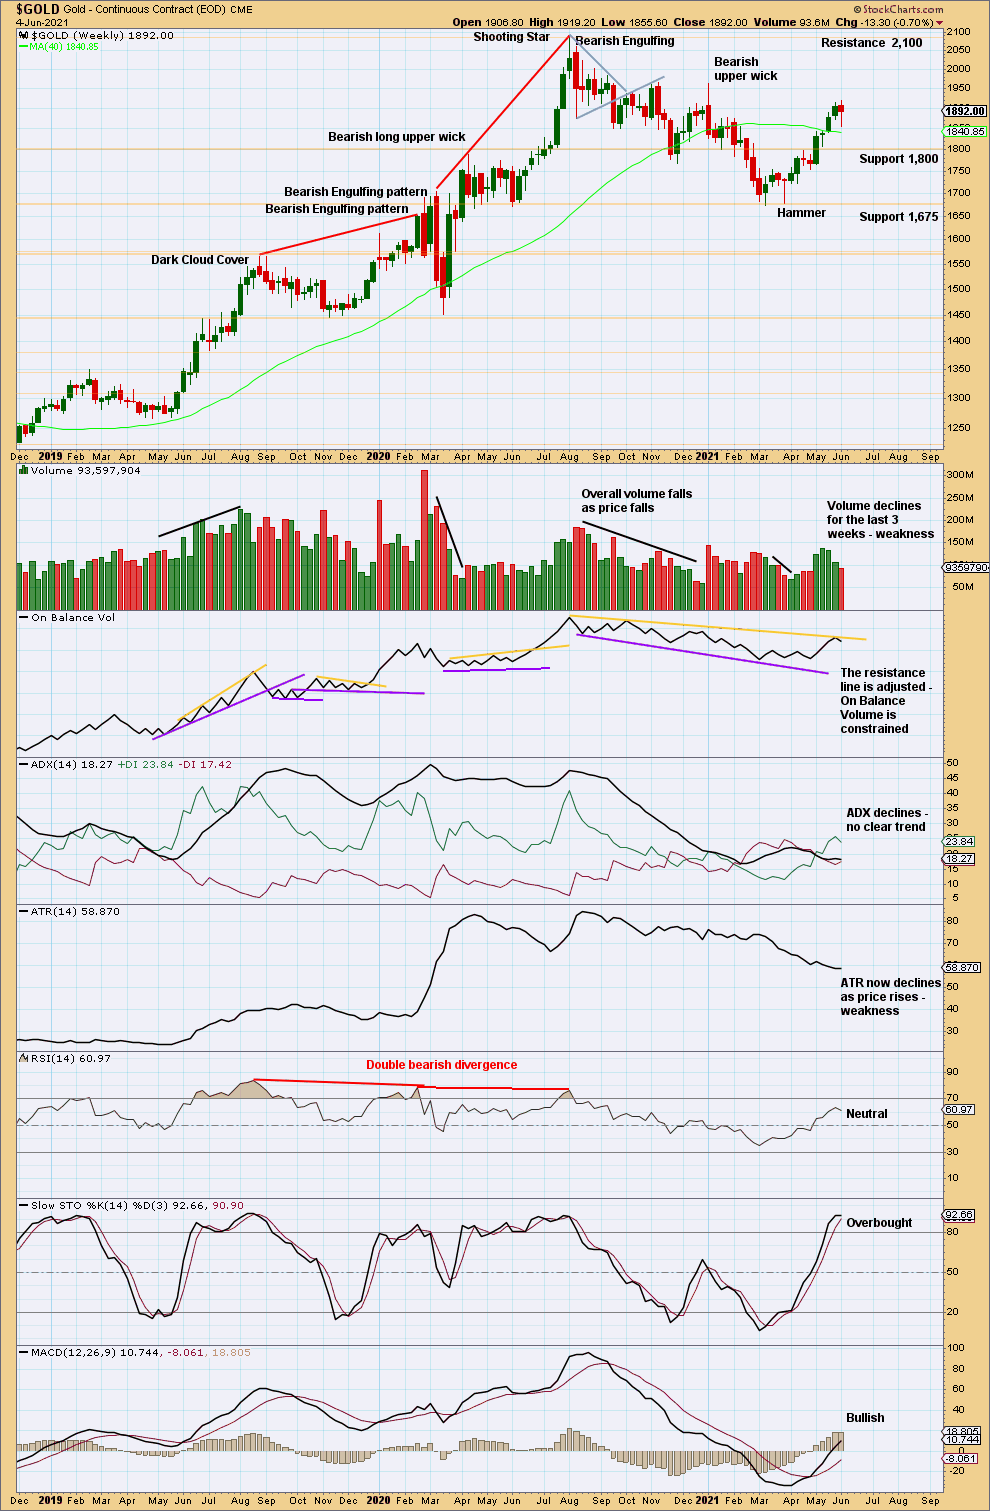
Click chart to enlarge. Chart courtesy of StockCharts.com.
The upwards trend may have ended, for now. There is no bearish candlestick reversal pattern and the trend did not reach extreme. Pullbacks or consolidations here may be more short term in nature.
DAILY CHART
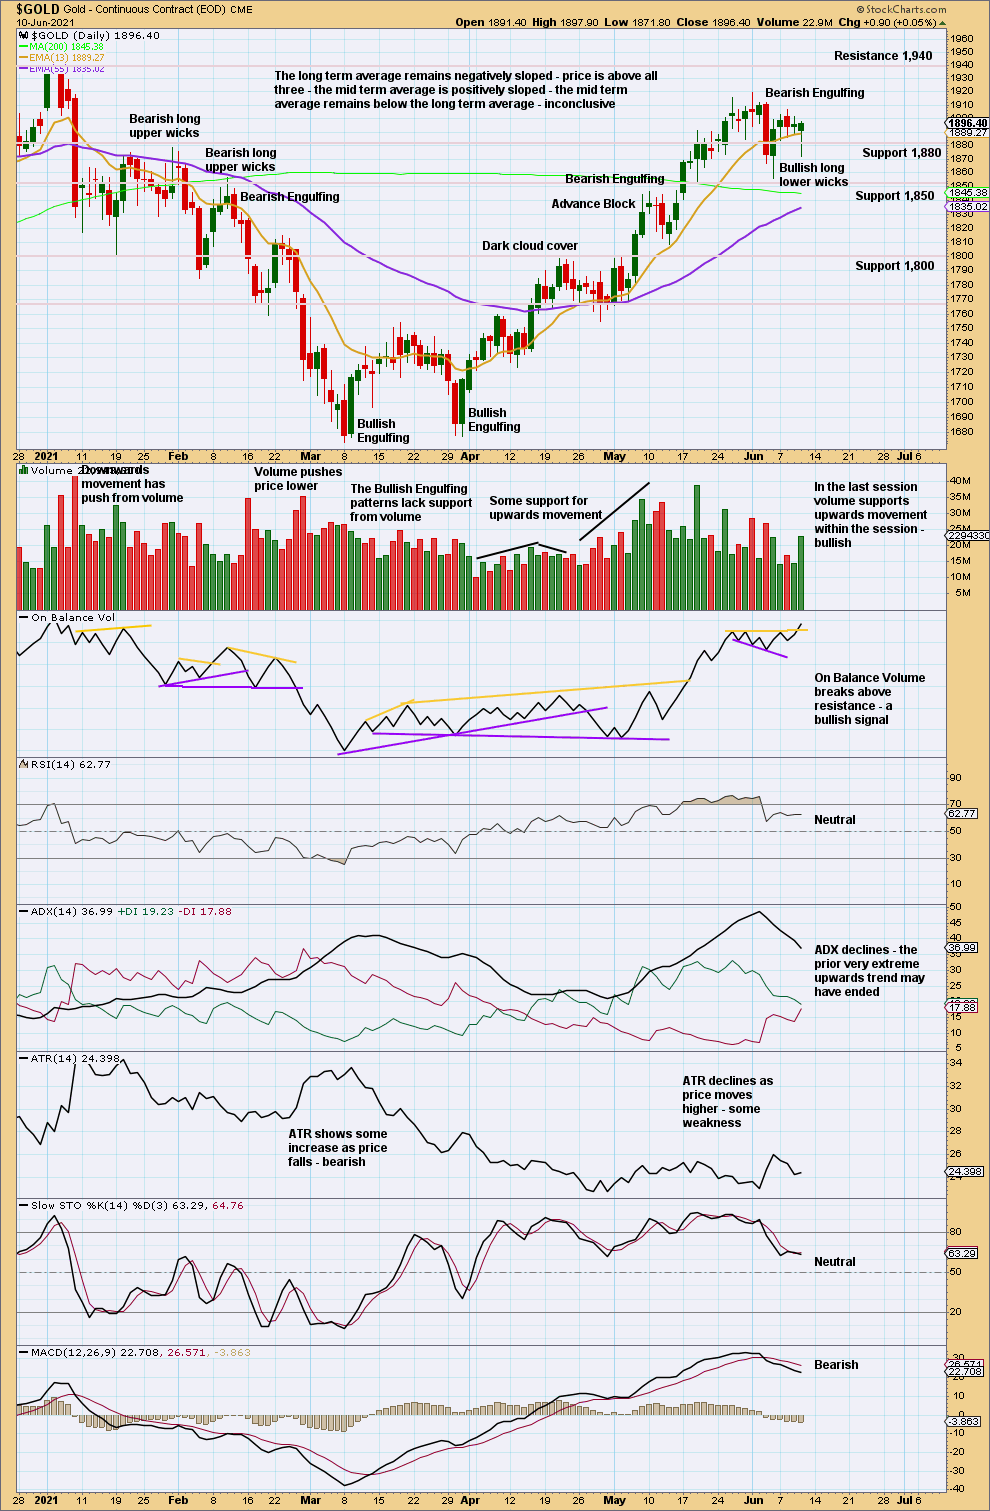
Click chart to enlarge. Chart courtesy of StockCharts.com.
An increase in volume today may be for upwards movement within this last session, although the session has moved price lower with a lower low and a higher high. A bullish signal today from On Balance Volume suggests upwards movement may continue. RSI may again reach into overbought; if it does, then it may develop bearish divergence. Only when strong single or preferably double bearish divergence between RSI and price has developed would a larger trend change be expected. The upwards trend may now be resuming; it may remain extreme.
GDX WEEKLY CHART
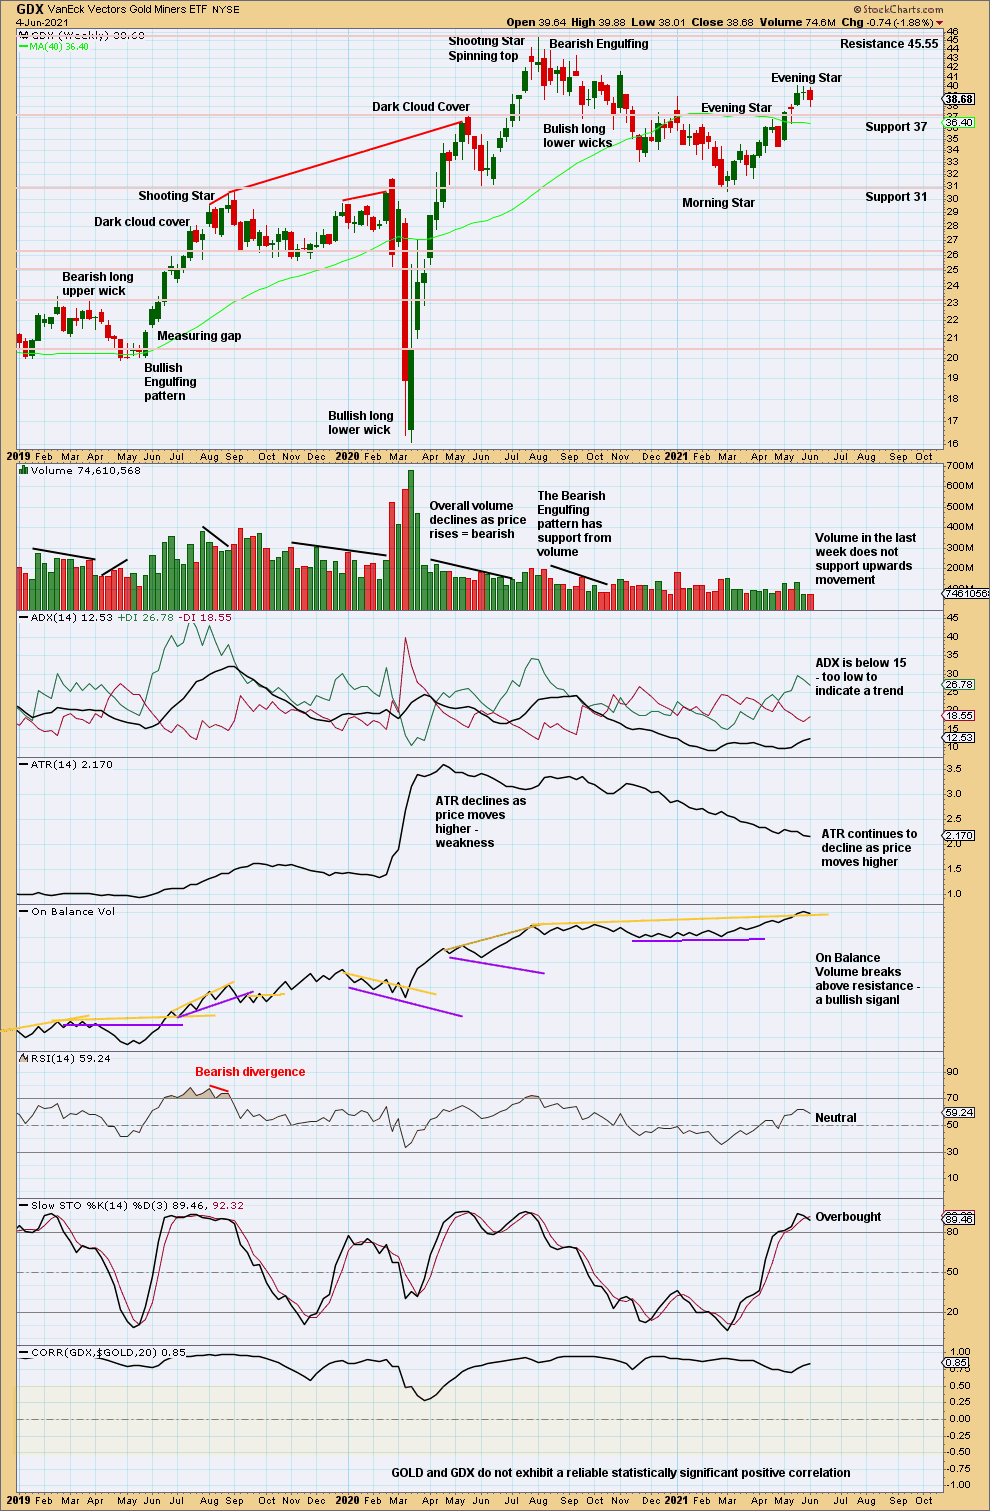
Click chart to enlarge. Chart courtesy of StockCharts.com.
Next resistance is at 45.55.
An Evening Doji Star may be a reversal pattern, but the third candlestick does not have support from volume and the last Evening Doji Star was not followed by a trend change.
If ADX indicates an upwards trend soon, then it would be in an early stage; there would be a long time and distance to go before it may become extreme.
GDX DAILY CHART
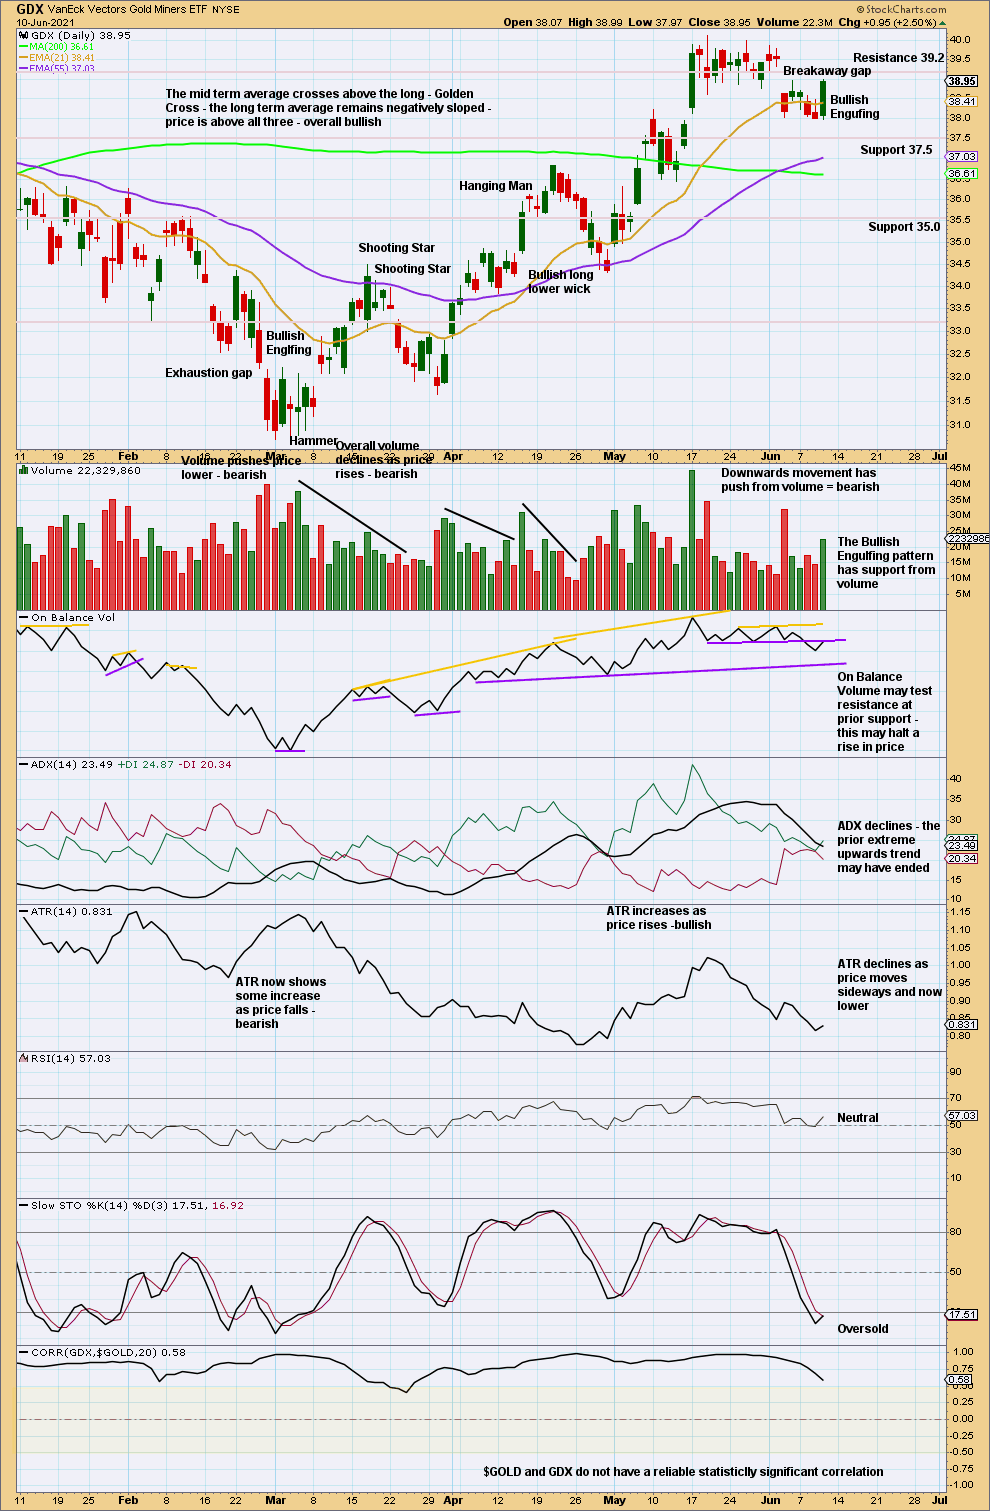
Click chart to enlarge. Chart courtesy of StockCharts.com.
The breakaway gap at 39.34 may offer resistance. The pullback now looks to be over with a strong Bullish Engulfing pattern. If the gap at 39.34 is closed and if On Balance Volume breaks above resistance, then confidence in the upwards trend resuming may be had, which may be possible tomorrow.
Published @ 07:08 p.m. ET.
—
Careful risk management protects your trading account(s).
Follow my two Golden Rules:
1. Always trade with stops.
2. Risk only 1-5% of equity on any one trade.
—
New updates to this analysis are in bold.
—