
GOLD: Elliott Wave and Technical Analysis | Charts – June 11, 2021
A mostly sideways week has closed red on a strongly downwards day.
The alternate Elliott wave count is adjusted. The main Elliott wave count remains the same.
Summary: The main wave count is bullish. The next target is at 1,923. The longer-term target is at 2,094 although this may need to be revised higher.
An alternate Elliott wave count is considered. It expects sideways or lower movement here, before the upwards trend resumes.
Grand SuperCycle analysis and last monthly charts are here.
MAIN ELLIOTT WAVE COUNT
WEEKLY CHART
Click chart to enlarge.
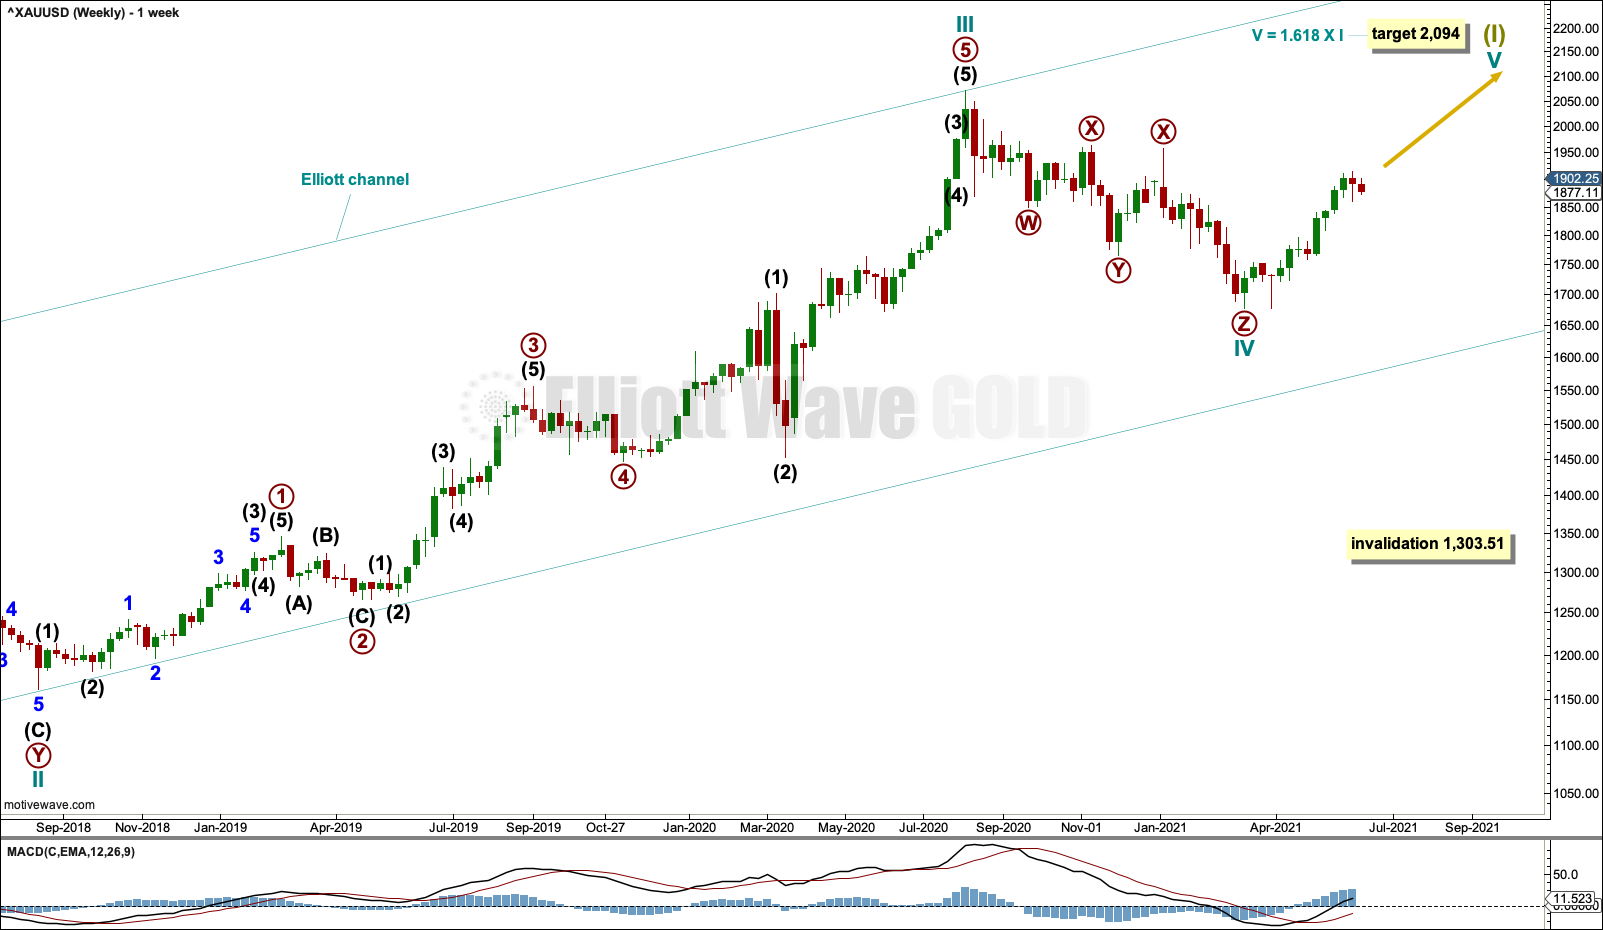
This wave count sees the the bear market complete at the last major low for Gold on 3 December 2015.
If Gold is in a new bull market, then it should begin with a five wave structure upwards on the weekly chart.
Cycle wave I fits as a five wave impulse with reasonably proportionate corrections for primary waves 2 and 4.
Cycle wave II fits as a double flat. However, within the first flat correction labelled primary wave W, this wave count needs to ignore what looks like an obvious triangle from July to September 2016 (this can be seen labelled as a triangle on the second weekly chart on prior analysis here). This movement must be labelled as a series of overlapping first and second waves. Ignoring this triangle reduces the probability of this wave count in Elliott wave terms.
Cycle wave IV may be a complete triple zigzag. Triple zigzags are not rare structures, but they are not common. The probability of this wave count is further reduced in Elliott wave terms. This is one reason why an alternate is still considered.
If the third zigzag of primary wave Z continues lower, then cycle wave IV may not move into cycle wave I price territory below 1,303.51.
DAILY CHART
Click chart to enlarge.
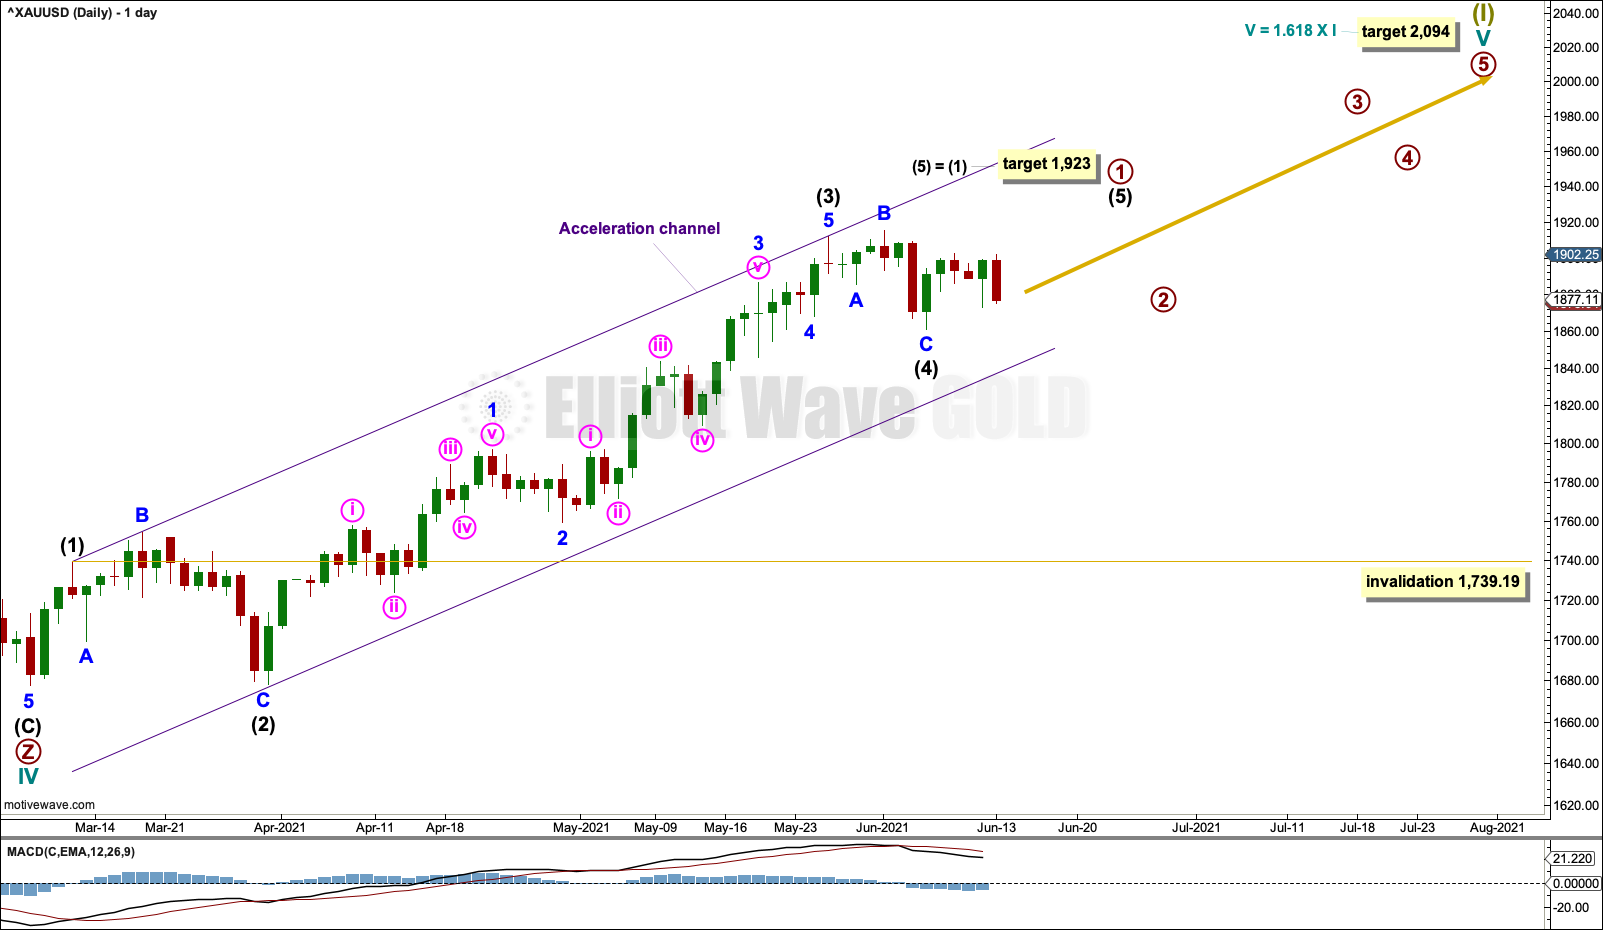
Cycle wave IV may be a complete triple zigzag.
A target is calculated for cycle wave V. If this target is wrong for this wave count, then it may be too low. As price approaches the target, if the structure is incomplete, then a higher target may be calculated.
Primary wave 1 within cycle wave V may be incomplete.
Within primary wave 1: Intermediate waves (1), (2) and (3) may be complete.
Intermediate wave (4) may be complete as an expanded flat. It may also continue lower or sideways as a double flat or double combination to find support about the lower edge of the Elliott channel.
Intermediate wave (4) may not move into intermediate wave (1) price territory below 1,739.19.
HOURLY CHART
Click chart to enlarge.
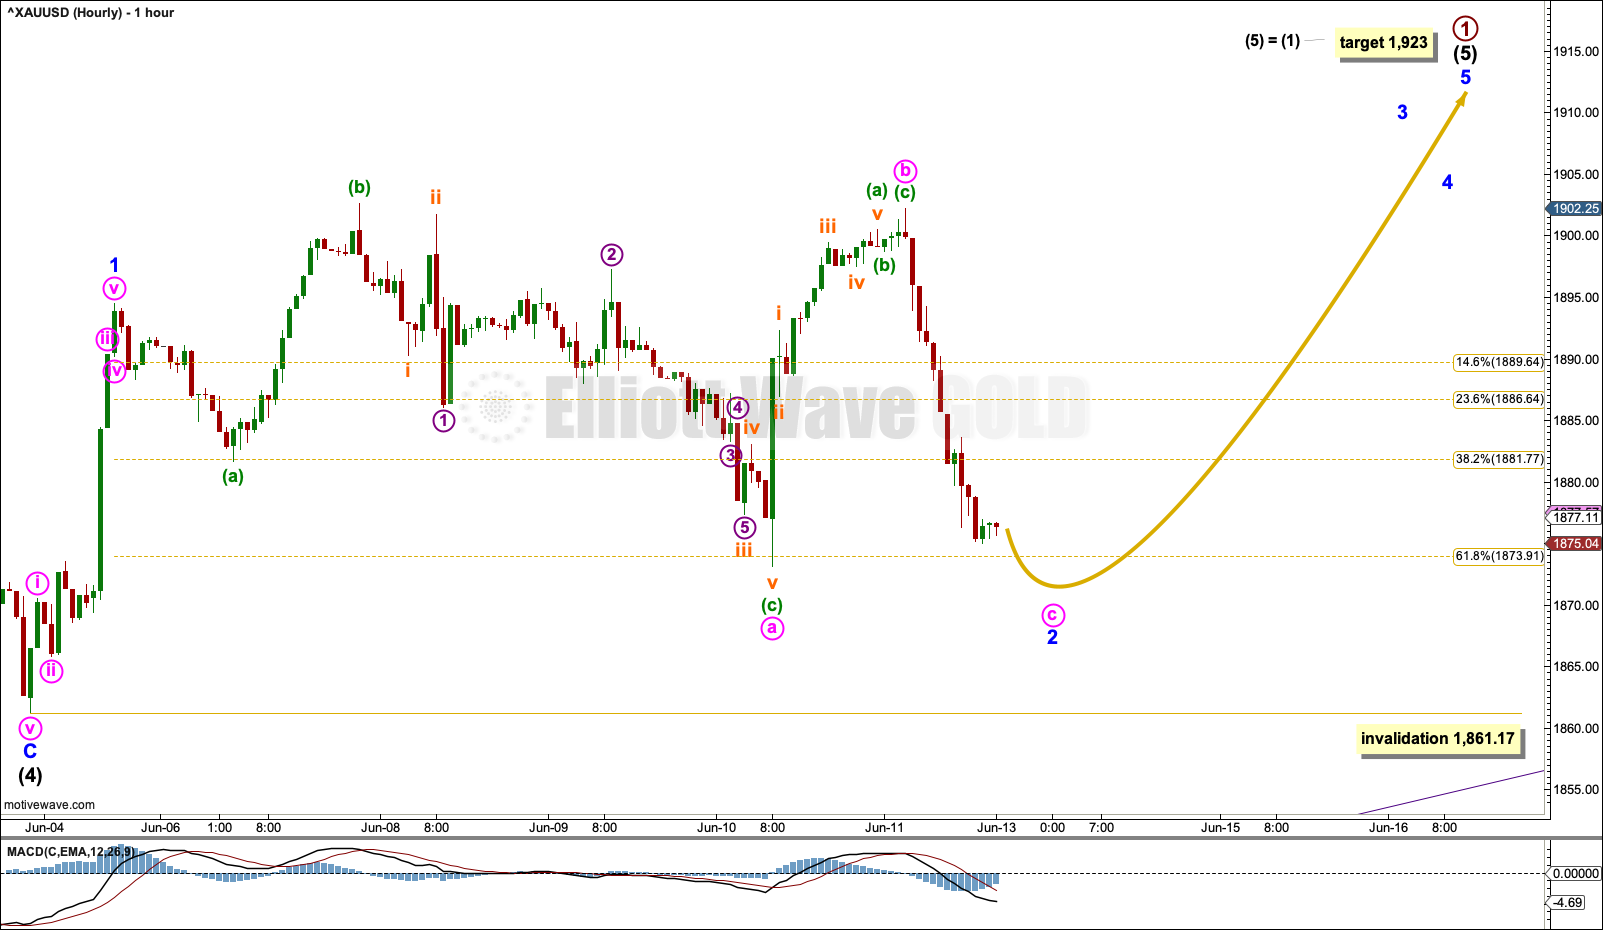
Intermediate wave (5) may have begun.
Intermediate wave (5) may continue for a few more sessions. The target calculated expects intermediate wave (5) to exhibit the most common Fibonacci ratio to intermediate wave (1).
Minor wave 2 may be continuing further as an expanded flat.
Minute wave c within the expanded flat would be likely to make at least a slight new low below the end of minute wave a at 1,873.13 to avoid a truncation and a very rare running flat.
Minor wave 2 may not move beyond the start of minor wave 1 below 1,861.17.
ALTERNATE ELLIOTT WAVE COUNT
WEEKLY CHART
Click chart to enlarge.
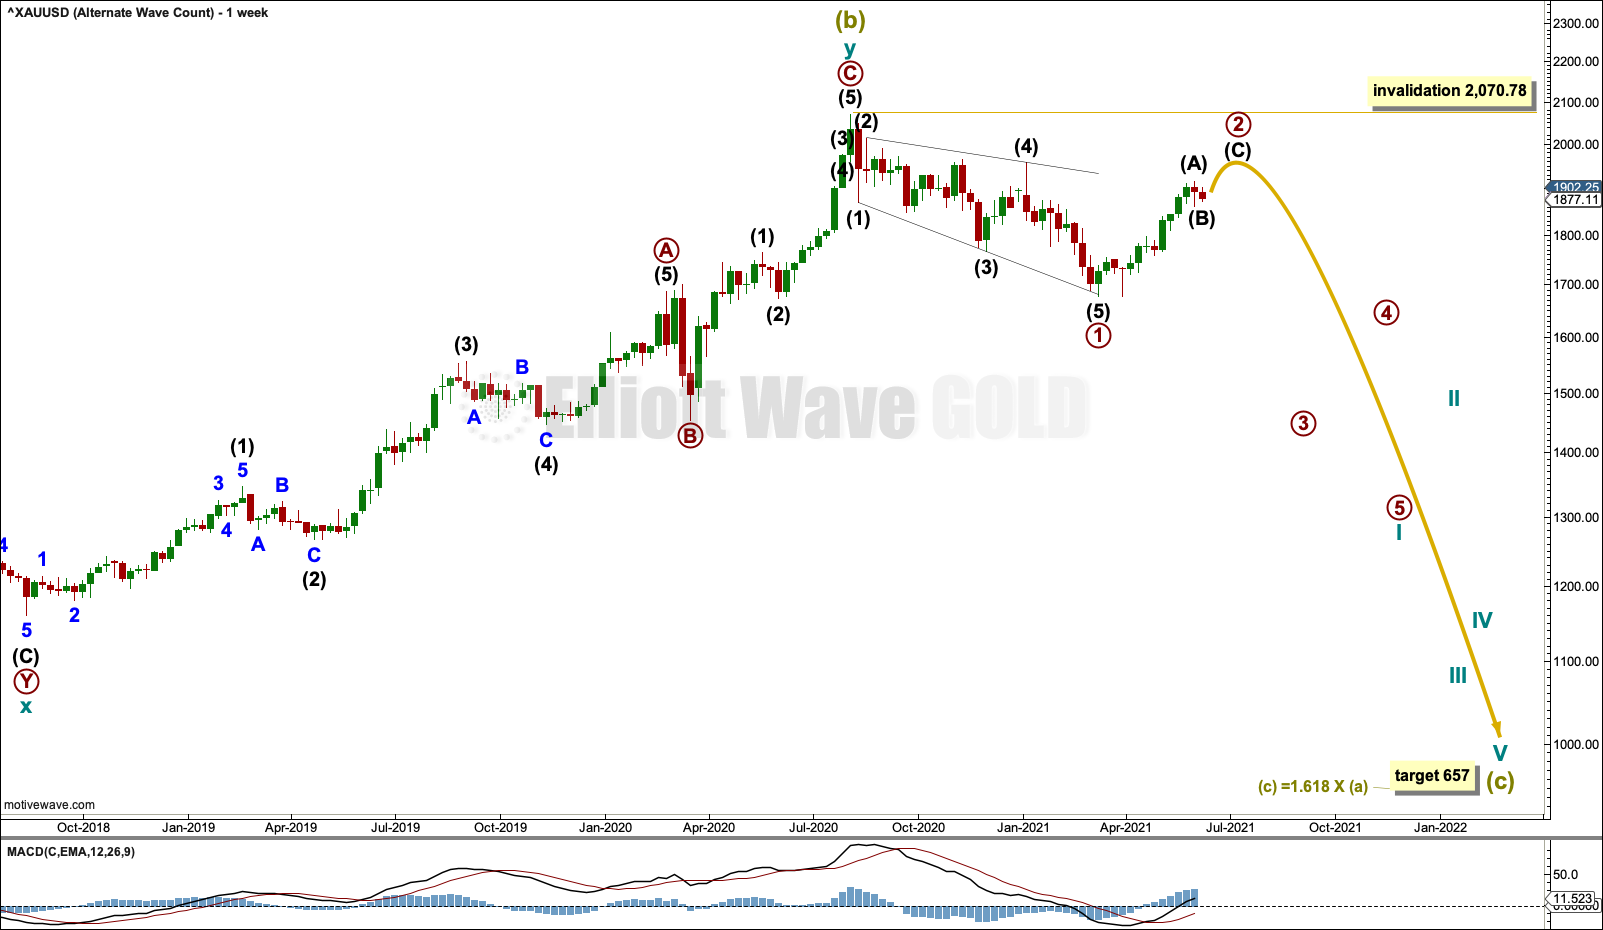
The bigger picture for this alternate Elliott wave count sees Gold as within a bear market, in a three steps back pattern that is labelled Grand Super Cycle wave IV on monthly charts. Grand Super Cycle wave IV may be subdividing as an expanded flat pattern.
Super Cycle wave (b) within Grand Super Cycle wave IV may be a complete double zigzag. This wave count expects Super Cycle wave (c) to move price below the end of Super Cycle wave (a) at 1,046.27 to avoid a truncation and a very rare running flat. The target calculated expects a common Fibonacci ratio for Super Cycle wave (c).
Super Cycle wave (c) may have begun with a leading expanding diagonal for primary wave 1. Leading expanding diagonals in first wave positions are uncommon, so the probability of this wave count is reduced. However, it has a good fit and must be considered.
Second wave corrections to follow leading diagonals in first wave positions are usually very deep. Primary wave 2 may be expected to end at least about the 0.618 Fibonacci ratio at 1,920.42, and more likely a reasonable amount deeper than that. Primary wave 2 may not move beyond the start of primary wave 1 above 2,070.78.
DAILY CHART
Click chart to enlarge.
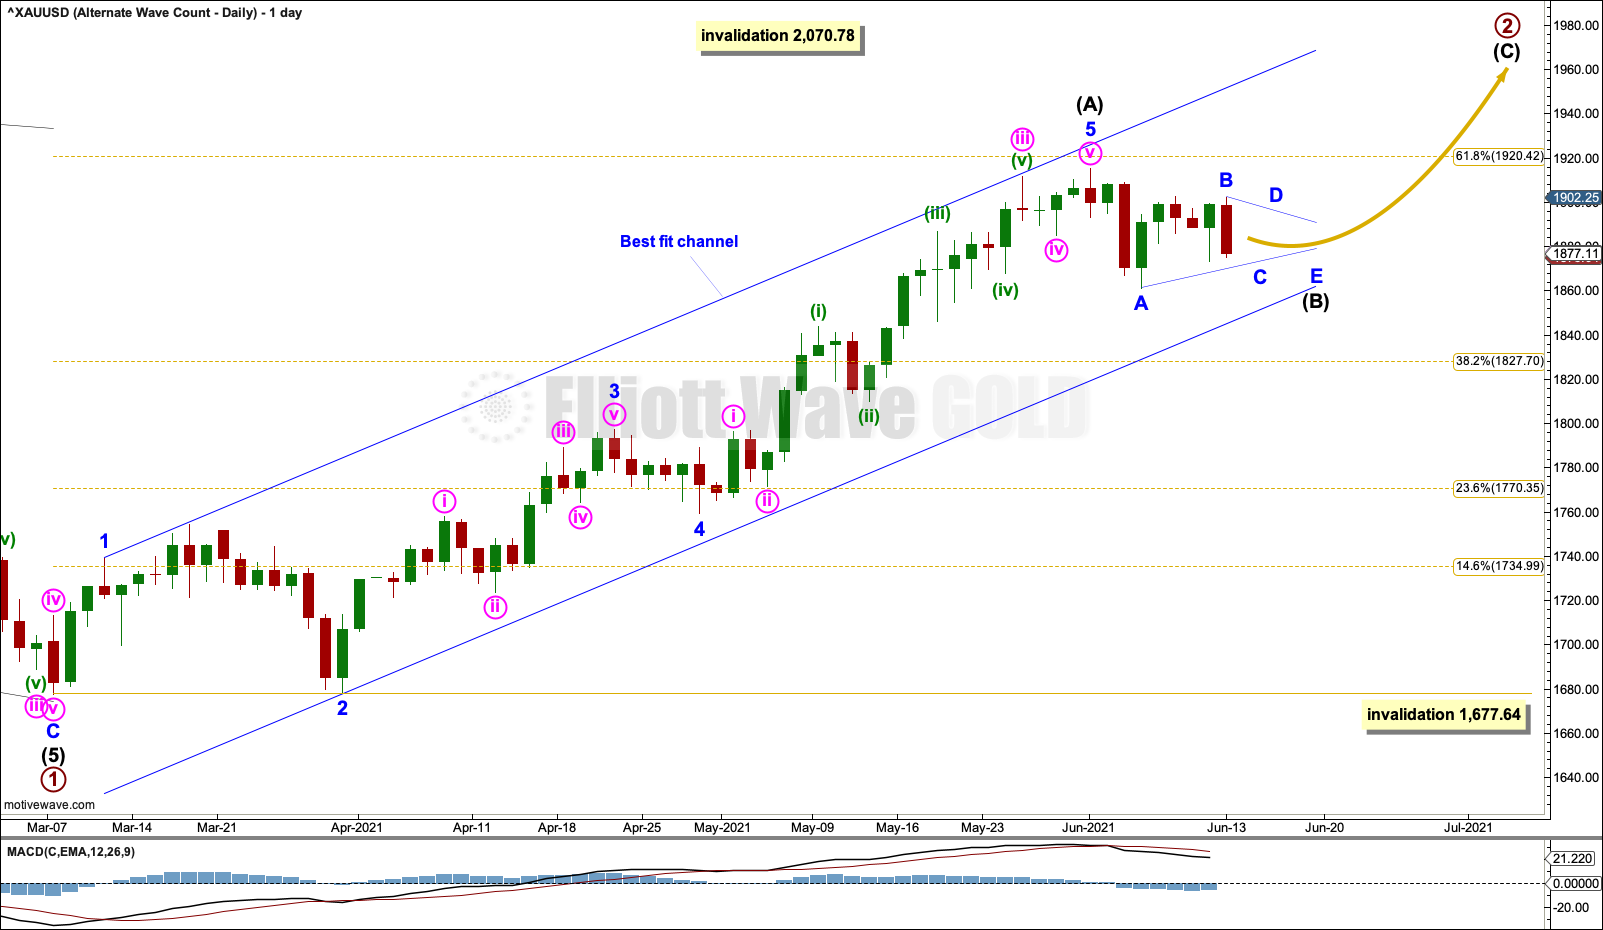
This week the wave count within primary wave 2 is changed.
Primary wave 2 may be subdividing as a zigzag. Within the zigzag: Intermediate wave (A) may be complete at the last high, and intermediate wave (B) may continue sideways as a triangle, combination or flat, or it may also continue lower as a zigzag.
A best fit channel is drawn about intermediate wave (A). Intermediate wave (B) may be contained within this channel, but it may also breach the lower edge. In the first instance look for support at the lower edge.
If intermediate wave (A) is correctly analysed as a five, then intermediate wave (B) may not move beyond its start below 1,677.64.
TECHNICAL ANALYSIS
WEEKLY CHART

Click chart to enlarge. Chart courtesy of StockCharts.com.
The upwards trend may have ended, for now. There is now a bearish candlestick reversal pattern in a Hanging Man that has bearish confirmation in the following candlestick.
DAILY CHART
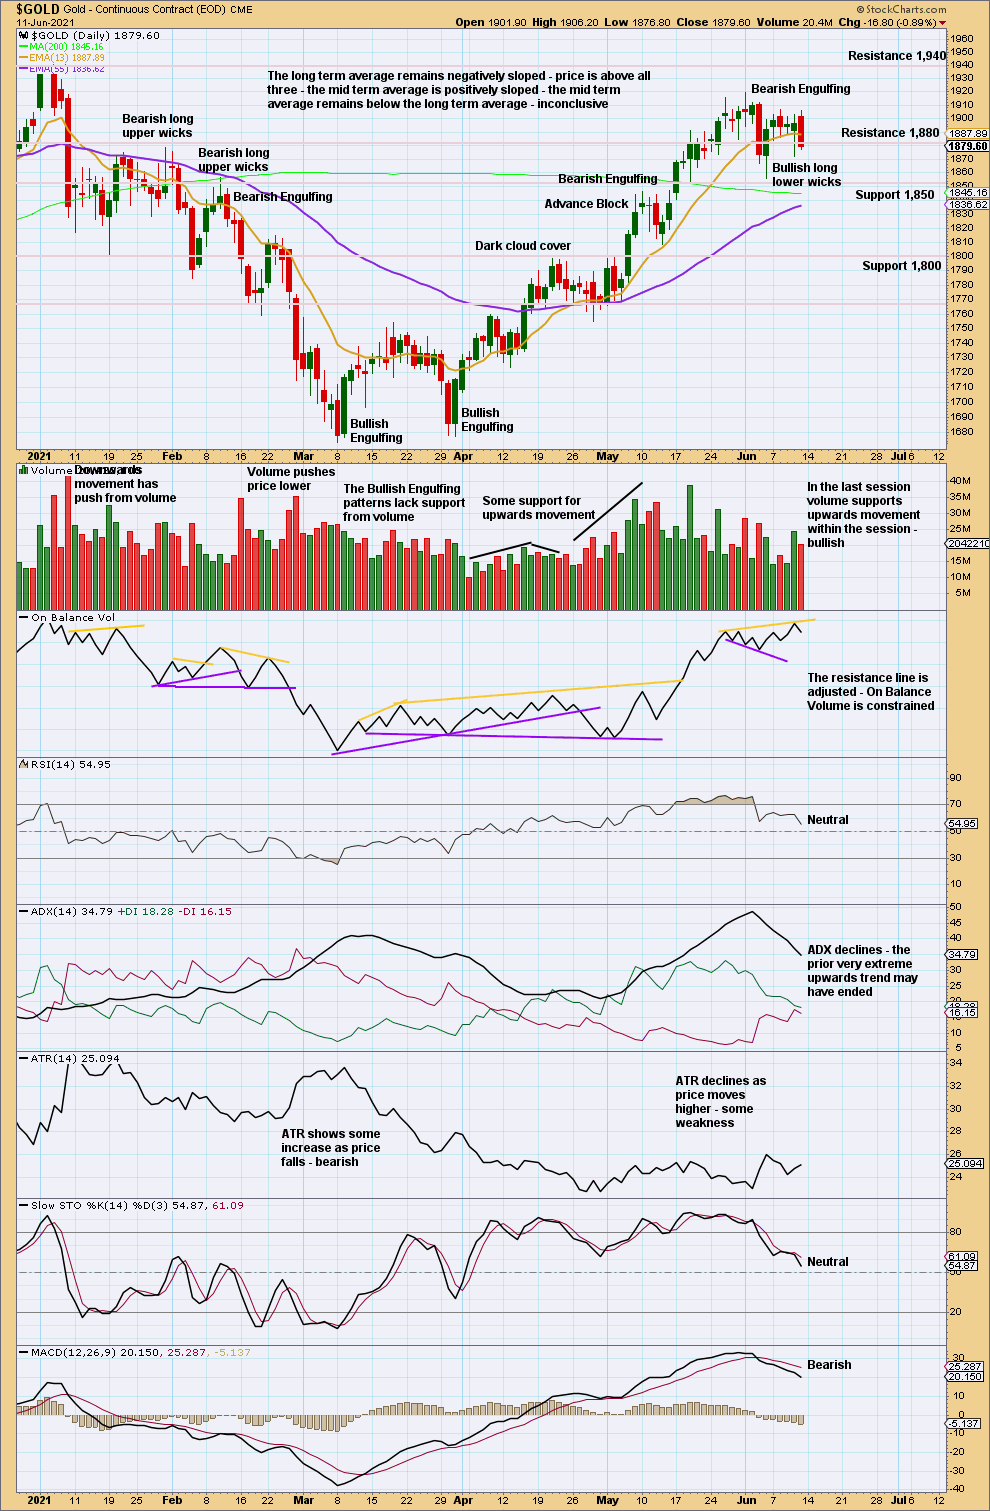
Click chart to enlarge. Chart courtesy of StockCharts.com.
Price is consolidating with resistance about 1,912 and support about 1,855. The prior upwards trend reached very extreme. The consolidation may continue until the ADX line is below the DX lines, RSI is further into neutral territory, and Stochastics reaches oversold.
GDX WEEKLY CHART
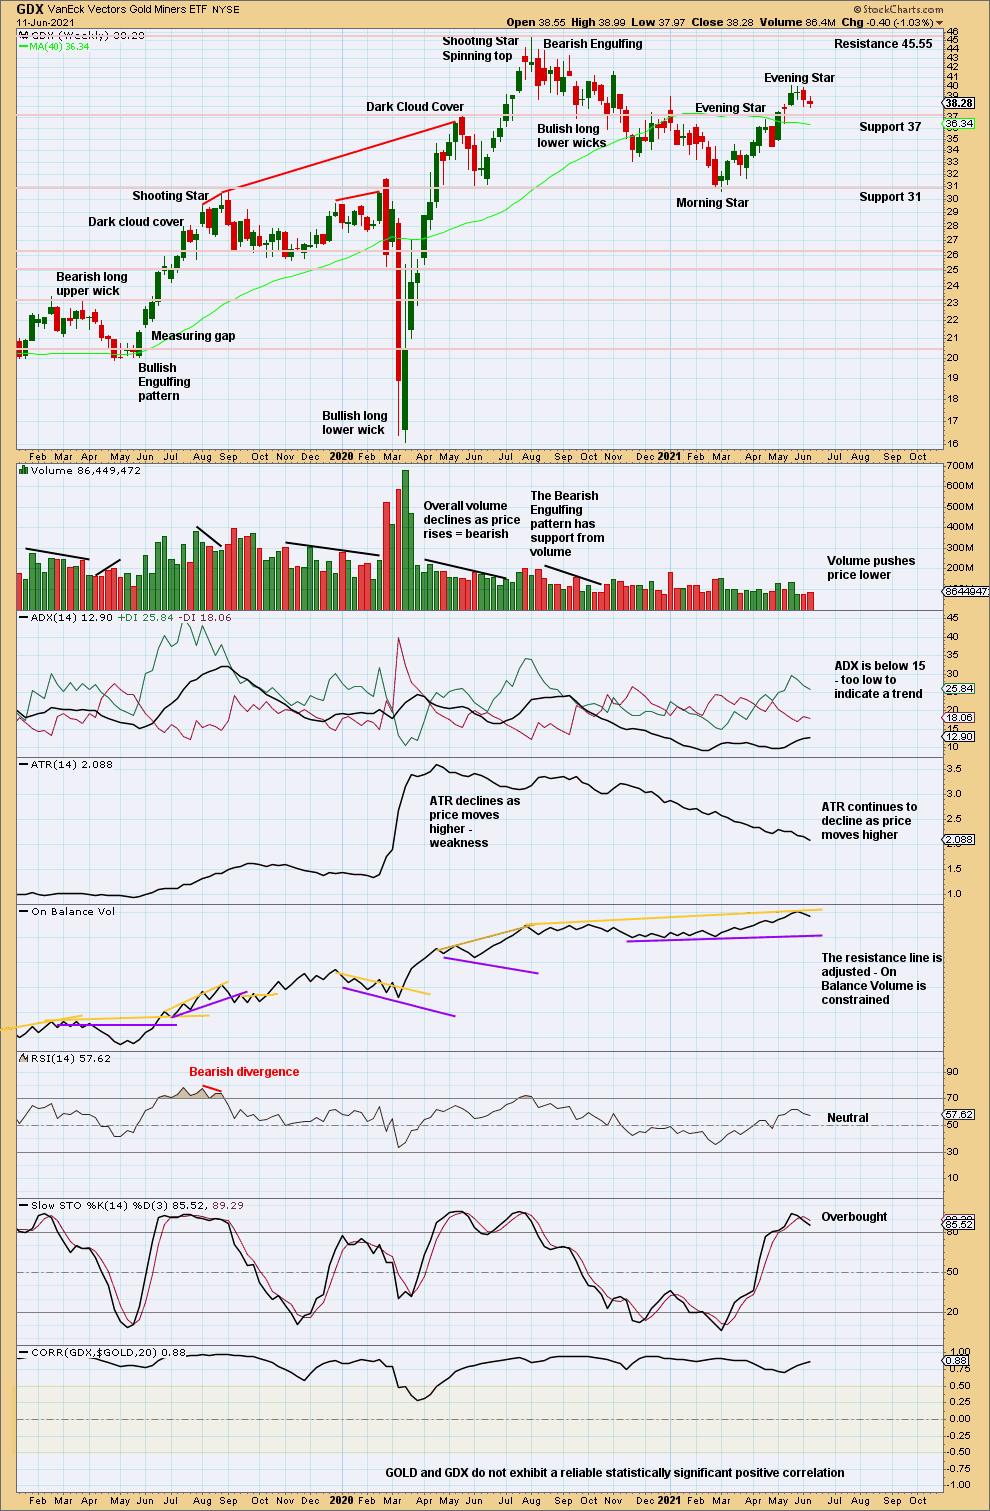
Click chart to enlarge. Chart courtesy of StockCharts.com.
Next resistance is at 45.55.
An Evening Doji Star is now followed by another red candlestick that has some support from volume. This is bearish.
GDX DAILY CHART
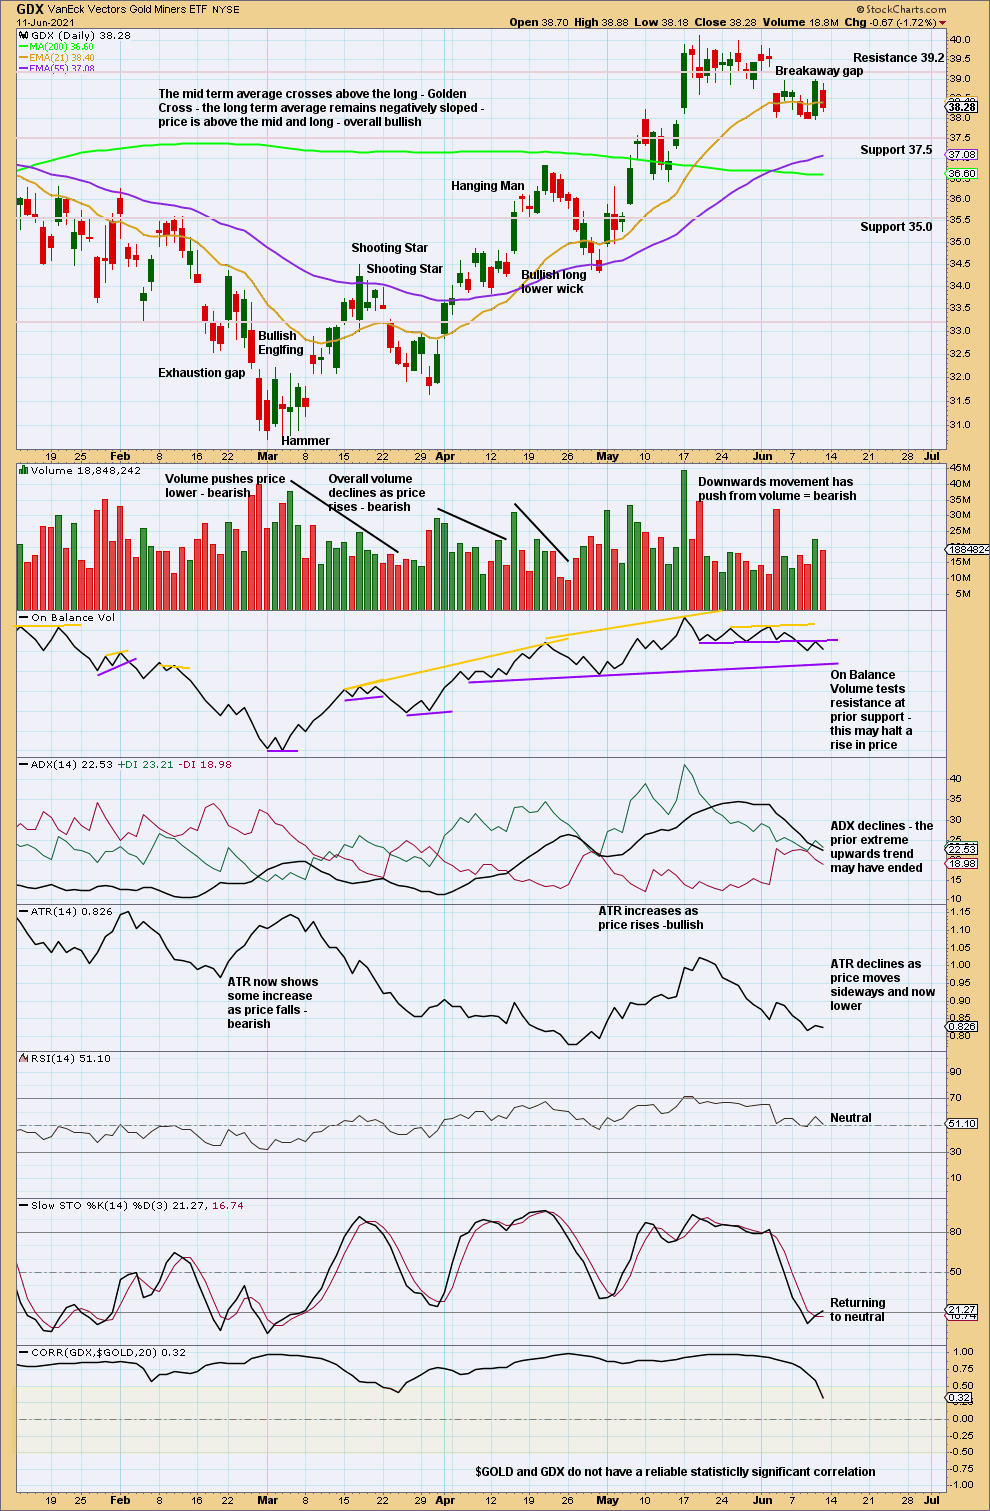
Click chart to enlarge. Chart courtesy of StockCharts.com.
The breakaway gap at 39.34 may offer resistance. If the gap at 39.34 is closed and if On Balance Volume breaks above resistance, then confidence in the upwards trend resuming may be had.
Published @ 07:28 p.m. ET.
—
Careful risk management protects your trading account(s).
Follow my two Golden Rules:
1. Always trade with stops.
2. Risk only 1-5% of equity on any one trade.
—
New updates to this analysis are in bold.
—