
GOLD: Elliott Wave and Technical Analysis | Charts – June 18, 2021
Two Elliott wave counts are used at the end of this week.
Summary: The main wave count expects a final low may be about 1,760. The upwards trend may then resume. A new low below 1,677.64 would see this main wave count invalidated and most likely discarded.
An alternate wave count is very bearish, a target is at 887. A new low below 1,677.64 would provide some confidence in this wave count.
Grand SuperCycle analysis and last monthly charts are here.
MAIN ELLIOTT WAVE COUNT
WEEKLY CHART
Click chart to enlarge.
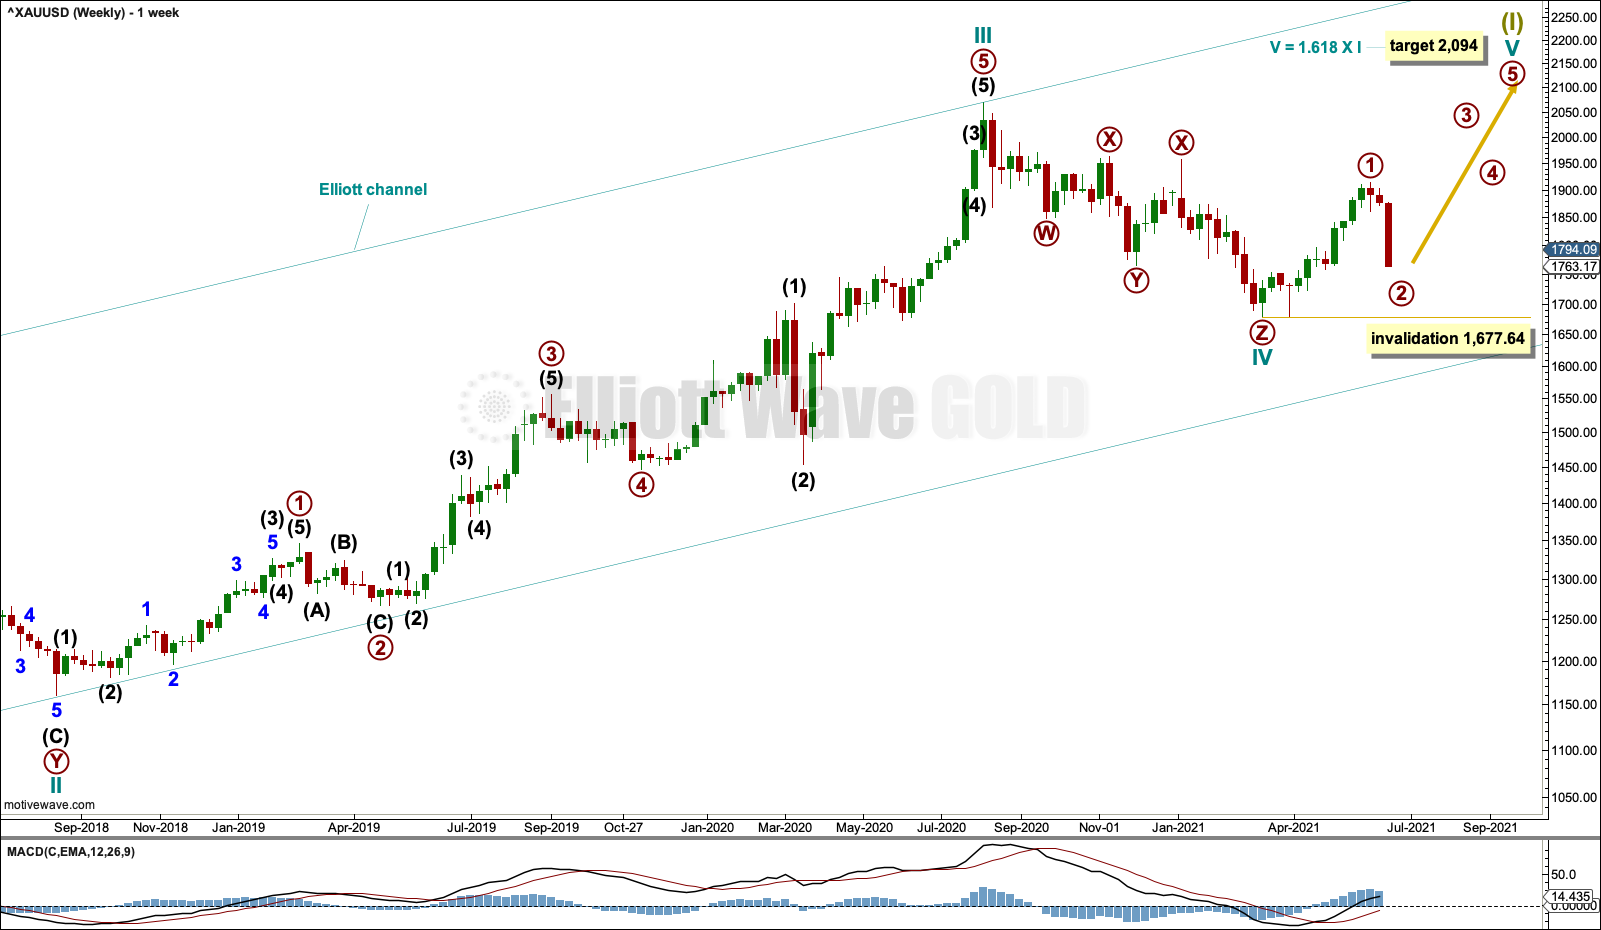
This wave count sees the the bear market complete at the last major low for Gold on 3 December 2015.
If Gold is in a new bull market, then it should begin with a five wave structure upwards on the weekly chart.
Cycle wave I fits as a five wave impulse with reasonably proportionate corrections for primary waves 2 and 4.
Cycle wave II fits as a double flat. However, within the first flat correction labelled primary wave W, this wave count needs to ignore what looks like an obvious triangle from July to September 2016 (this can be seen labelled as a triangle on the second weekly chart on prior analysis here). This movement must be labelled as a series of overlapping first and second waves. Ignoring this triangle reduces the probability of this wave count in Elliott wave terms.
Cycle wave IV may be a complete triple zigzag. Triple zigzags are not rare structures, but they are not common. The probability of this wave count is further reduced in Elliott wave terms. This is one reason why an alternate is still considered.
Cycle wave V may have begun. Within cycle wave V: Primary wave 1 may be over at the last high, and primary wave 2 may not move beyond the start of primary wave 1 below 1,677.64.
DAILY CHART
Click chart to enlarge.
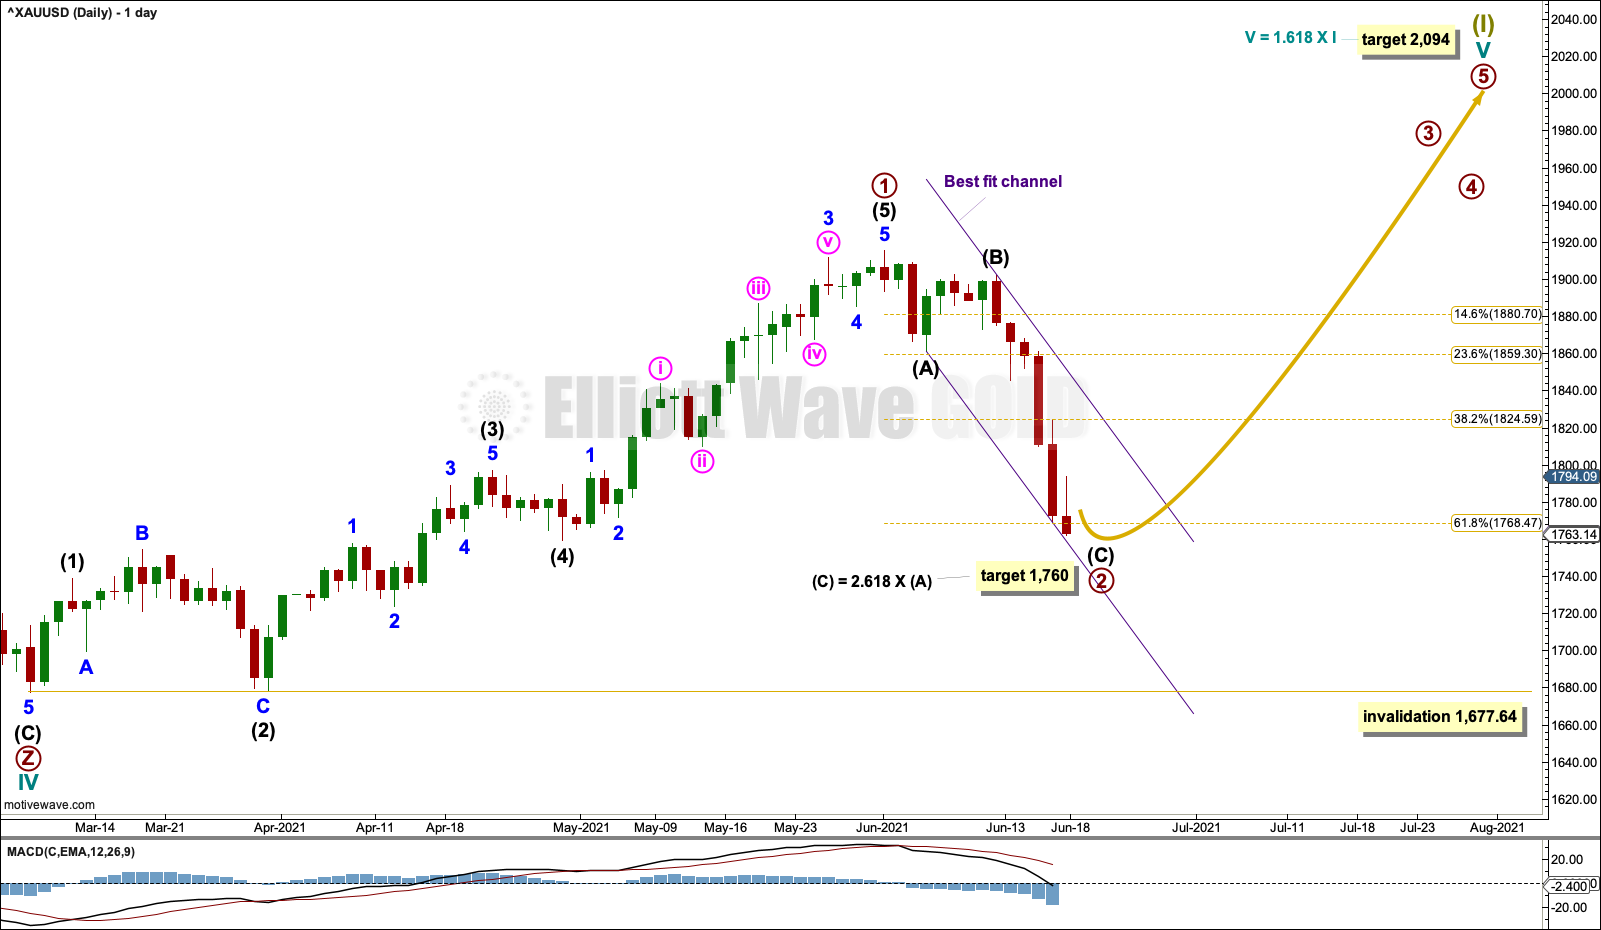
A target is calculated for cycle wave V. If this target is wrong for this wave count, then it may be too low. As price approaches the target, if the structure is incomplete, then a higher target may be calculated.
Primary wave 1 within cycle wave V may be complete.
Primary wave 2 may be expected to most likely be a deep pullback lasting weeks. A target for it is at 1,760.
Primary wave 2 may not move beyond the start of primary wave 1 below 1,677.64.
HOURLY CHART
Click chart to enlarge.
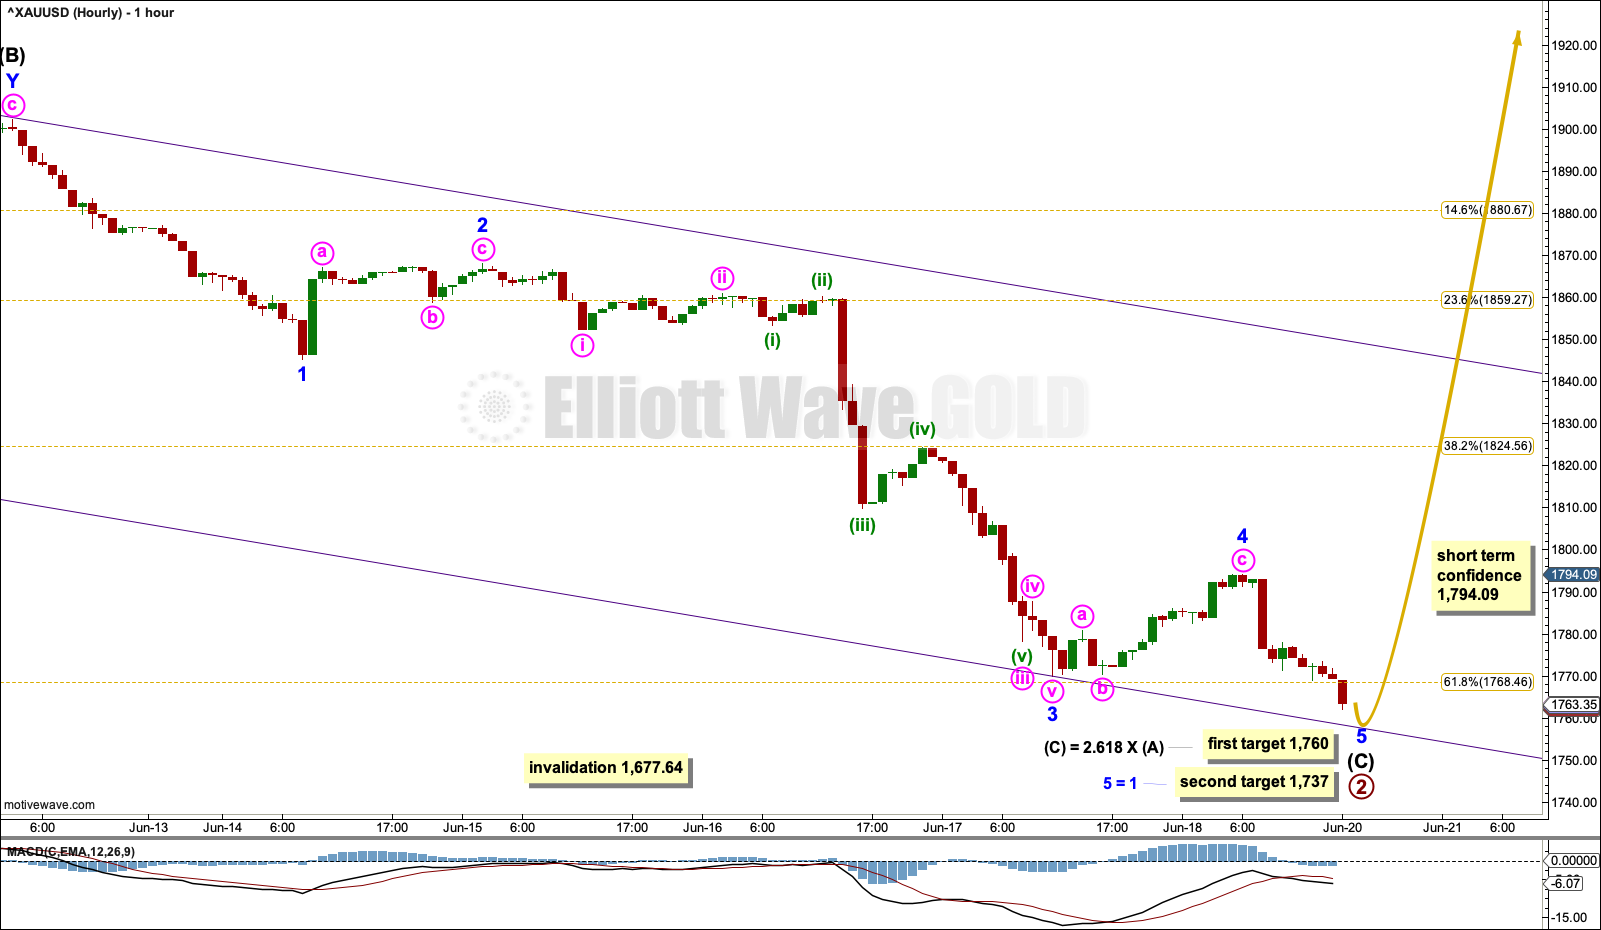
Primary wave 2 may be almost complete and may be subdividing as a zigzag, which is by a wide margin the most common Elliott wave structure for a second wave.
Intermediate wave (C) may be an almost complete zigzag. Minor wave 3 within intermediate wave (C) is 6.11 longer than 1.618 the length of minor wave 1.
Intermediate wave (C) has passed equality in length and 1.618 the length of intermediate wave (A). The next Fibonacci ratio in the sequence is used to calculate a target. If price reaches this target and keeps falling, then the next target would be at 1,737 where minor wave 5 would reach equality in length with minor wave 1.
A new high above 1,794.09, which is the start of minor wave 5, could not be a second wave correction within minor wave 5; at that stage, minor wave 5 should be over. This may indicate a trend change.
ALTERNATE ELLIOTT WAVE COUNT
WEEKLY CHART
Click chart to enlarge.
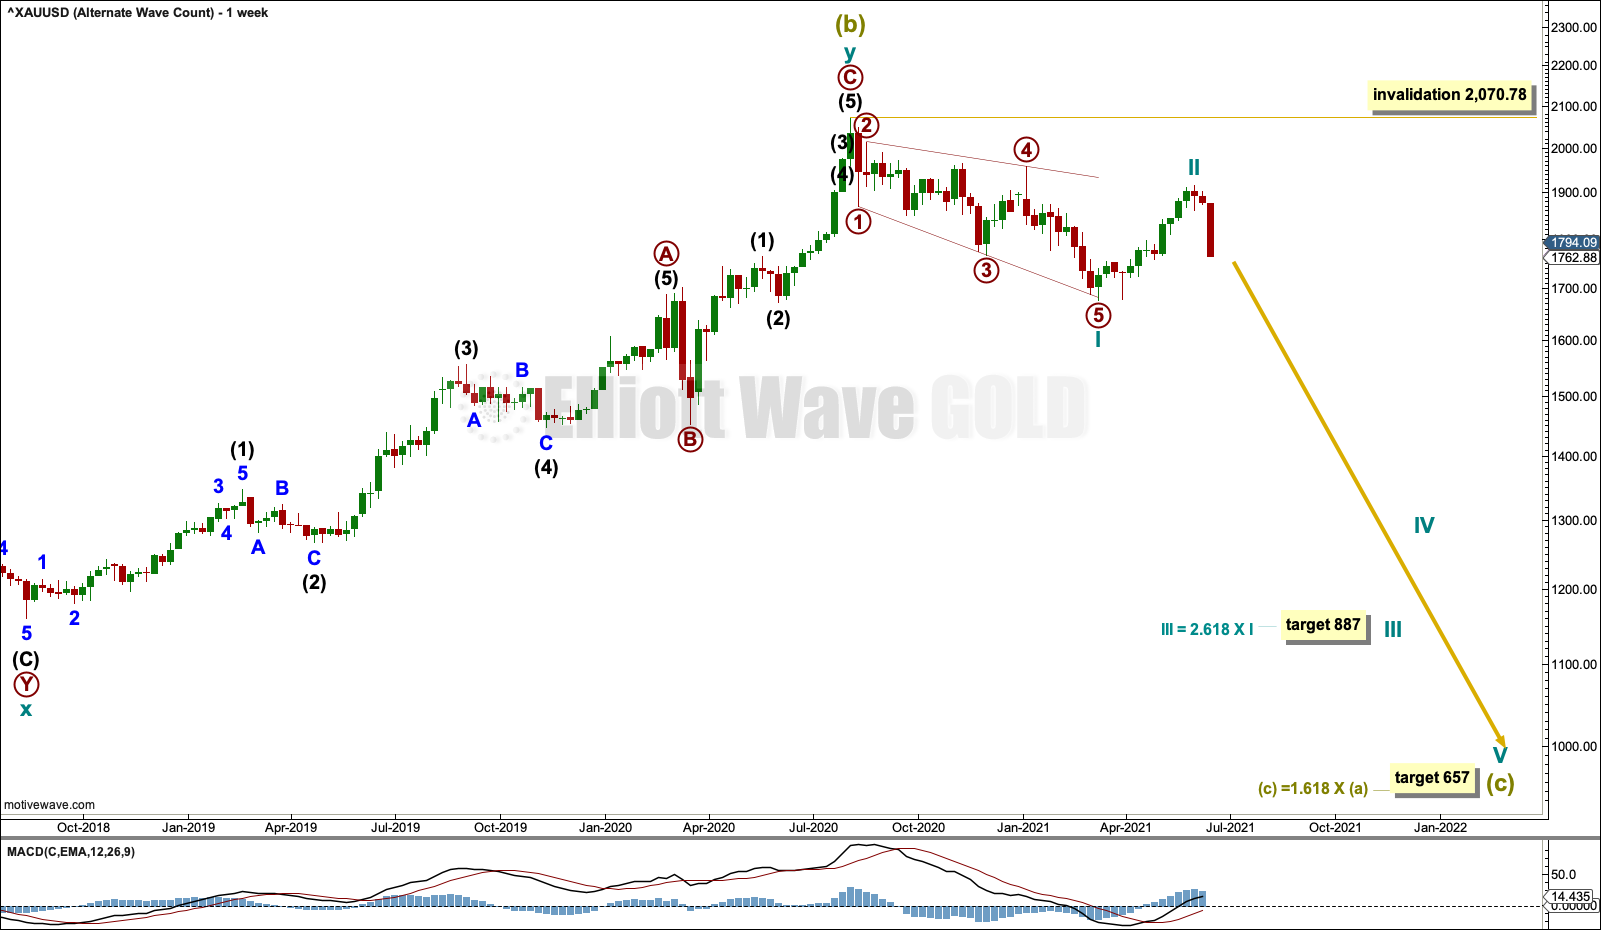
The bigger picture for this alternate Elliott wave count sees Gold as within a bear market, in a three steps back pattern that is labelled Grand Super Cycle wave IV on monthly charts. Grand Super Cycle wave IV may be subdividing as an expanded flat pattern.
Super Cycle wave (b) within Grand Super Cycle wave IV may be a complete double zigzag. This wave count expects Super Cycle wave (c) to move price below the end of Super Cycle wave (a) at 1,046.27 to avoid a truncation and a very rare running flat. The target calculated expects a common Fibonacci ratio for Super Cycle wave (c).
Super Cycle wave (c) may have begun with a leading expanding diagonal for cycle wave I. Leading expanding diagonals in first wave positions are uncommon, so the probability of this wave count is reduced. However, it has a good fit and must be considered.
Second wave corrections to follow leading diagonals in first wave positions are usually very deep. Cycle wave II is deep and the structure may be complete; so far it is following a common pattern. If it continues higher, then cycle wave II may not move beyond the start of cycle wave I above 2,070.78.
DAILY CHART
Click chart to enlarge.
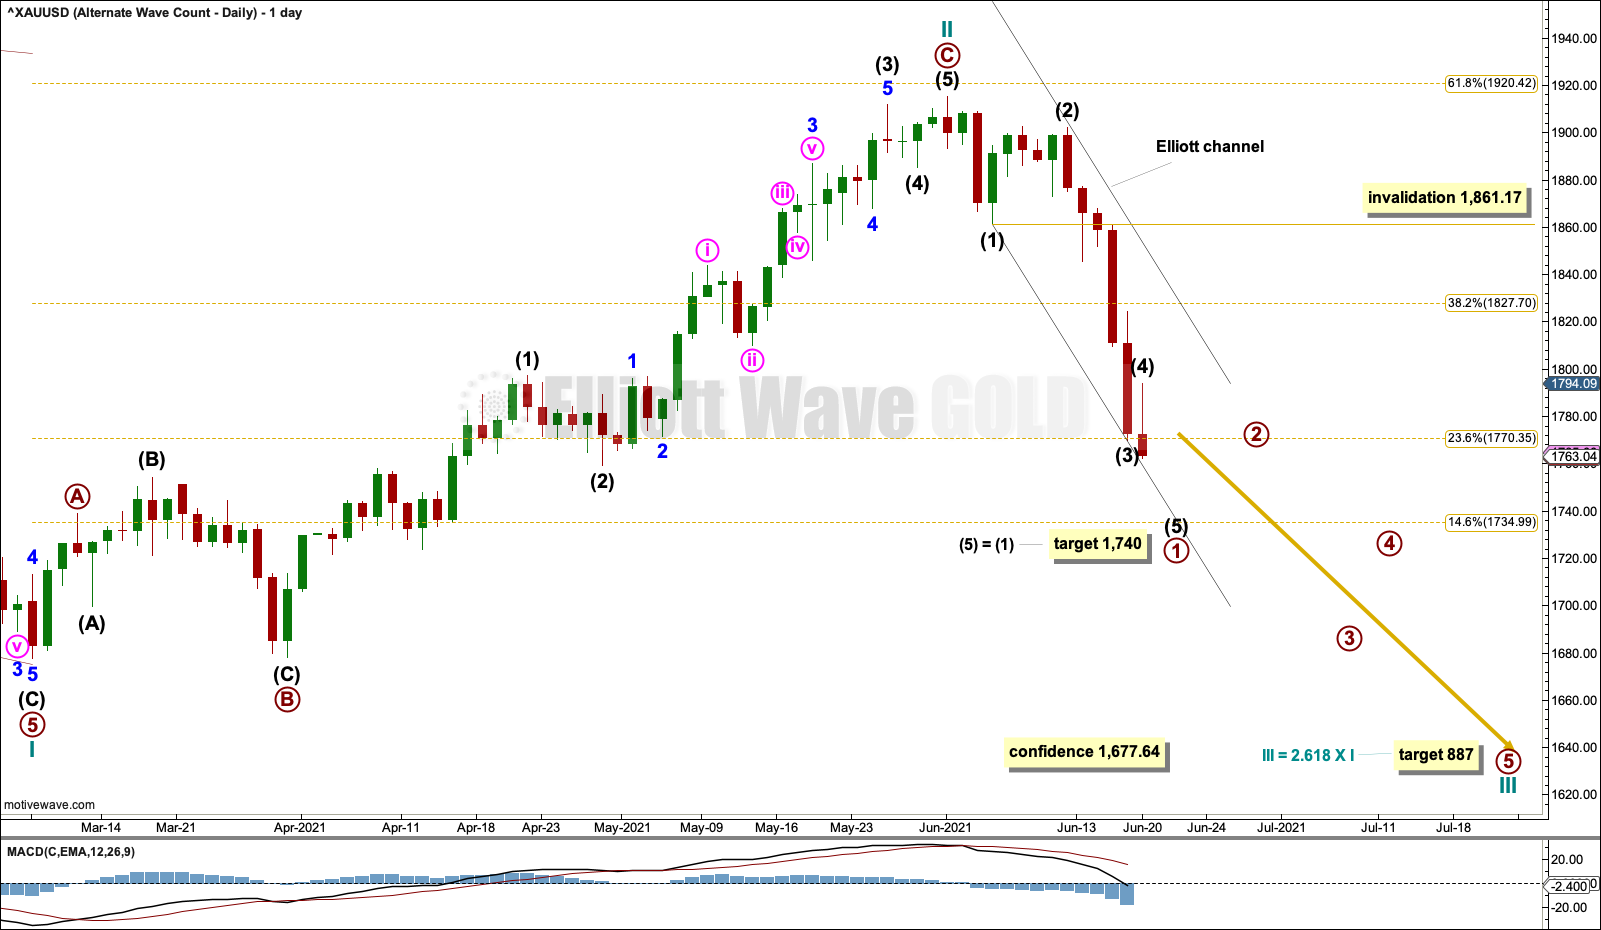
Current strong downwards movement may be the very early stages of cycle wave III. A target is calculated for cycle wave III.
Primary wave 1 within cycle wave III may be nearing an end. If intermediate wave (4) within primary wave 1 continues higher, then it may not move into intermediate wave (1) price territory above 1,861.17.
Draw an Elliott channel about primary wave 1. When this channel is breached by upwards movement, then that may be used as an indication that primary wave 1 should be over and primary wave 2 may then be underway.
HOURLY CHART
Click chart to enlarge.
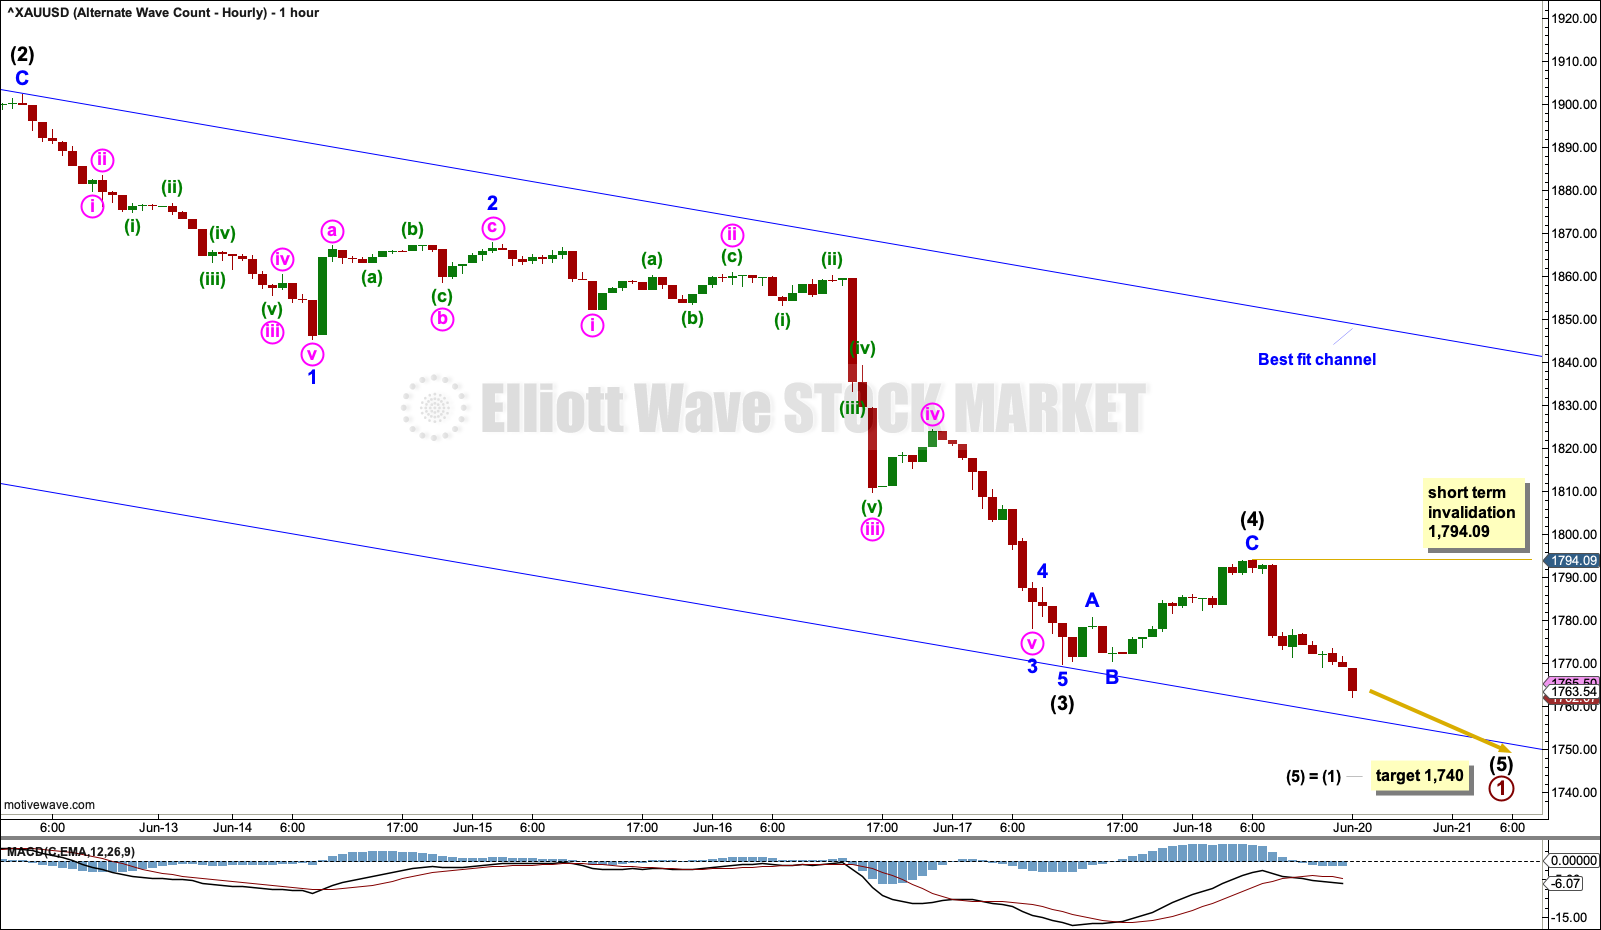
Intermediate wave (3) is 9.66 short of 2.618 the length of intermediate wave (1). The target for intermediate wave (5) expects it to exhibit a common Fibonacci ratio to intermediate wave (1).
Within intermediate wave (5), no second wave correction may move beyond its start above 1,794.09.
TECHNICAL ANALYSIS
WEEKLY CHART
Click chart to enlarge. Chart courtesy of StockCharts.com.
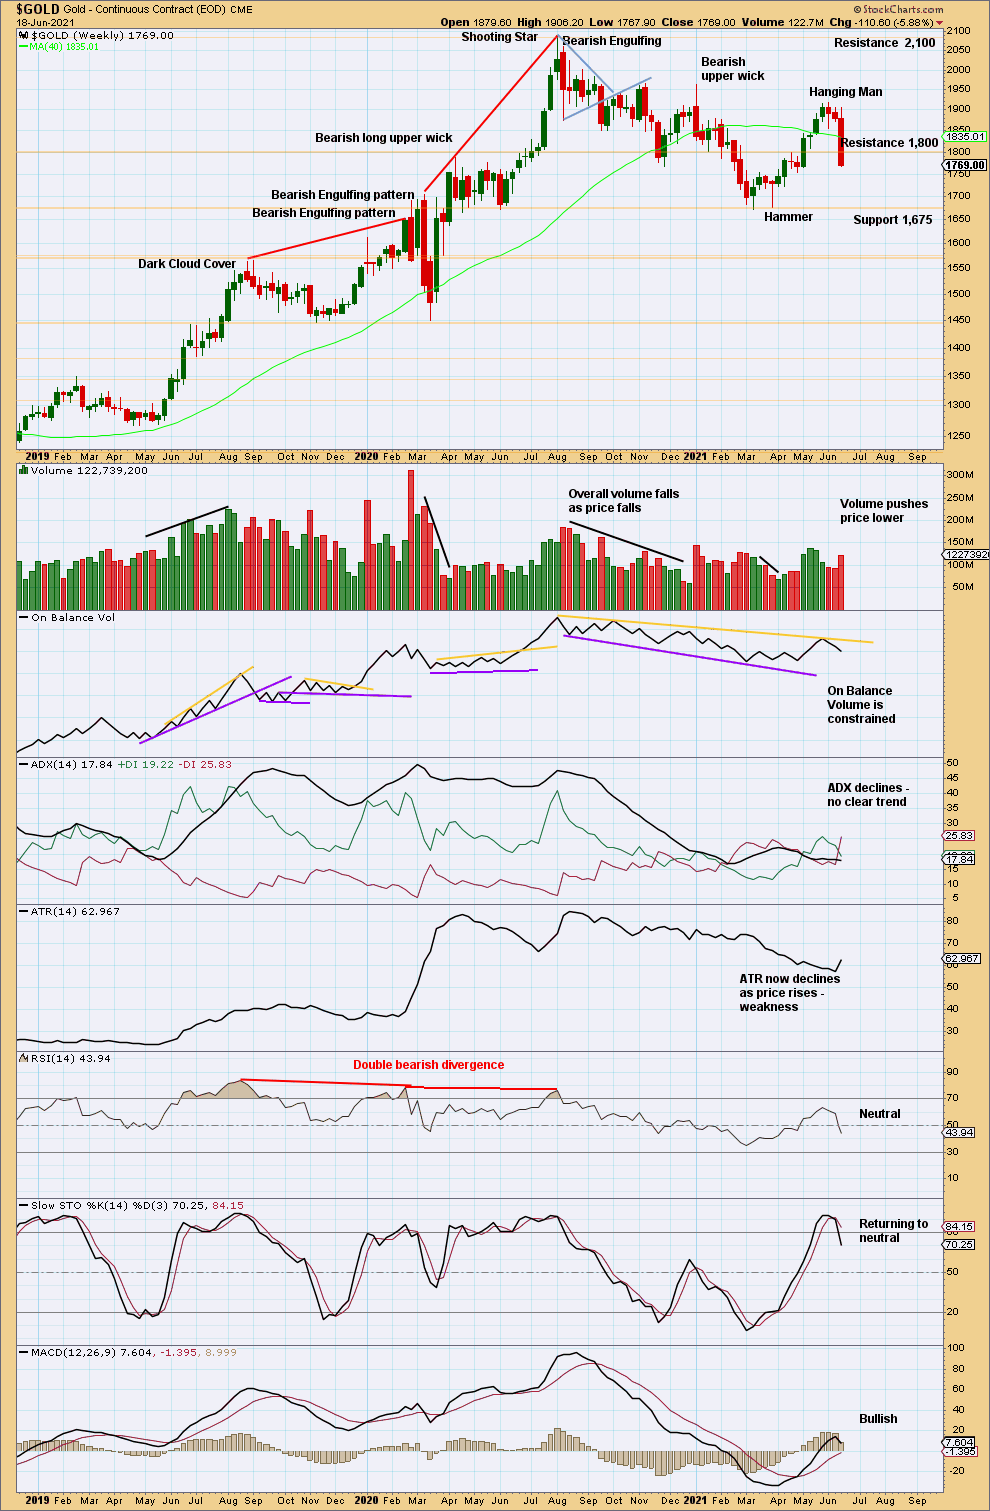
The upwards trend may have ended, for now. There is now a bearish candlestick reversal pattern in a Hanging Man that has bearish confirmation in the following candlestick.
Now a strong downwards week closes near the low. This suggests more downwards movement next week.
DAILY CHART
Click chart to enlarge. Chart courtesy of StockCharts.com.
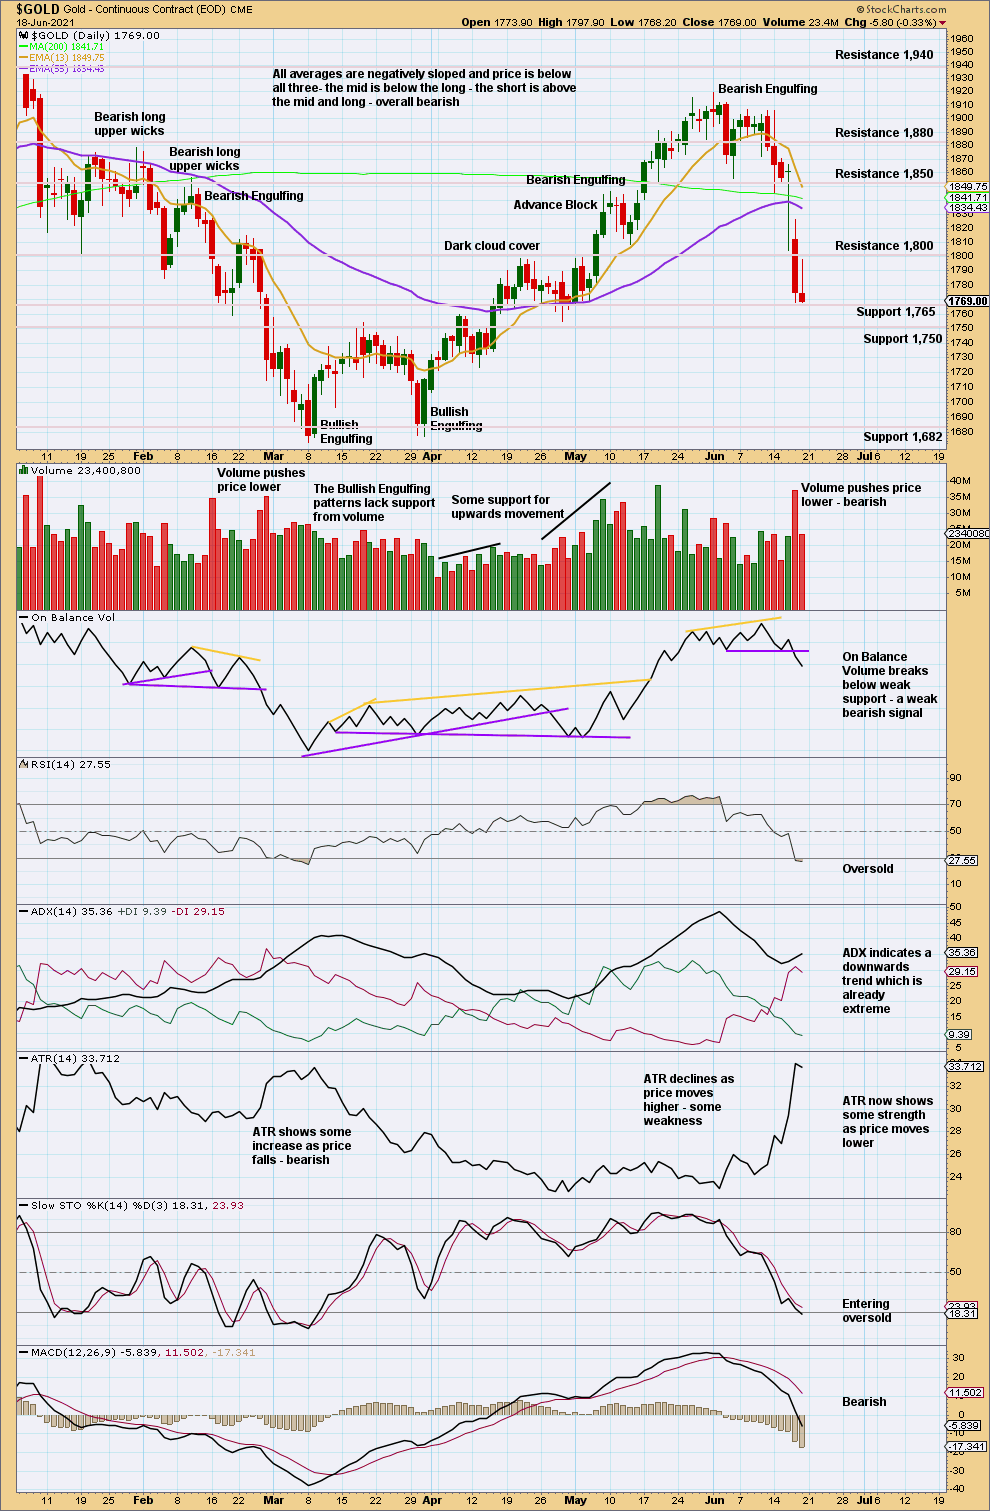
If next support about 1,765 is breached, then this downwards movement may end about 1,750.
The small real body on the last candlestick suggests some weakness, but the long upper wick and close near the low is bearish. A bounce will come soon, but not quite yet.
GDX WEEKLY CHART
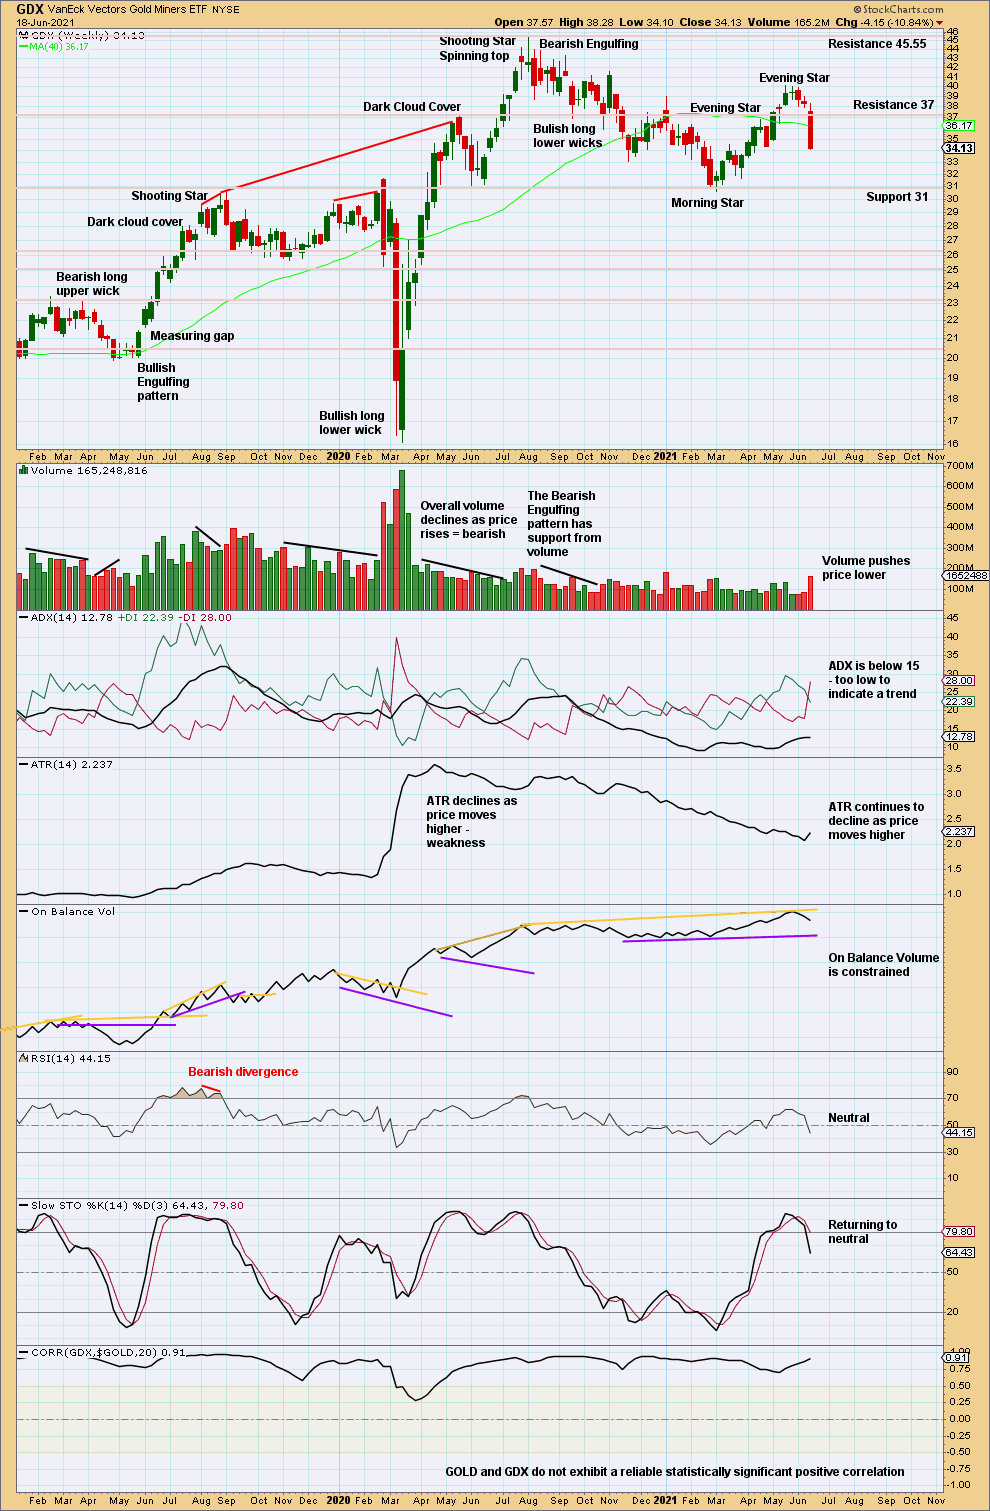
Click chart to enlarge. Chart courtesy of StockCharts.com.
A strong downwards week that has push from volume and closes new lows is bearish for next week.
GDX DAILY CHART
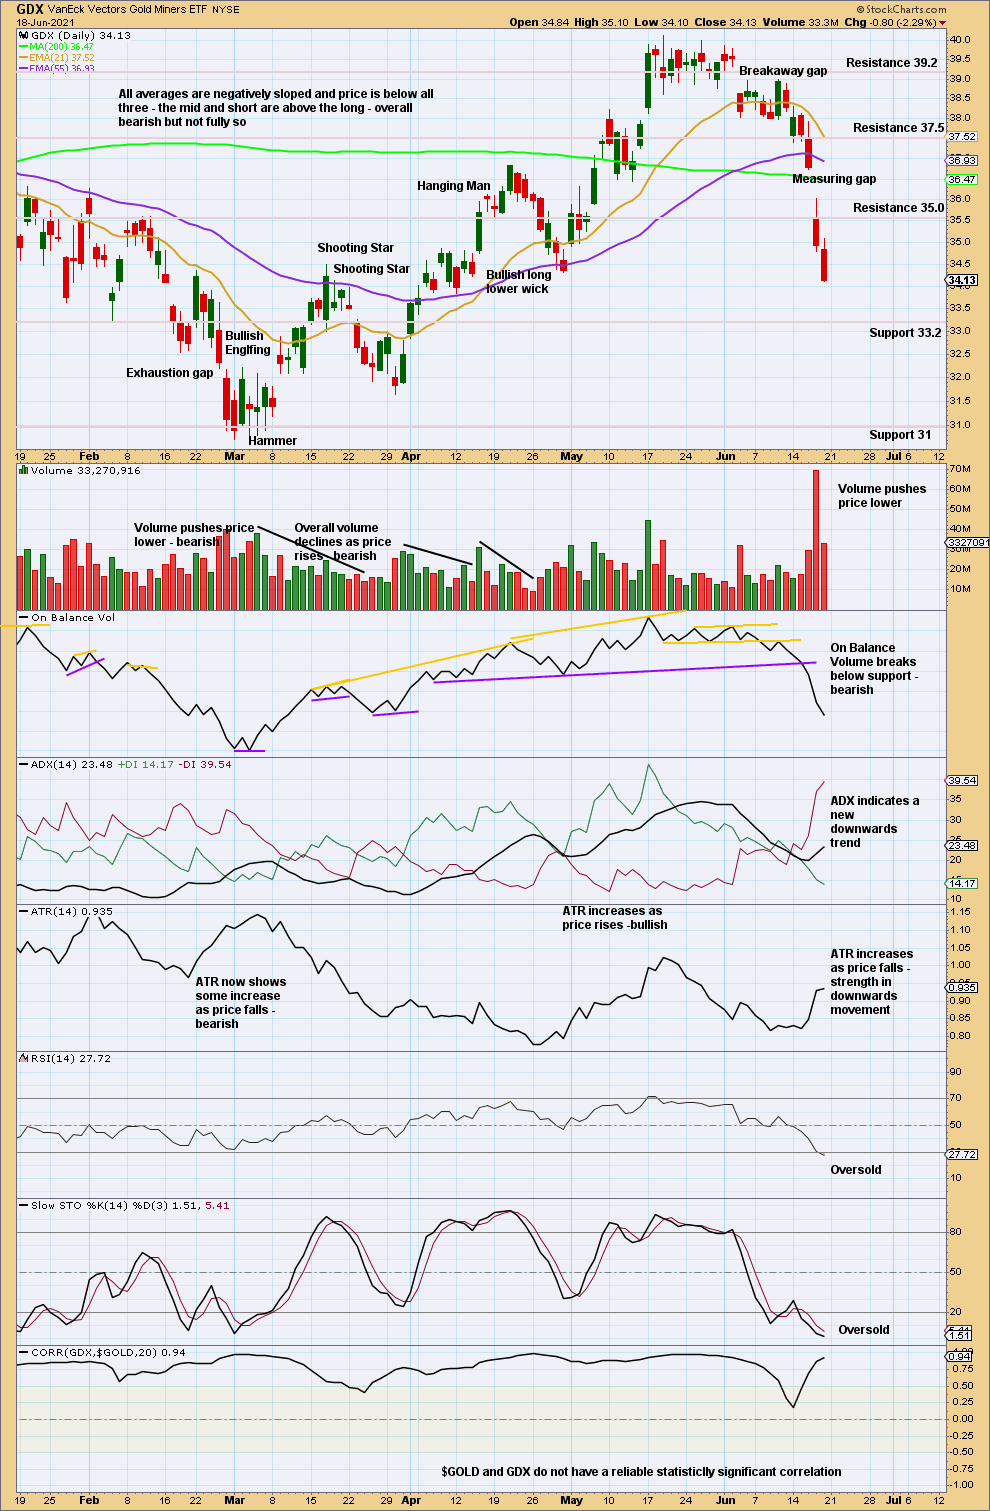
Click chart to enlarge. Chart courtesy of StockCharts.com.
The measuring gap gives a target at 33.78.
Published @ 05:57 p.m. ET.
—
Careful risk management protects your trading account(s).
Follow my two Golden Rules:
1. Always trade with stops.
2. Risk only 1-5% of equity on any one trade.
—
New updates to this analysis are in bold.
—