
GOLD: Elliott Wave and Technical Analysis | Charts – June 29, 2021
More downwards movement was expected from the alternate Elliott wave count.
A five wave impulse lower looks to be completing. This fits the alternate Elliott wave count best.
Summary: The main wave count expects the upwards trend may now resume to a new target at 2,147. A new low below 1,677.64 would see this main wave count invalidated and most likely discarded.
An alternate wave count is very bearish. A short-term target is at 1,734. After this short-term target is met (or after the channel on the daily charts is breached, whichever comes first), then a multi-week to multi-month bounce may be expected for a primary degree second wave.
A mid-term target is at 887. A new low below 1,677.64 would provide some confidence in this wave count.
Grand SuperCycle analysis and last monthly charts are here.
MAIN ELLIOTT WAVE COUNT
WEEKLY CHART

Click chart to enlarge.
This wave count sees the the bear market complete at the last major low for Gold on 3 December 2015.
If Gold is in a new bull market, then it should begin with a five wave structure upwards on the weekly chart.
Cycle wave I fits as a five wave impulse with reasonably proportionate corrections for primary waves 2 and 4.
Cycle wave II fits as a double flat. However, within the first flat correction labelled primary wave W, this wave count needs to ignore what looks like an obvious triangle from July to September 2016 (this can be seen labelled as a triangle on the second weekly chart on prior analysis here). This movement must be labelled as a series of overlapping first and second waves. Ignoring this triangle reduces the probability of this wave count in Elliott wave terms.
Cycle wave IV may be a complete triple zigzag. Triple zigzags are not rare structures, but they are not common. The probability of this wave count is further reduced in Elliott wave terms. This is one reason why an alternate is still considered.
Cycle wave V may have begun. Within cycle wave V: Primary wave 1 may be over at the last high, and primary wave 2 may not move beyond the start of primary wave 1 below 1,677.64.
DAILY CHART
Click chart to enlarge.
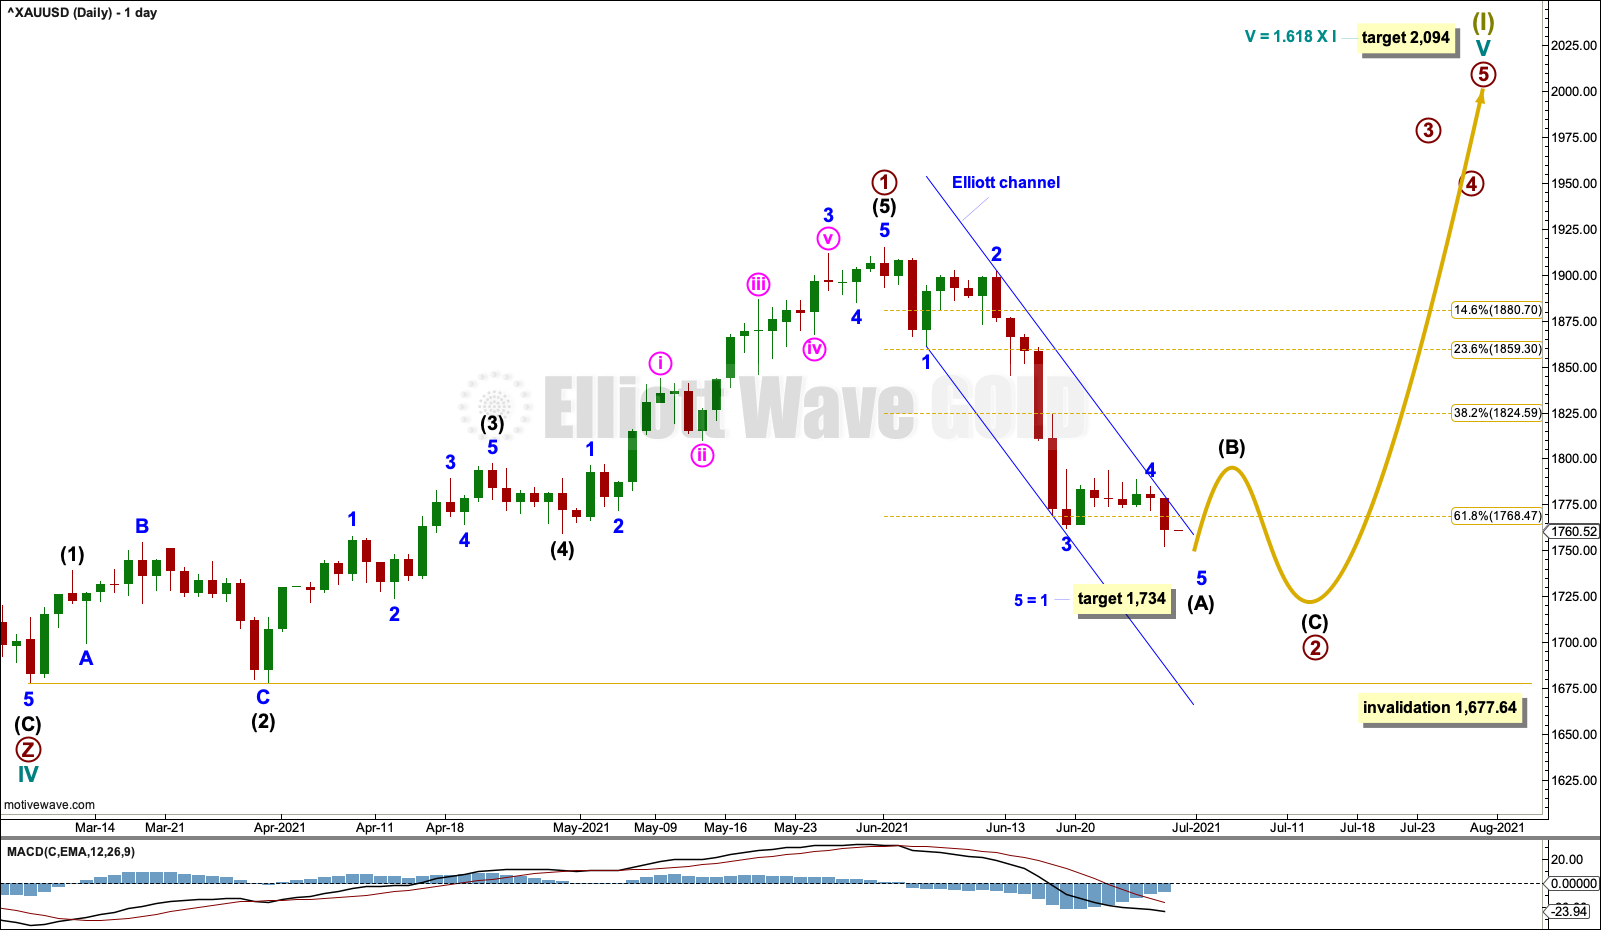
A target is calculated for cycle wave V. If this target is wrong for this wave count, then it may be too low. As price approaches the target, if the structure is incomplete, then a higher target may be calculated.
Primary wave 1 within cycle wave V may be complete.
Primary wave 2 may be an incomplete zigzag. Intermediate wave (A) within primary wave 2 may be an almost complete five wave impulse. When intermediate wave (A) may be complete, then intermediate wave (B) may unfold over a few weeks. Thereafter, intermediate wave (C) may continue lower and should make a new low below the end of intermediate wave (A) to avoid a truncation. When the end of intermediate wave (B) and the start of intermediate wave (C) is known, then the Fiboancci ratio between intermedaite waves (A) and (C) may be used to calculate a target for intermediate wave (C).
Draw an Elliott channel about intermediate wave (A). When this channel is breached by upwards movement, then it would indicate intermediate wave (B) should have arrived.
Primary wave 2 may not move beyond the start of primary wave 1 below 1,677.64.
HOURLY CHART
Click chart to enlarge.
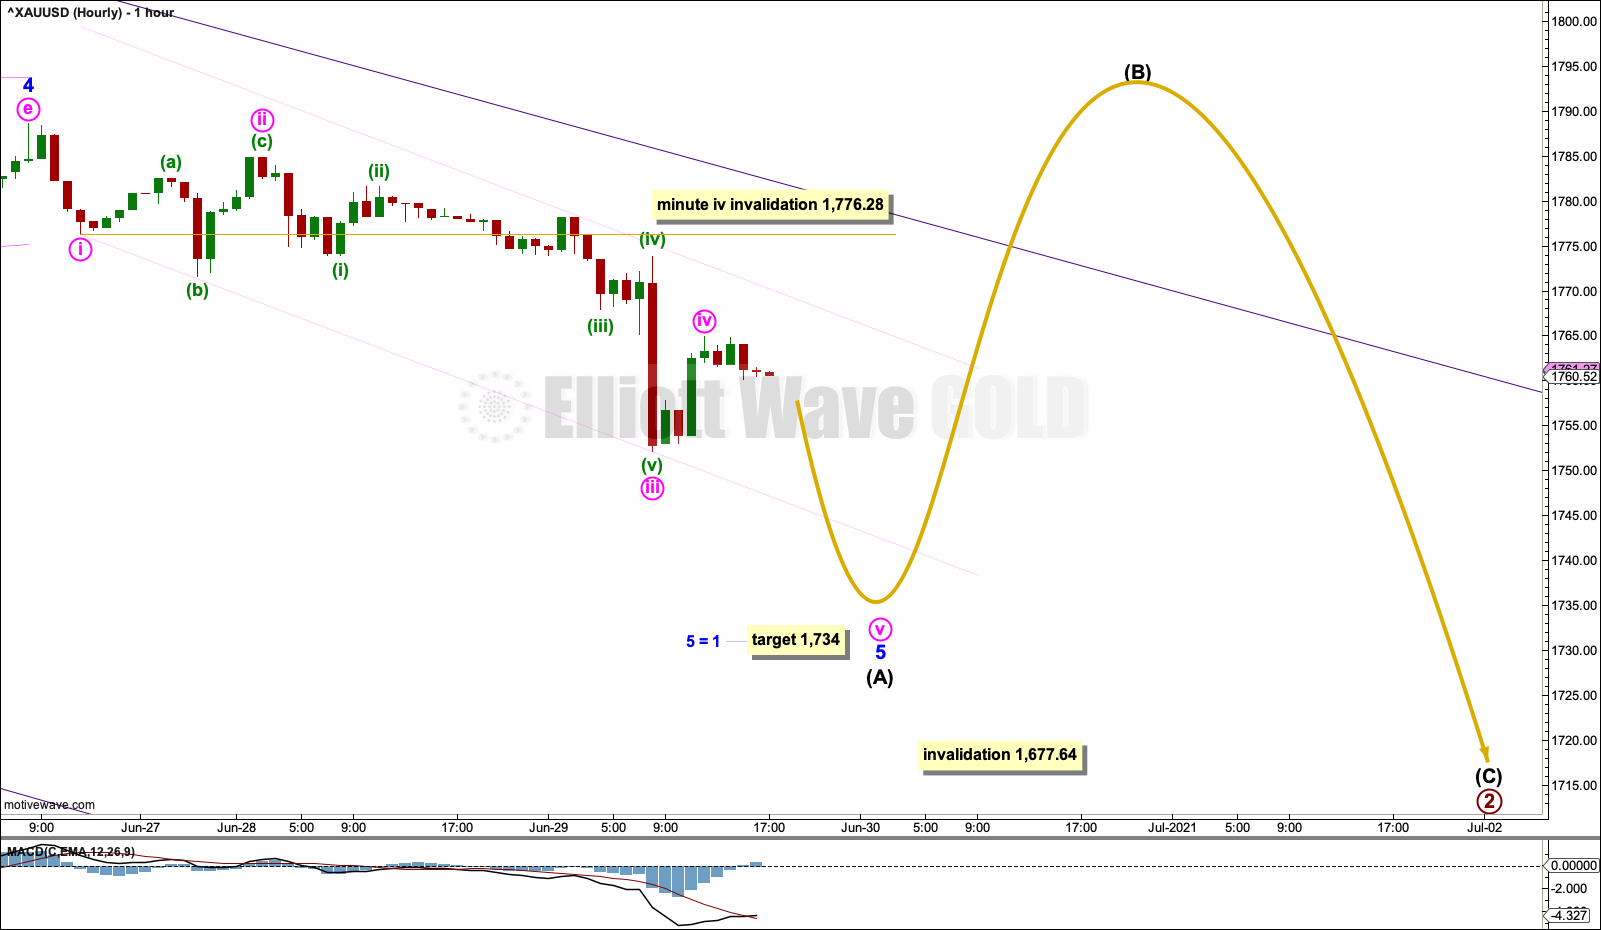
Intermediate wave (A) may be an incomplete impulse. Within the impulse: Minor wave 4 subdivides as a triangle, and minor wave 5 may be an incomplete impulse.
Fifth waves following fourth wave triangles for Gold can be surprisingly brief and short. If the target at 1,734 is wrong, then it may be too low.
Minute waves i through to iv within minor wave 5 may be complete. If minute wave iv continues higher, then it may not move into minute wave i price territory above 1,776.28. In the short term, a new high above this point may not be a fourth wave correction; if this comes prior to new lows, then it would indicate minor wave 5 may be complete. If minor wave 5 is complete, then intermediate wave (A) should be complete and intermediate wave (B) should then be underway.
ALTERNATE ELLIOTT WAVE COUNT
WEEKLY CHART

Click chart to enlarge.
The bigger picture for this alternate Elliott wave count sees Gold as within a bear market, in a three steps back pattern that is labelled Grand Super Cycle wave IV on monthly charts. Grand Super Cycle wave IV may be subdividing as an expanded flat pattern.
Super Cycle wave (b) within Grand Super Cycle wave IV may be a complete double zigzag. This wave count expects Super Cycle wave (c) to move price below the end of Super Cycle wave (a) at 1,046.27 to avoid a truncation and a very rare running flat. The target calculated expects a common Fibonacci ratio for Super Cycle wave (c).
Super Cycle wave (c) may have begun with a leading expanding diagonal for cycle wave I. Leading expanding diagonals in first wave positions are uncommon, so the probability of this wave count is reduced. However, it has a good fit and must be considered.
Second wave corrections to follow leading diagonals in first wave positions are usually very deep. Cycle wave II is deep and the structure may be complete; so far it is following a common pattern. If it continues higher, then cycle wave II may not move beyond the start of cycle wave I above 2,070.78.
DAILY CHART
Click chart to enlarge.
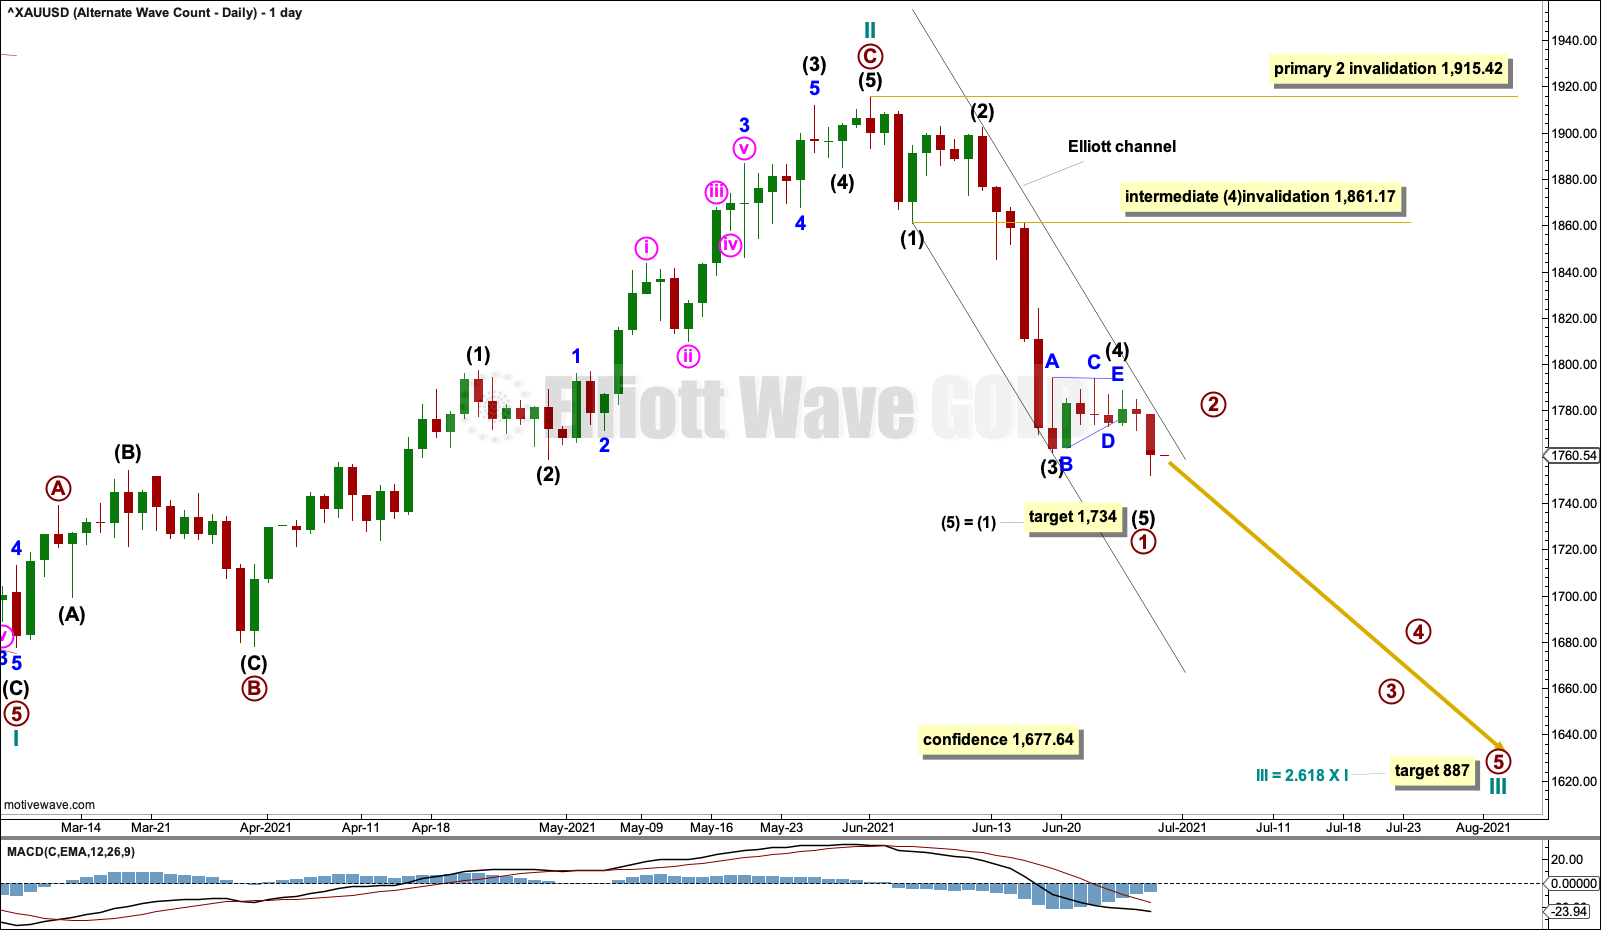
A target is calculated for cycle wave III.
Primary wave 1 within cycle wave III may be nearing an end, but for this wave count may not yet be complete. If intermediate wave (4) within primary wave 1 continues higher, then it may not move into intermediate wave (1) price territory above 1,861.17.
Intermediate wave (4) may be a complete regular contracting triangle. A target for intermediate wave (5) is calculated.
Draw an Elliott channel about primary wave 1. When this channel is breached by upwards movement, then that may be used as an indication that primary wave 1 should be over and primary wave 2 may then be underway.
HOURLY CHART
Click chart to enlarge.
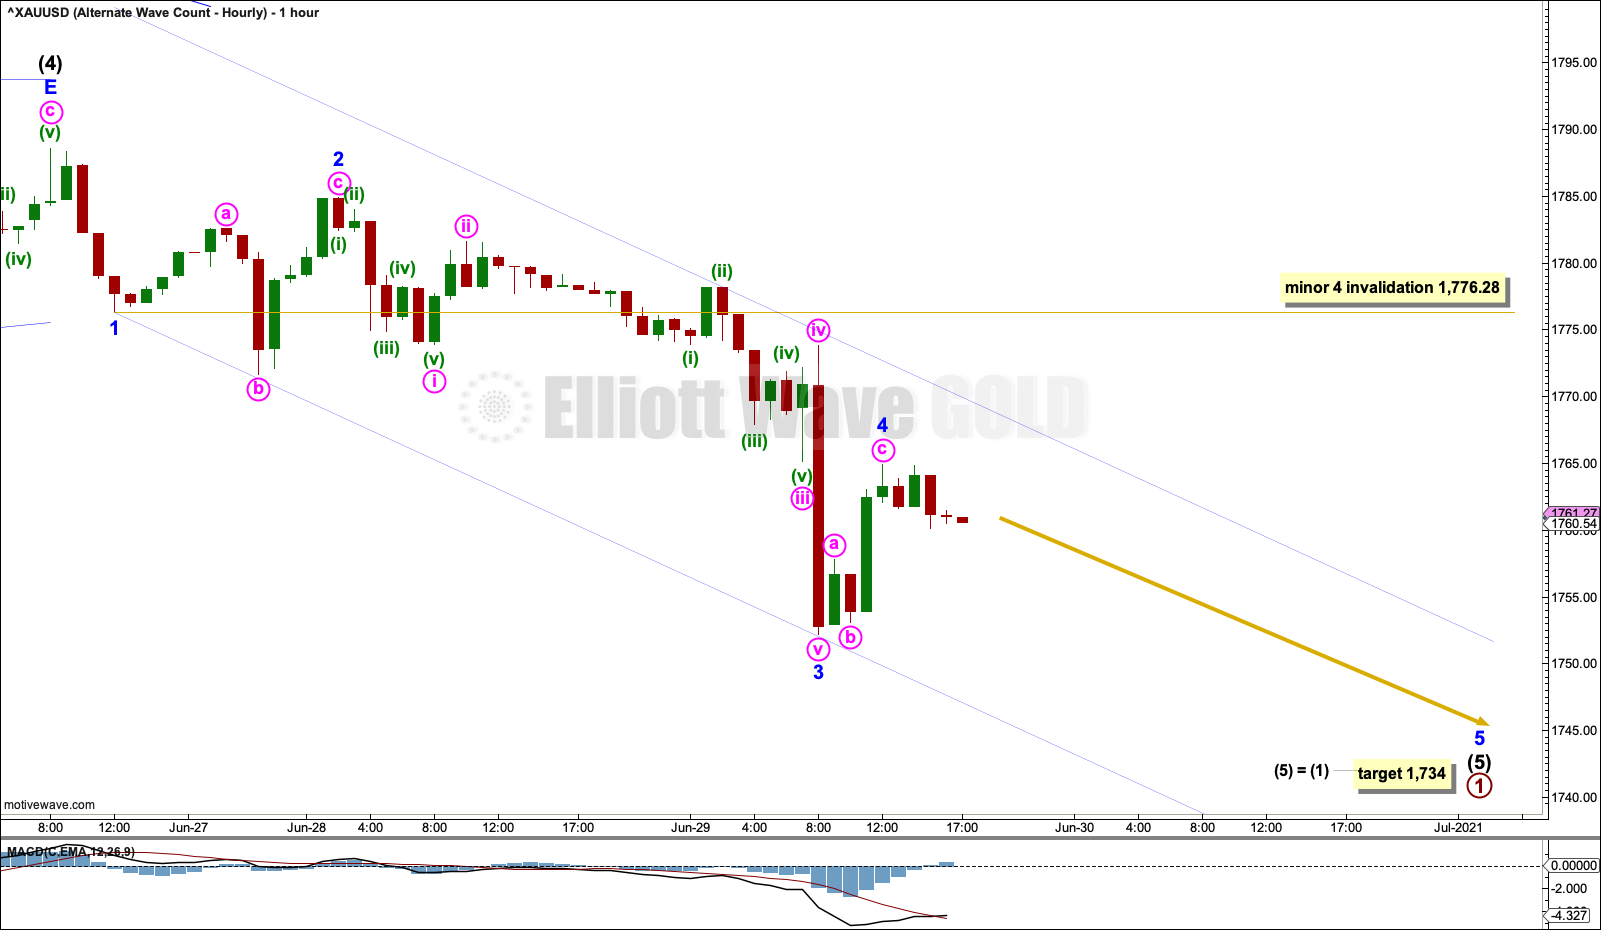
The most common Fibonacci ratio for intermediate wave (5) would be equality in length with intermediate wave (1).
Following fourth wave triangles for Gold, fifth waves can be surprisingly brief and short. If the target is wrong, then it may be too low; intermediate wave (5) could be surprisingly brief and short.
When primary wave 1 may be complete, then a multi-week to multi-month bounce or consolidation for primary wave 2 may be expected.
For the short term, a new high above 1,776.28 prior to new lows would be an indication that primary wave 1 may be complete. A breach of the smaller channel on this hourly chart would be an early sign that primary wave 1 may be complete.
TECHNICAL ANALYSIS
WEEKLY CHART
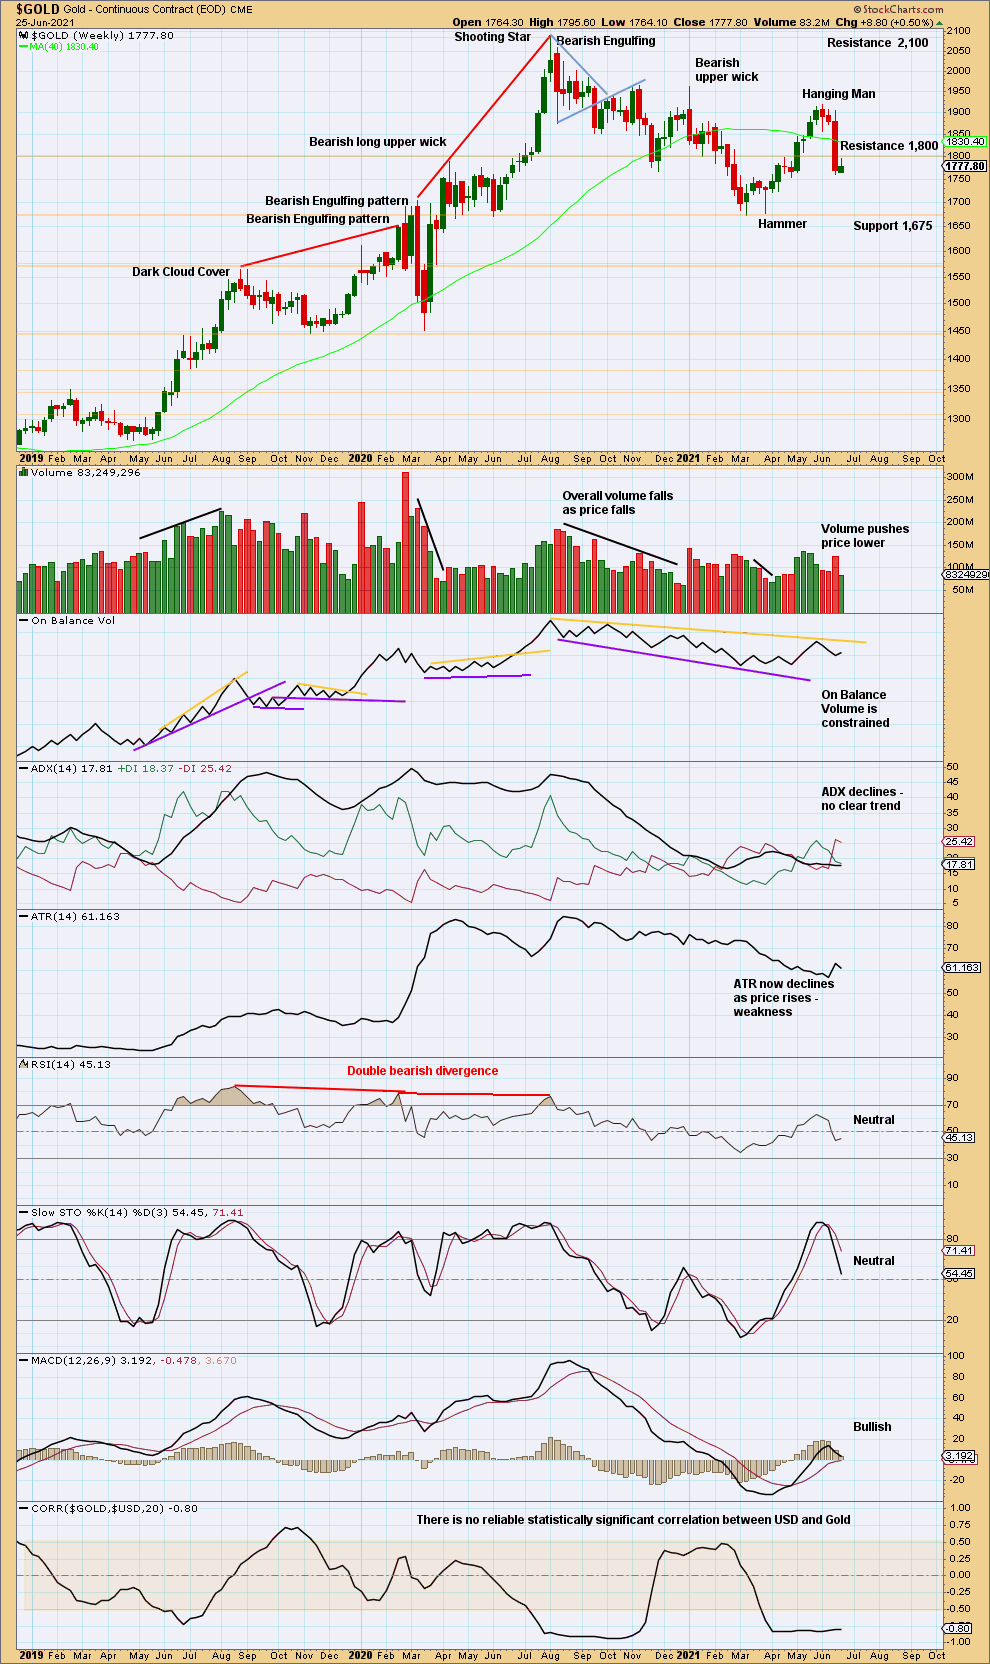
Click chart to enlarge. Chart courtesy of StockCharts.com.
The upwards trend may have ended, for now. There is now a bearish candlestick reversal pattern in a Hanging Man that has bearish confirmation in the following candlestick.
A small inside week is a small pause after the prior strong downwards week. This looks like a small pause within an ongoing downwards movement. If ADX increases, then it would give a strong bearish signal.
DAILY CHART
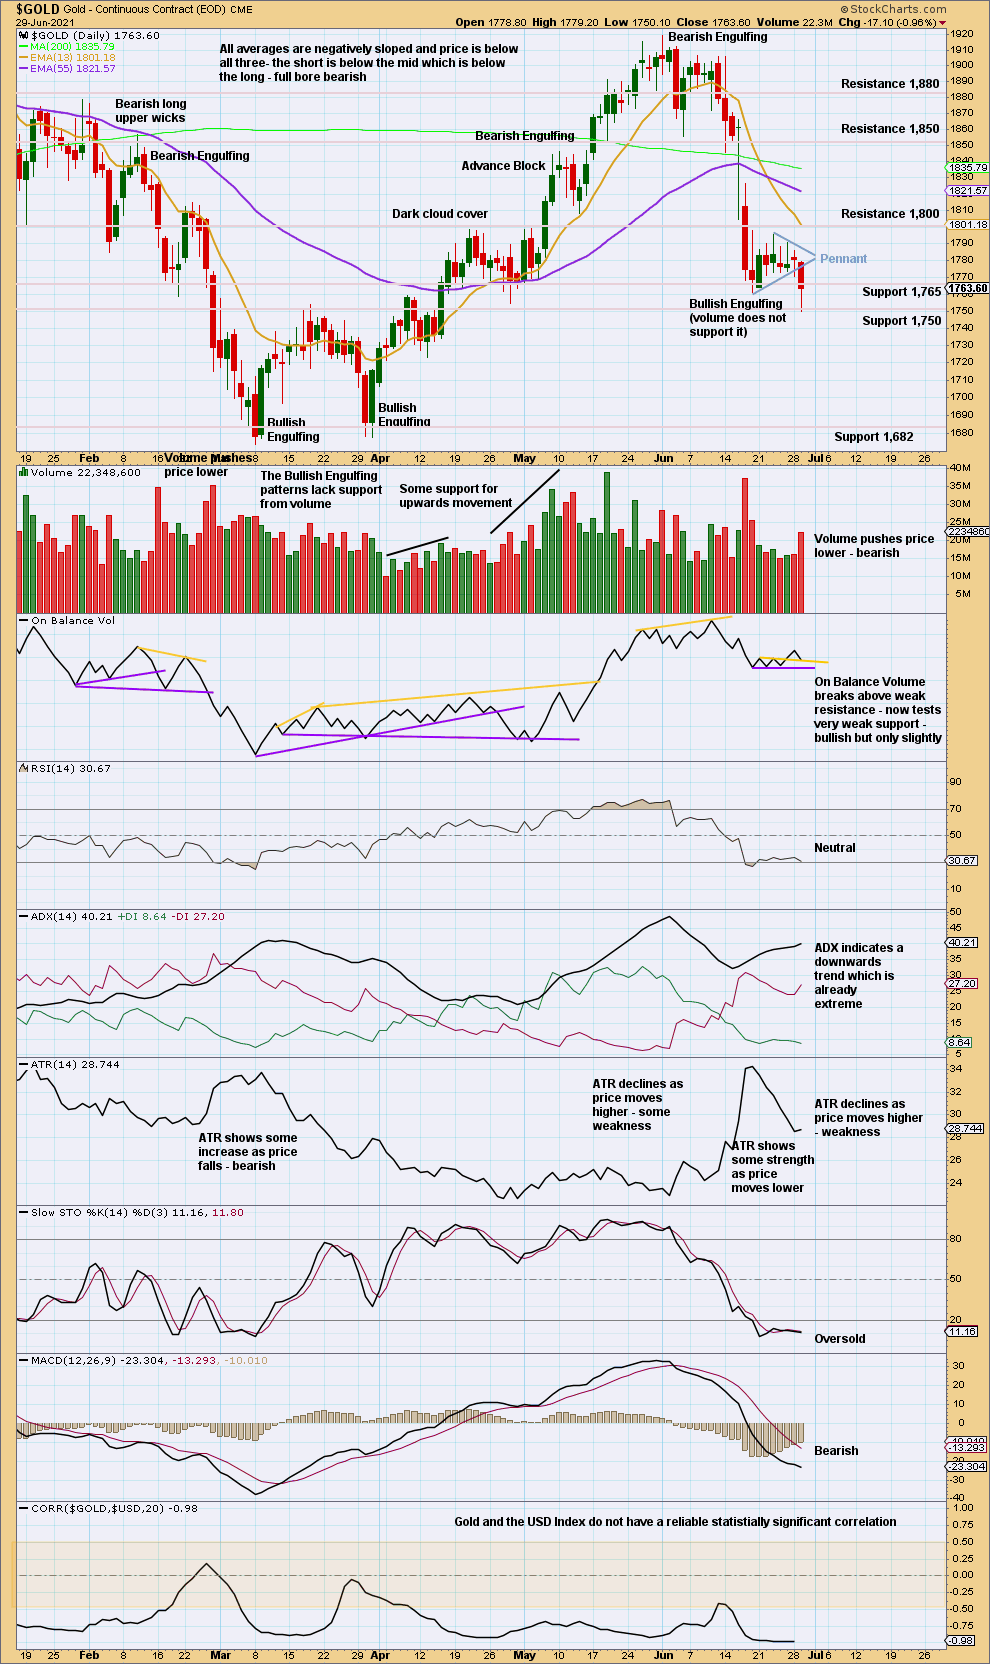
Click chart to enlarge. Chart courtesy of StockCharts.com.
Price has bounced up off support about 1,750. The long lower wick on this last daily candlestick is bullish.
A target calculated from the flag pole of the pennant is at 1,632. But bullish divergence between price and RSI, after RSI reached oversold, and the long lower candlestick wick (which is bullish) suggest this target may be too low.
GDX WEEKLY CHART
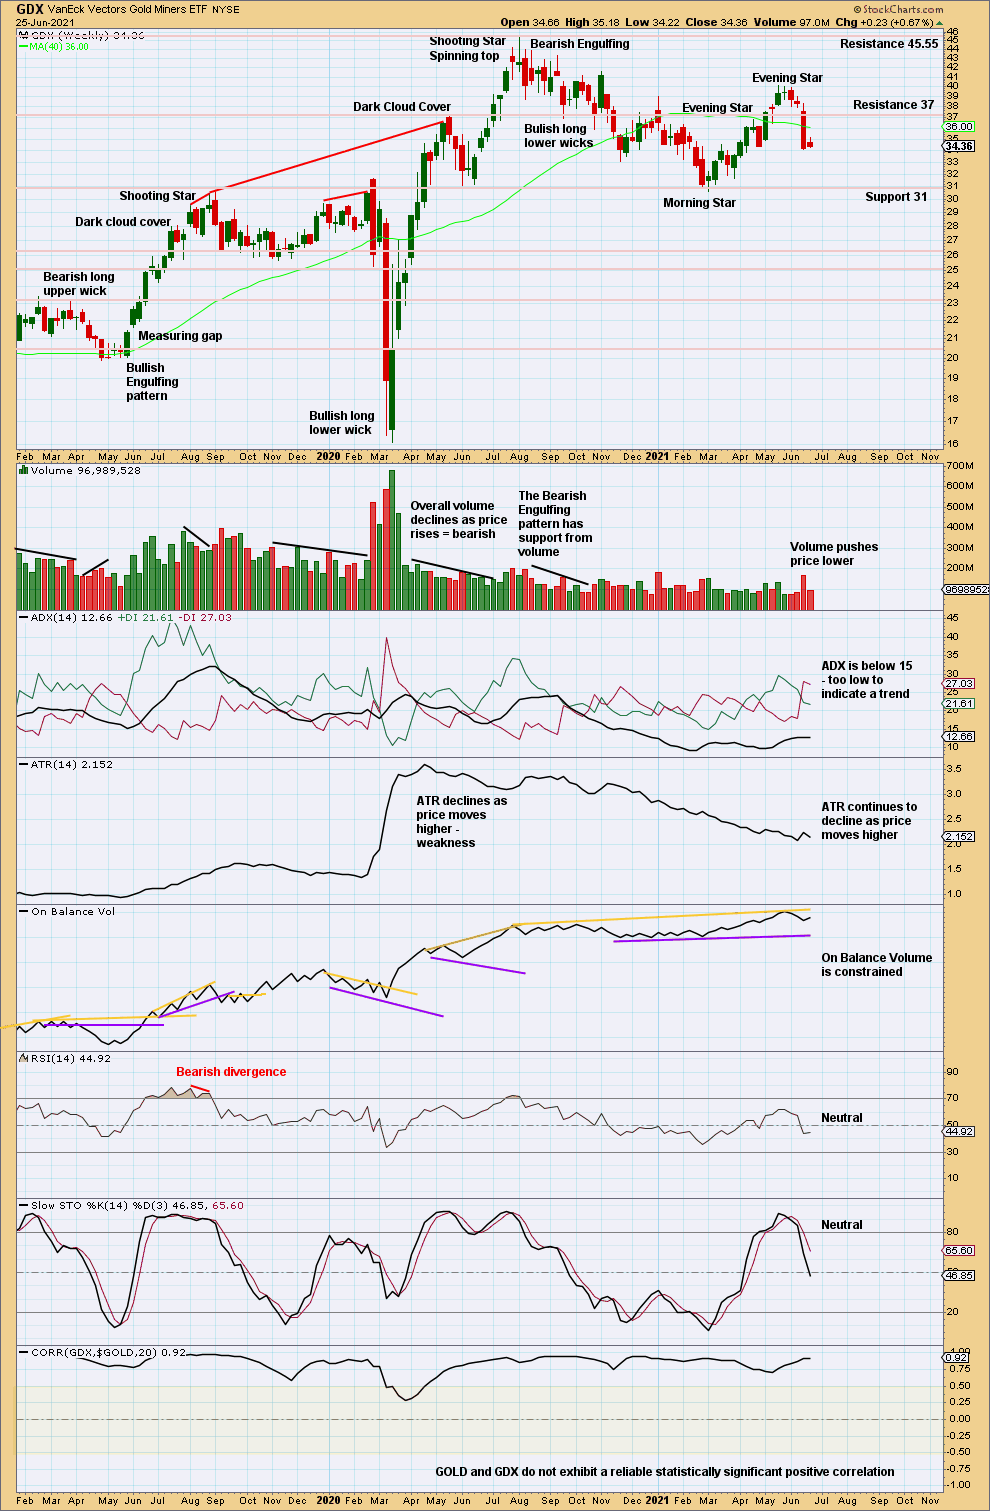
Click chart to enlarge. Chart courtesy of StockCharts.com.
A strong downwards week that has push from volume is followed by a small pause. This looks like a pause within an ongoing downwards trend.
GDX DAILY CHART
Click chart to enlarge. Chart courtesy of StockCharts.com.
The measuring gap gives a target at 33.78.
A target from the pennant pattern is at 29.41.
Published @ 06:40 p.m. ET.
—
Careful risk management protects your trading account(s).
Follow my two Golden Rules:
1. Always trade with stops.
2. Risk only 1-5% of equity on any one trade.
—
New updates to this analysis are in bold.
—