
Lara’s Weekly: Elliott Wave and Technical Analysis of S&P500 and Gold and US Oil | Charts – June 4, 2021

S&P 500
Upwards movement today indicates the pullback is most likely over.
The upwards trend remains intact as the Elliott wave count expects.
Summary: The trend is up. The next target for the next wave up is at 4,900.
The biggest picture, Grand Super Cycle analysis, is here.
Last monthly charts are here. Video is here.
ELLIOTT WAVE COUNT
WEEKLY CHART
Click chart to enlarge.
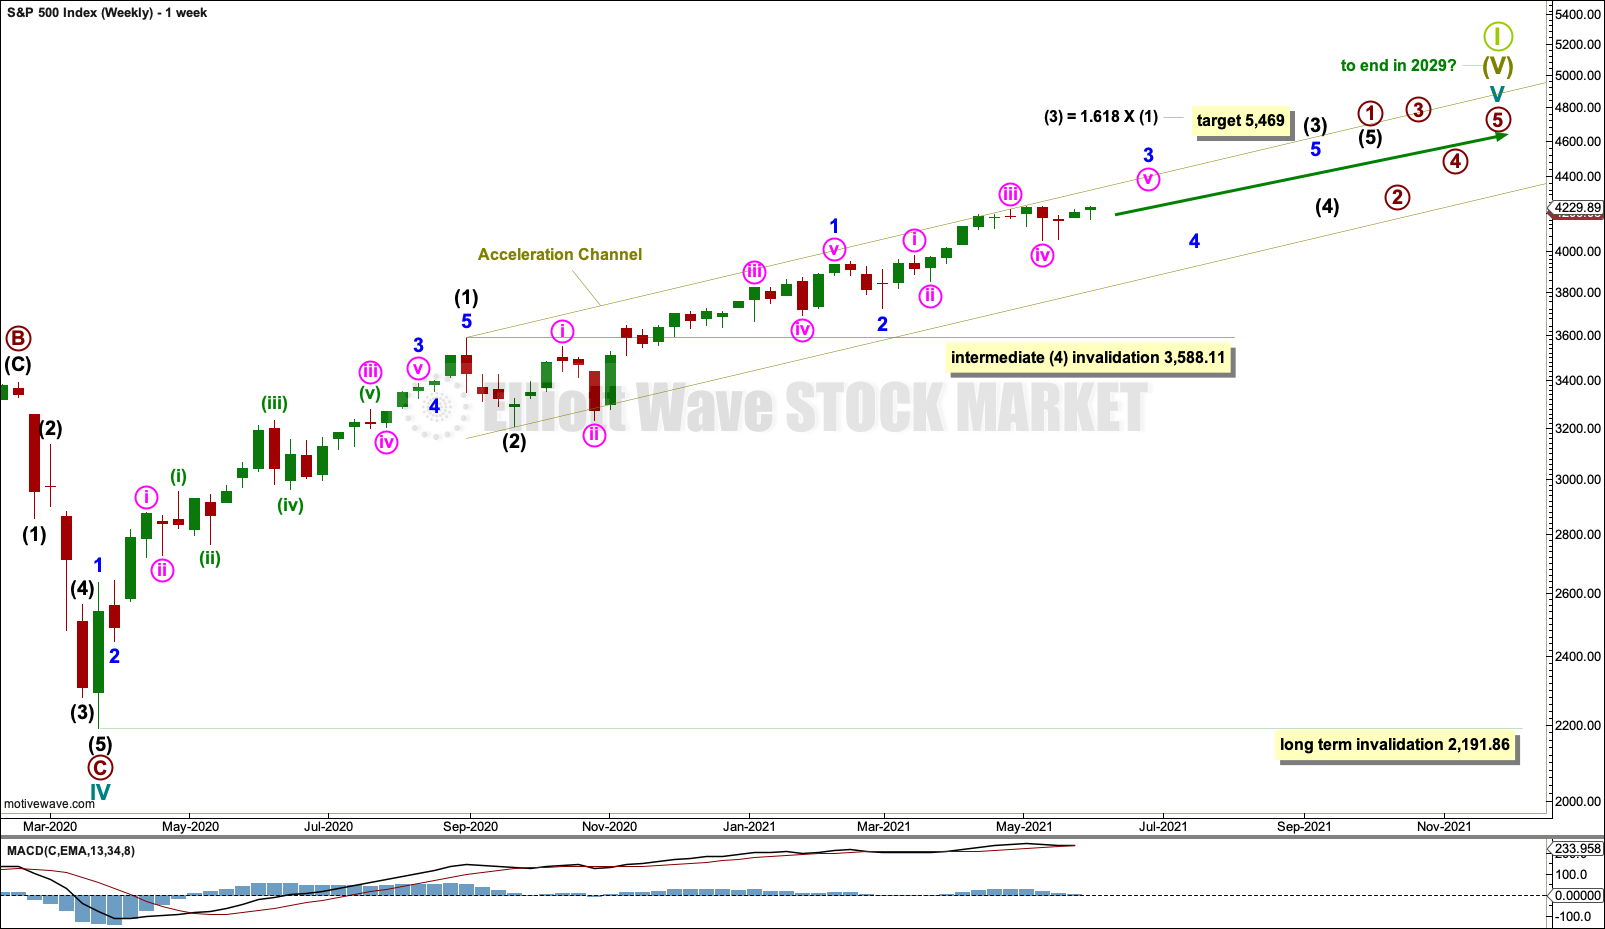
Cycle wave V may last from one to several years. So far it is in its fourteenth month.
This wave count may allow time for the AD line to diverge from price as price makes final highs before the end of the bull market. The AD line most commonly diverges a minimum of 4 months prior to the end of a bull market. A longer divergence is positively correlated with a deeper bear market. A shorter divergence is positively correlated with a more shallow bear market. With zero divergence at this stage, if a surprise bear market does develop here, then it would likely be shallow.
A longer divergence between price and the AD line would be expected towards the end of Grand Super Cycle wave I.
It is possible that cycle wave V may continue until 2029, if the 2020s mirror the 1920s. Either March or October 2029 may be likely months for the bull market to end.
Cycle wave V would most likely subdivide as an impulse. But if overlapping develops, then an ending diagonal should be considered. This chart considers the more common impulse.
There is already a Fibonacci ratio between cycle waves I and III within Super Cycle wave (V). The S&P500 often exhibits a Fibonacci ratio between two of its actionary waves but rarely between all three; it is less likely that cycle wave V would exhibit a Fibonacci ratio. The target for Super Cycle wave (V) to end would best be calculated at primary degree, but that cannot be done until all of primary waves 1, 2, 3 and 4 are complete.
Primary wave 1 within cycle wave V may be incomplete. This gives a very bullish wave count, expecting a long duration for cycle wave V which has not yet passed its middle strongest portion.
Within primary wave 1: Intermediate waves (1) and (2) may be complete, and intermediate wave (3) may now be approaching an end.
Within intermediate wave (3): Minor waves 1 and 2 may be complete, and minor wave 3 may be nearing an end.
Intermediate wave (4) may not move into intermediate wave (1) price territory below 3,588.11.
An acceleration channel is drawn about cycle wave V. Draw the first trend line from the end of intermediate wave (1) to the last high, then place a parallel copy on the end of intermediate wave (2). Keep redrawing the channel as price continues higher. When primary wave 1 is complete, then this channel would be drawn using Elliott’s first technique. The channel may then be used to provide confidence that primary wave 1 may be over and primary wave 2 may have arrived; when the channel is breached by downwards movement it would indicate a trend change.
When primary wave 1 may be complete, then a multi-month pullback or consolidation may unfold for primary wave 2. It is possible that primary wave 2 may meet the technical definition of a bear market; it may correct to 20% or more of market value.
Primary wave 2 may not move beyond the start of primary wave 1 below 2,191.86.
DAILY CHART
Click chart to enlarge.
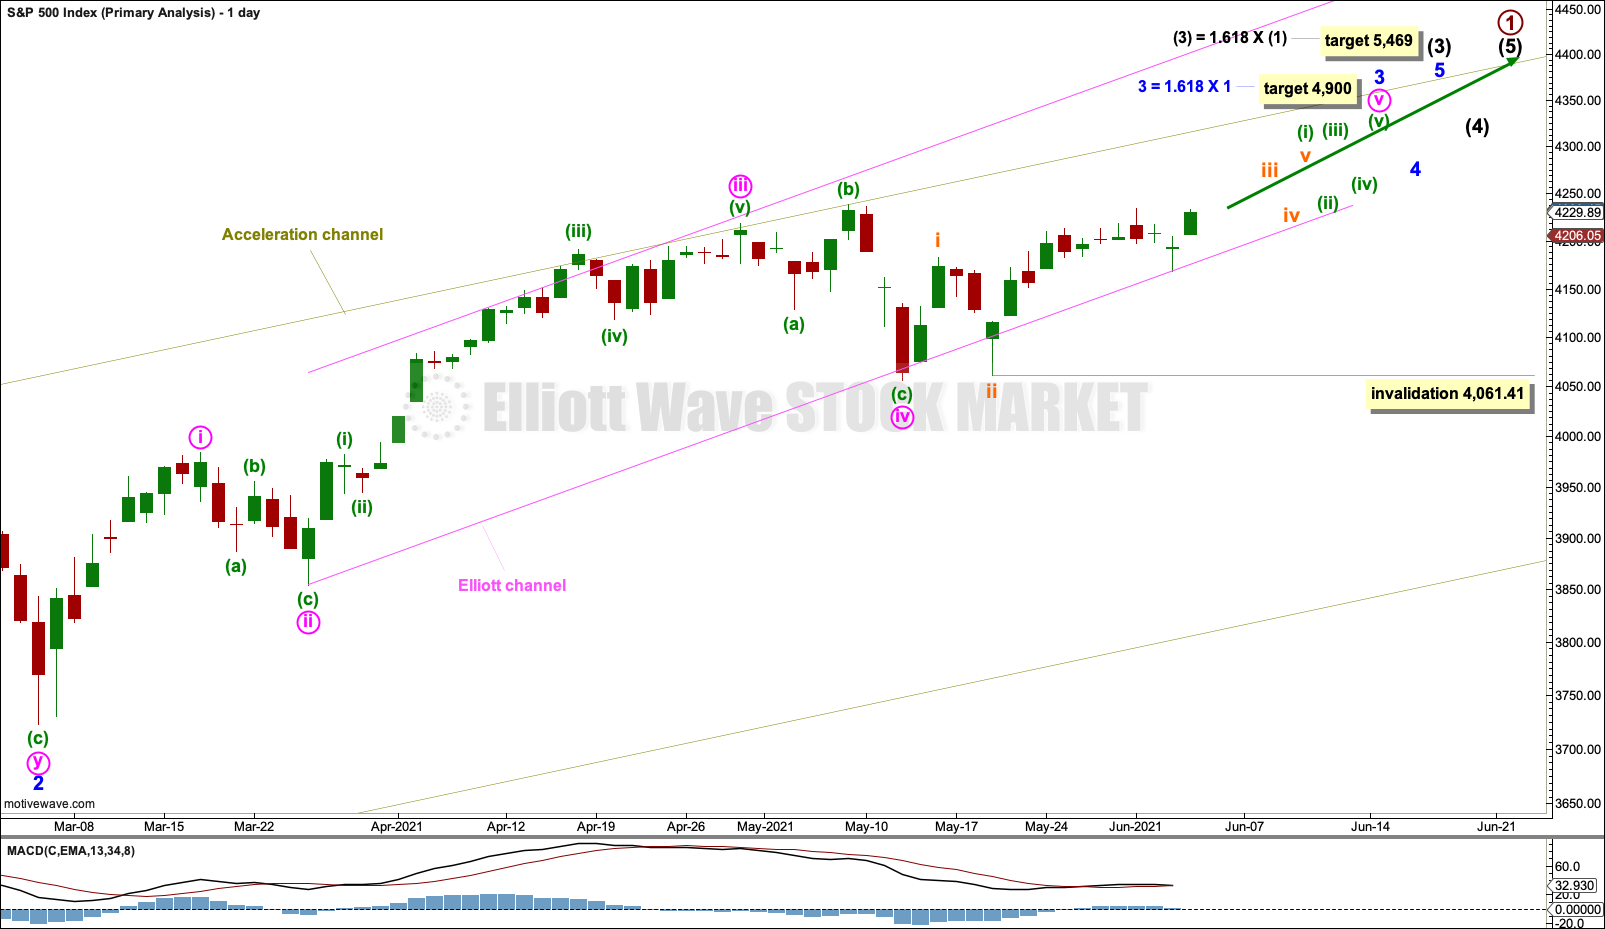
The daily chart focusses on minor wave 3 within intermediate wave (3).
Intermediate wave (3) may be extending. Third waves are most commonly extended for the S&P500, so this wave count follows a common tendency. A target is calculated for minor wave 3, which is also expected to be extending.
No second wave correction within subminuette wave iii may move beyond its start below 4,061.41.
Draw the channel using Elliott’s second technique. Draw the first trend line from the ends of minute waves ii to iv, then place a parallel copy on the end of minute wave iii. This channel may show where minute wave v may end, either mid way within the channel or about the upper edge. It may then be used to confirm a subsequent trend change, when it is breached by downwards movement.
The channel is overshot for the low labelled subminuette wave ii, which for this market is acceptable, and price has moved back within the channel. This market does not always sit neatly within channels as its impulses come to an end. It is possible that as minor wave 3 ends channels may need to be redrawn.
TECHNICAL ANALYSIS
WEEKLY CHART
Click chart to enlarge. Chart courtesy of StockCharts.com.
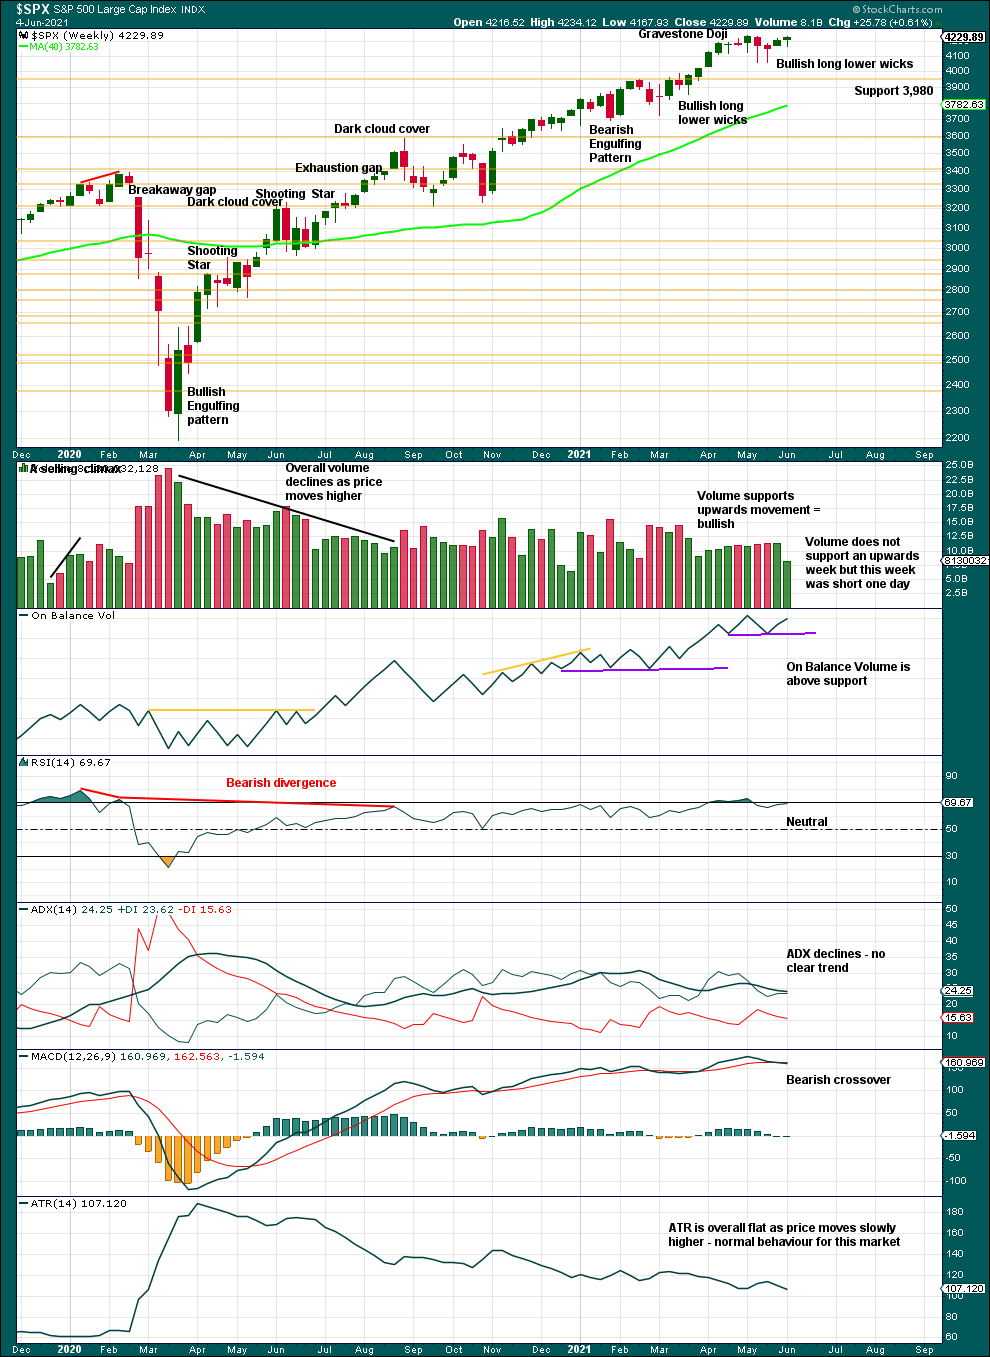
A series of higher highs and higher lows off the low of March 2020 continues. The last short-term swing low is now at 3,723.34. While this remains intact, the dominant view should be of an upwards trend. There is a long way for this trend to run before conditions may become extreme.
This chart has the look of a sustainable bull market in a relatively early stage; there is as yet no evidence that a larger correction should begin here. Although RSI very recently reached overbought, this market has a strong bullish bias and RSI can move deeply overbought and remain there for years prior to the bull market ending.
Now three long lower wicks on two weekly candlesticks are bullish for the short term.
For the short term, price looks to be in a small consolidation with support about 4,057 and resistance at the last all time high about 4,238. With the larger trend upwards, it would be most likely this consolidation may resolve with an upwards breakout.
DAILY CHART
Click chart to enlarge. Chart courtesy of StockCharts.com.
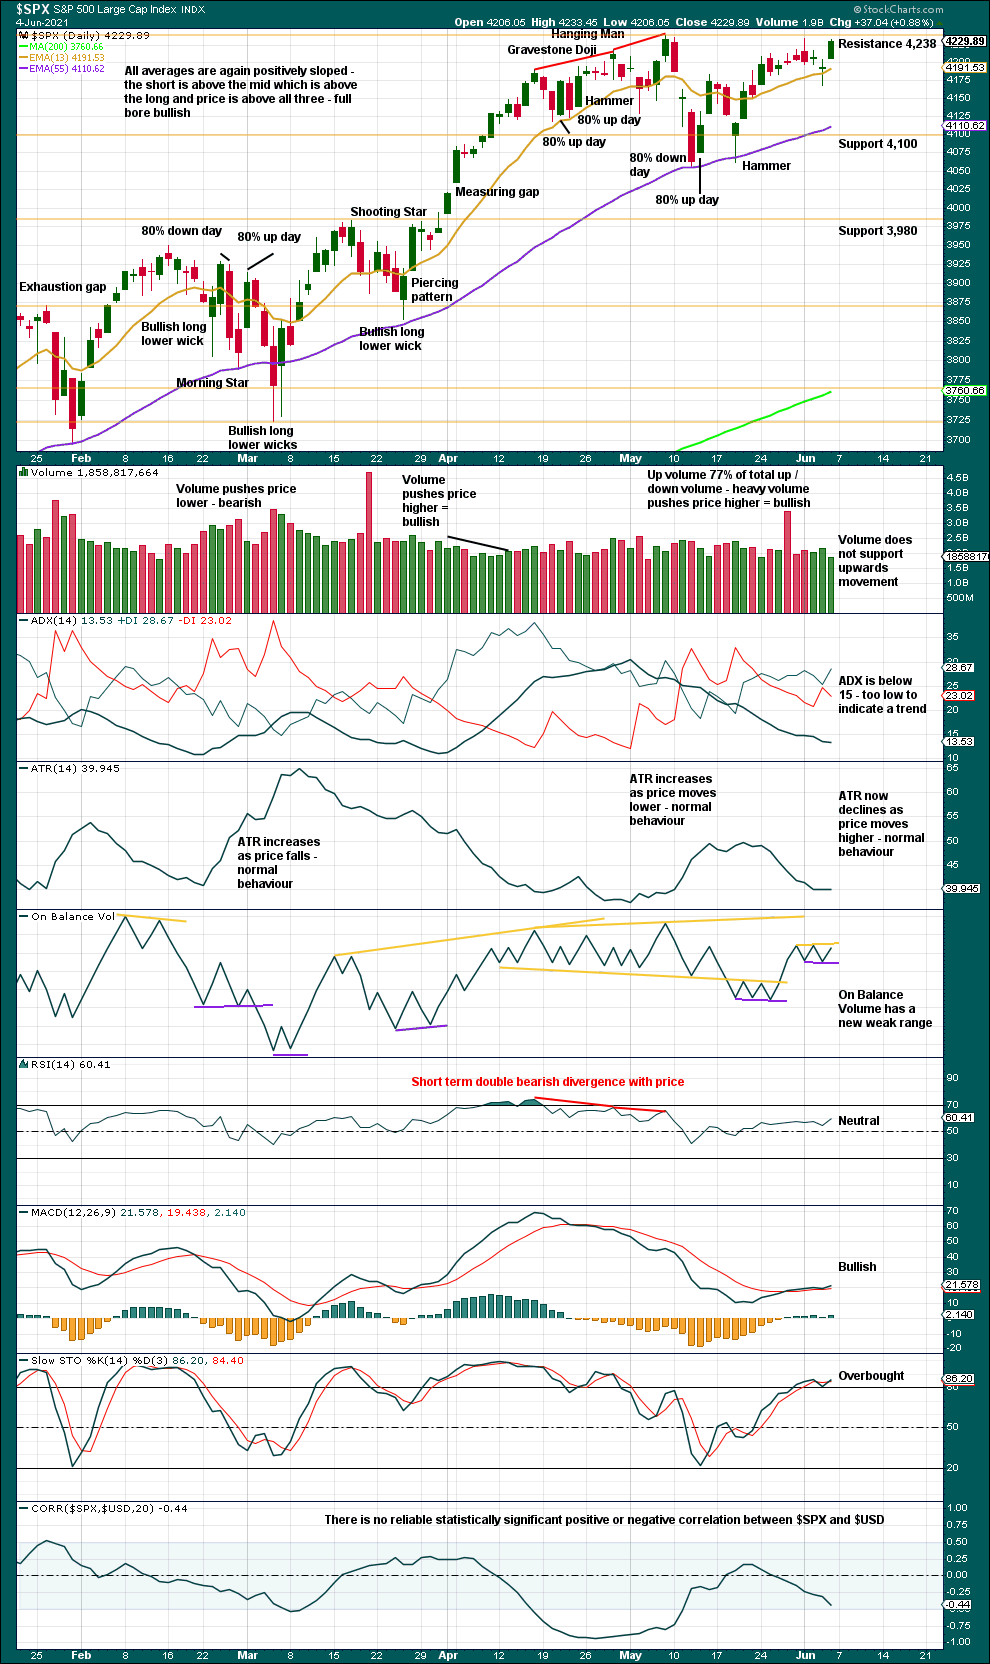
The series of higher highs and higher lows from the low of the 30th of October continues.
Pullbacks and consolidations are a normal and to be expected part of a bullish trend.
A strong upwards session (in terms of price and close) negates the slight bearishness from yesterday. Weak volume is not of a concern in current market conditions. Watch On Balance Volume carefully next week for a signal.
BREADTH – AD LINE
WEEKLY CHART
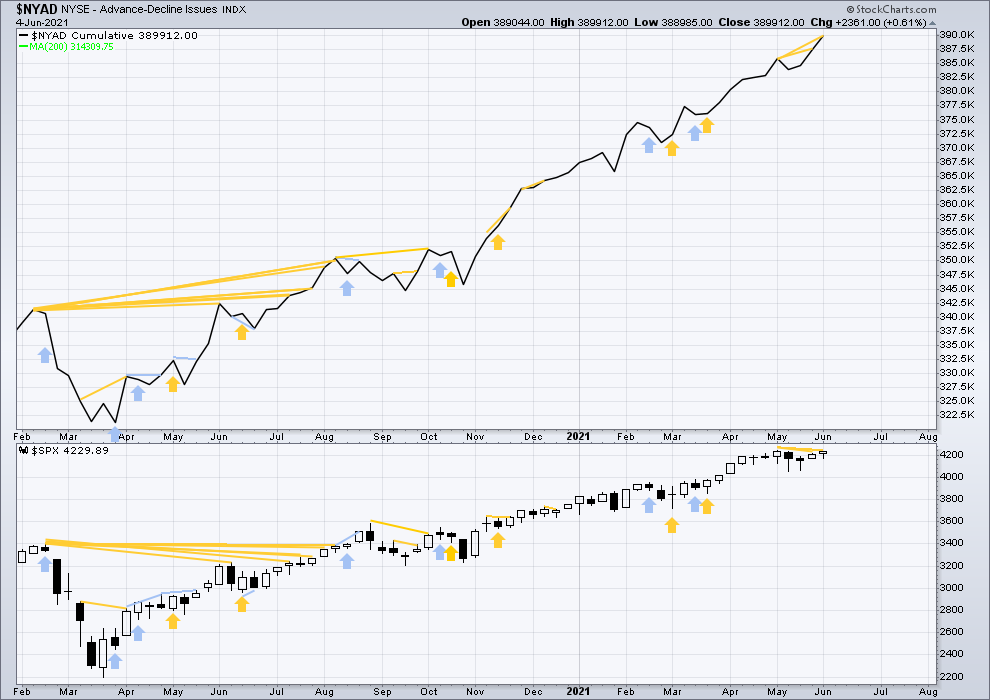
Click chart to enlarge. Chart courtesy of StockCharts.com. So that colour blind members are included, bearish signals will be noted with blue and bullish signals with yellow.
Breadth should be read as a leading indicator.
Lowry’s Operating Companies Only AD line has made a new all time high on the 1st of June. This supports the Elliott wave count.
Large caps all time high: 4,238.04 on May 7, 2021.
Mid caps all time high: 2,778.84 on April 29, 2021.
Small caps all time high: 1,399.31 on March 12, 2021.
The last new high is found in large caps only. Small caps have been lagging since the 15th of March. Mid caps have been lagging since the 29th of April. This lag from small and mid caps is not precise in terms of timing when a pullback may begin, but it is an early warning sign of some developing weakness. It would be expected that as third waves come to an end some weakness should begin to develop; this situation may fit with the Elliott wave count.
Again, the AD line has made a new all time high, but price has not. This is a strong bullish signal and supports the Elliott wave count.
DAILY CHART
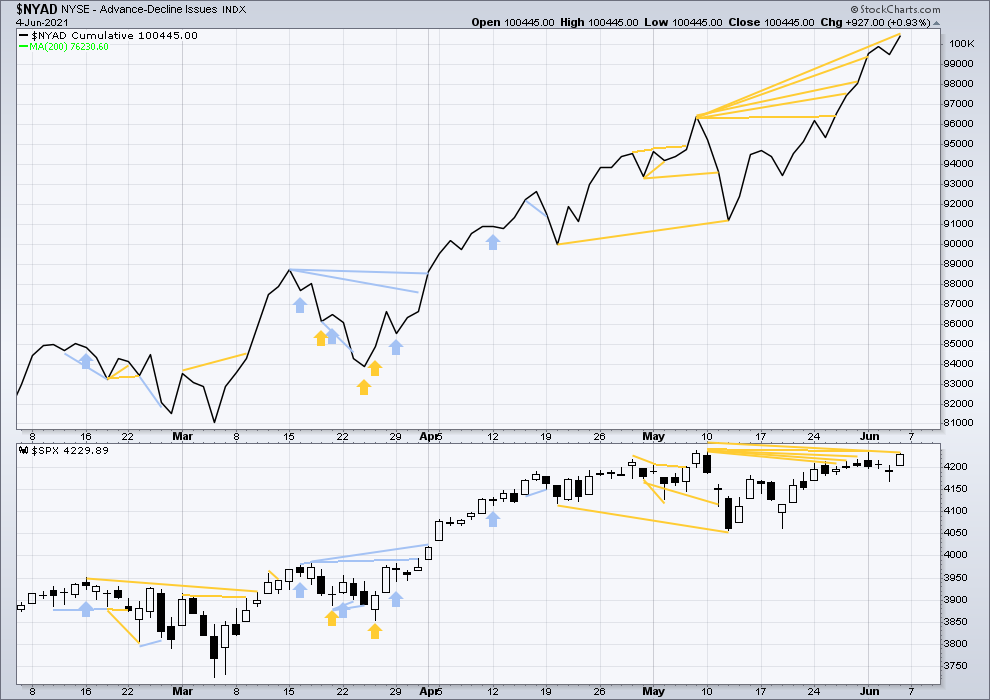
Click chart to enlarge. Chart courtesy of StockCharts.com. So that colour blind members are included, bearish signals will be noted with blue and bullish signals with yellow.
The AD line has made another new all time high, but price has not. There is now a strong cluster of bullish divergence that supports the Elliott wave count.
It was large caps which were strongest on Friday. This is a slight concern for the Elliott wave count.
VOLATILITY – INVERTED VIX CHART
WEEKLY CHART
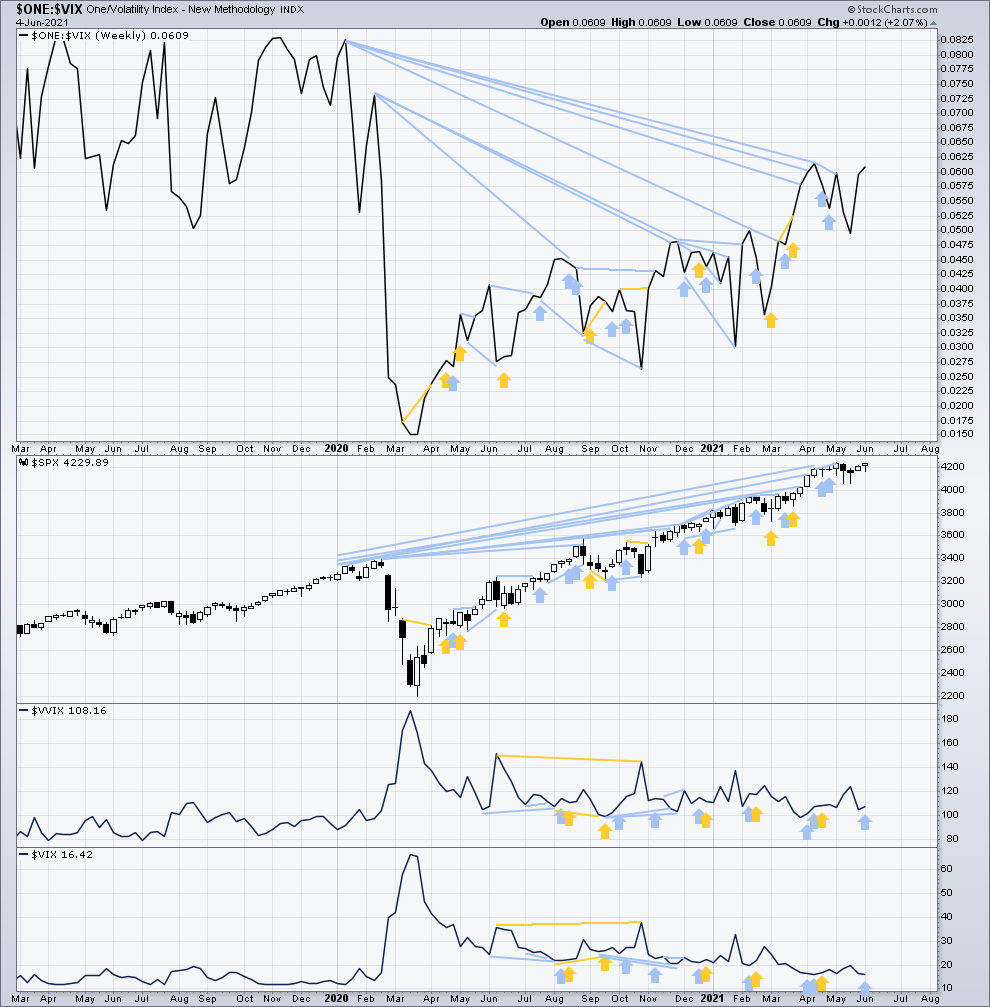
Click chart to enlarge. Chart courtesy of StockCharts.com. So that colour blind members are included, bearish signals will be noted with blue and bullish signals with yellow.
Inverted VIX remains well below all time highs. The all time high for inverted VIX was in the week beginning October 30, 2017. There is over 3 years of bearish divergence between price and inverted VIX. This bearish divergence may develop further before the bull market ends. It may be a very early indicator of an upcoming bear market, but it is not proving to be useful in timing.
This week both price and inverted VIX have moved higher. Upwards movement in price is coming with a normal corresponding decline in volatility. This supports the Elliott wave count.
Comparing VIX and VVIX at the weekly chart level:
This week VIX has moved slightly lower, but VVIX has moved higher. Volatility of VIX is elevated. This short-term divergence is bearish for price.
DAILY CHART
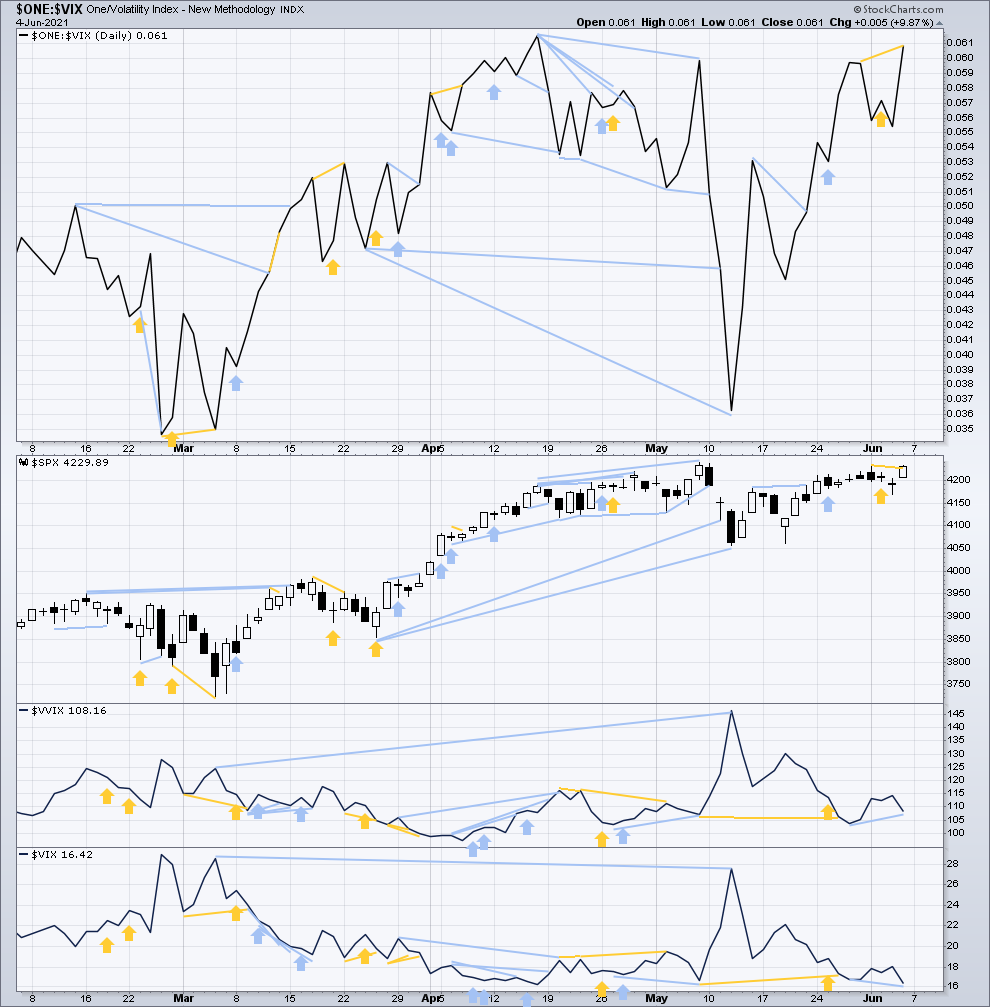
Click chart to enlarge. Chart courtesy of StockCharts.com. So that colour blind members are included, bearish signals will be noted with blue and bullish signals with yellow.
On Friday inverted VIX has made a new short-term high, but price has not. This divergence is bullish for price for the short term and supports the Elliott wave count, and agrees with bullish divergence between price and the AD line.
Comparing VIX and VVIX at the daily chart level:
To end the week VIX has made a new short-term low, but VVIX has not. Volatility of VIX is elevated. This divergence is bearish for price for the short term. Because it contradicts divergence between price and the AD line and price and inverted VIX, the divergence will not be given weight in this analysis.
DOW THEORY
Dow Theory confirms a new bull market with new highs made on a closing basis:
DJIA: 29,568.57 – closed above on 16th November 2020.
DJT: 11,623.58 – closed above on 7th October 2020.
Most recently, on 10th May 2021 both DJIA and DJT have made new all time highs. An ongoing bull market is again confirmed by Dow Theory.
Adding in the S&P and Nasdaq for an extended Dow Theory, confirmation of a bull market would require new highs made on a closing basis:
S&P500: 3,393.52 – closed above on 21st August 2020.
Nasdaq: 9,838.37 – closed above on June 8, 2020.
The following major swing lows would need to be seen on a closing basis for Dow Theory to confirm a change from bull to a bear market:
DJIA: 18,213.65
DJT: 6,481.20
Adding in the S&P and Nasdaq for an extended Dow Theory, confirmation of a new bear market would require new lows on a closing basis:
S&P500: 2,191.86
Nasdaq: 6,631.42
GOLD
More downwards movement was expected to end about 1,854 to 1,845, but the target zone was too low. Downwards movement ended at 1,861.17 before a strong reversal closed the candlestick for Friday green.
Both Elliott wave counts remain valid.
Summary: The main wave count is bullish. The next mid-term target is at 1,923. The longer-term target is at 2,094 although this may need to be revised higher.
An alternate Elliott wave count is considered. The next target zone for upwards movement is at 1,940 to 1,941.
Grand SuperCycle analysis and last monthly charts are here.
MAIN ELLIOTT WAVE COUNT
WEEKLY CHART
Click chart to enlarge.
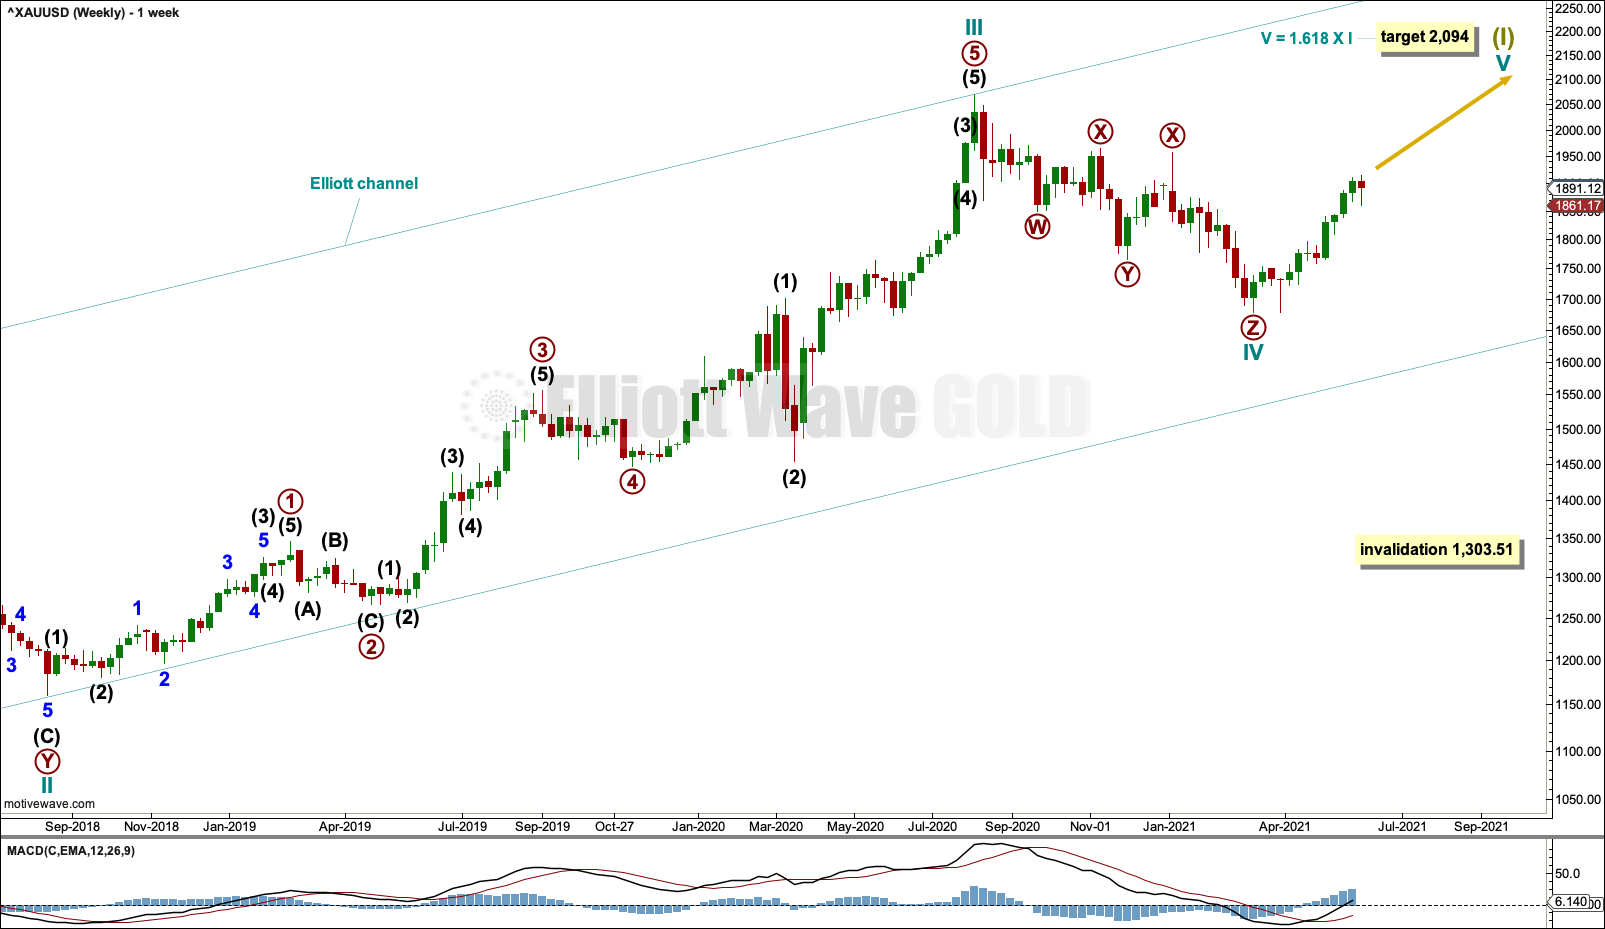
This wave count sees the the bear market complete at the last major low for Gold on 3 December 2015.
If Gold is in a new bull market, then it should begin with a five wave structure upwards on the weekly chart.
Cycle wave I fits as a five wave impulse with reasonably proportionate corrections for primary waves 2 and 4.
Cycle wave II fits as a double flat. However, within the first flat correction labelled primary wave W, this wave count needs to ignore what looks like an obvious triangle from July to September 2016 (this can be seen labelled as a triangle on the second weekly chart on prior analysis here). This movement must be labelled as a series of overlapping first and second waves. Ignoring this triangle reduces the probability of this wave count in Elliott wave terms.
Cycle wave IV may be a complete triple zigzag.
If the third zigzag of primary wave Z continues lower, then cycle wave IV may not move into cycle wave I price territory below 1,303.51.
DAILY CHART
Click chart to enlarge.
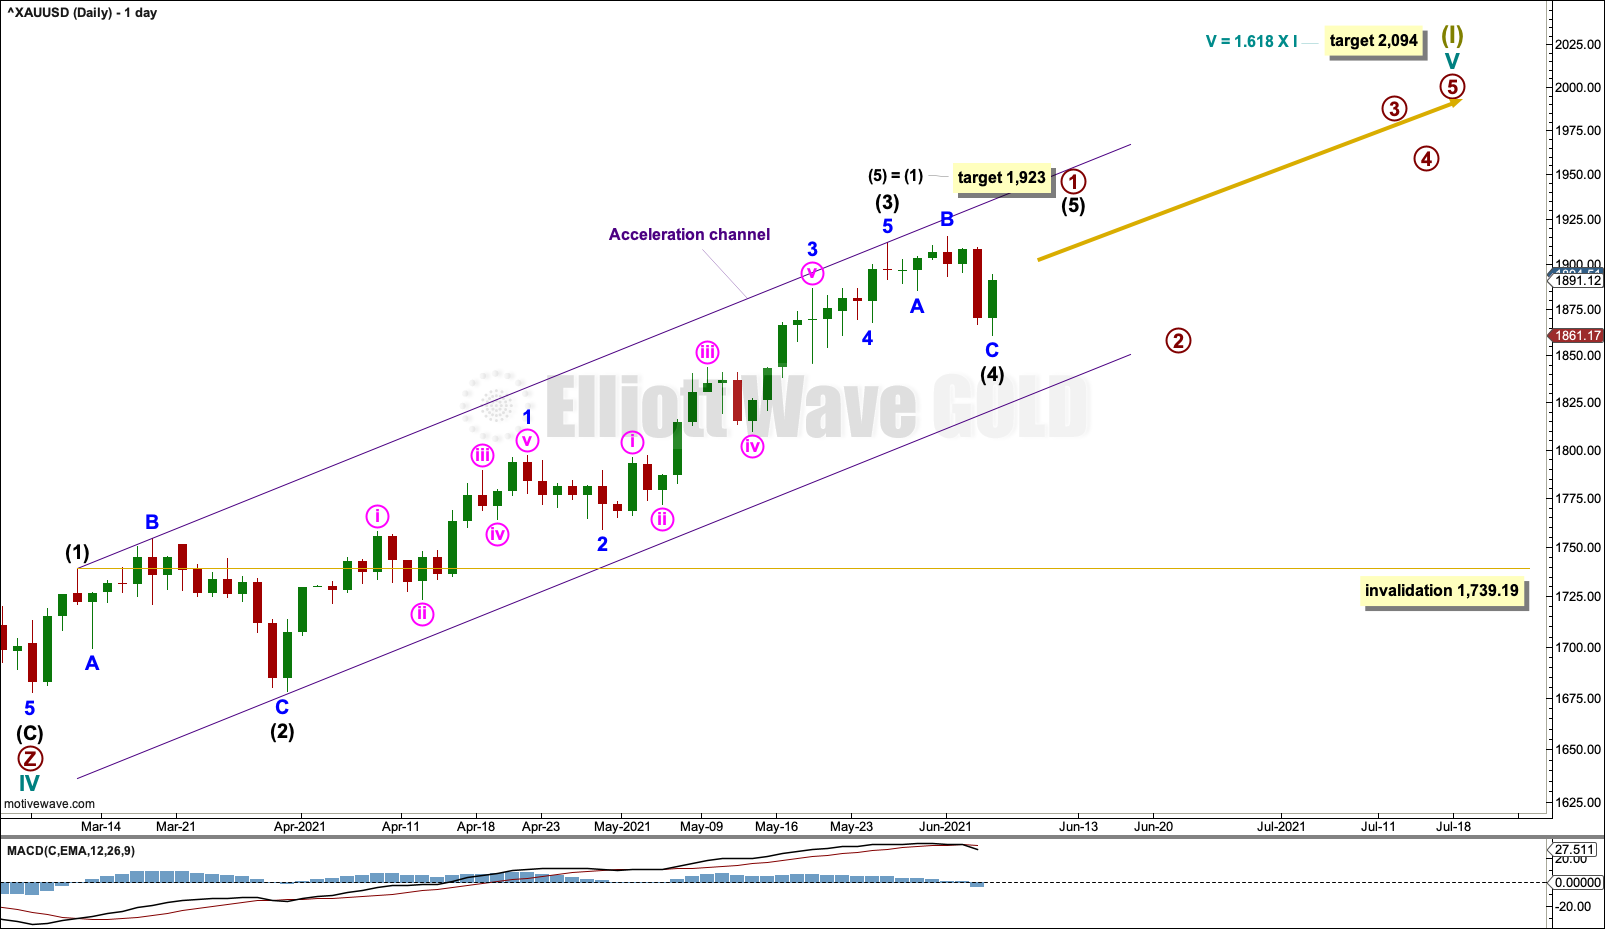
Cycle wave IV may be a complete triple zigzag.
A target is calculated for cycle wave V. If this target is wrong for this wave count, then it may be too low. As price approaches the target, if the structure is incomplete, then a higher target may be calculated.
Primary wave 1 within cycle wave V may be incomplete.
Within primary wave 1: Intermediate waves (1), (2) and (3) may be complete.
Intermediate wave (4) may today be complete as an expanded flat. It may also continue lower to find support about the lower edge of the Elliott channel.
Intermediate wave (4) may not move into intermediate wave (1) price territory below 1,739.19.
ALTERNATE ELLIOTT WAVE COUNT
WEEKLY CHART
Click chart to enlarge.
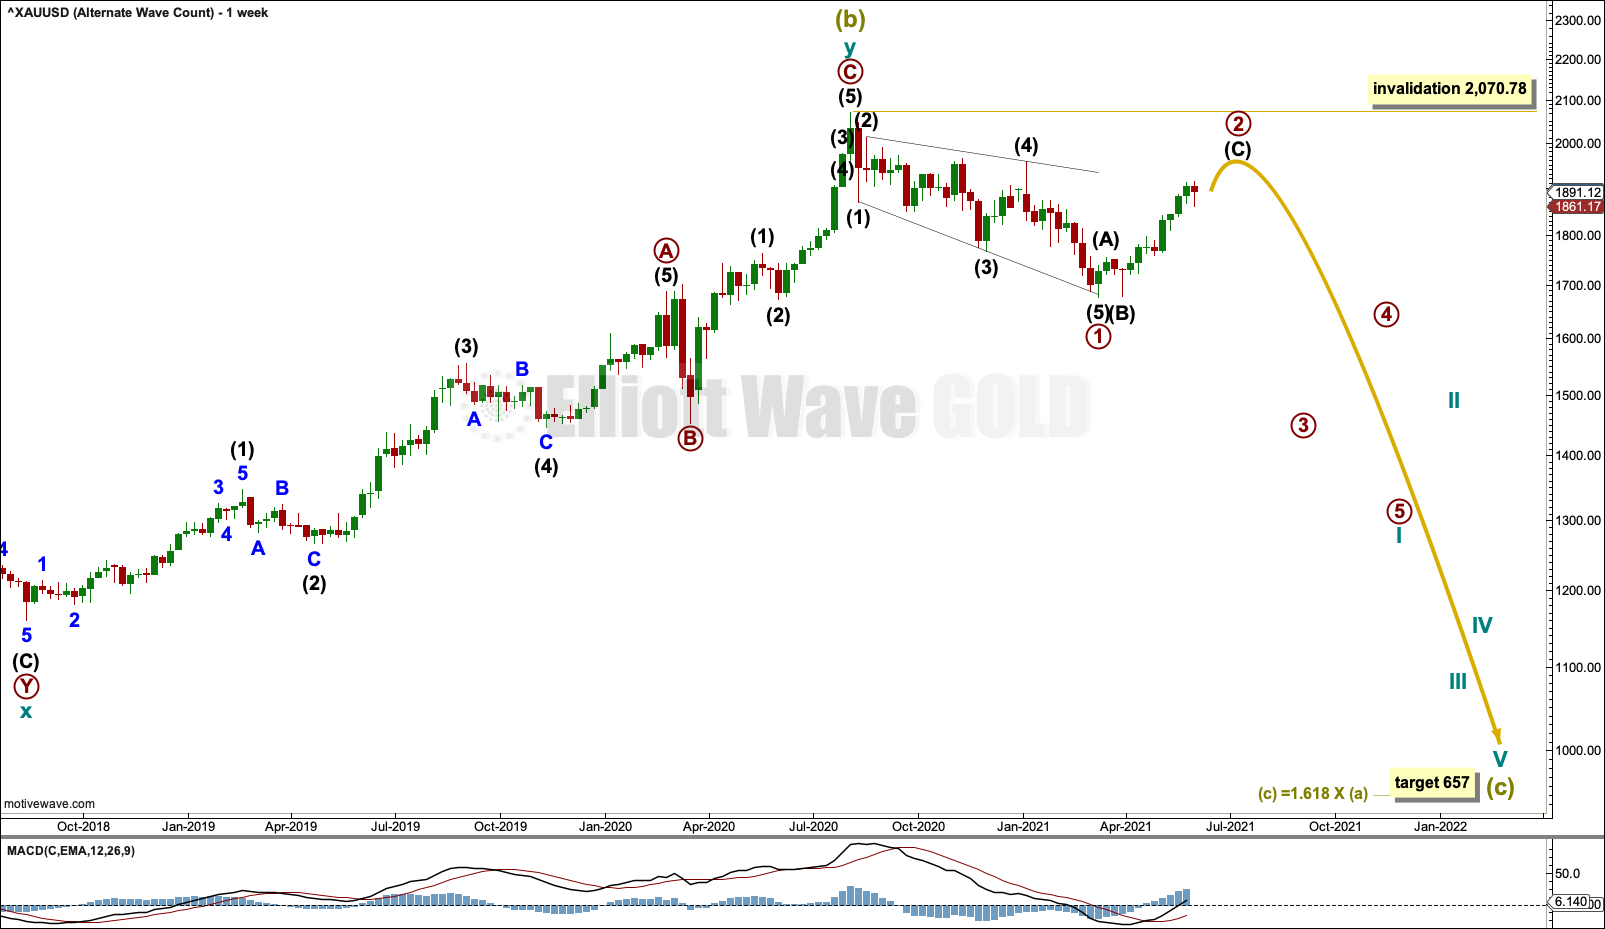
The bigger picture for this alternate Elliott wave count sees Gold as still within a bear market, in a three steps back pattern that is labelled Grand Super Cycle wave IV on monthly charts. Grand Super Cycle wave IV may be subdividing as an expanded flat pattern.
Super Cycle wave (b) within Grand Super Cycle wave IV may be a complete double zigzag. This wave count expects Super Cycle wave (c) to move price below the end of Super Cycle wave (a) at 1,046.27 to avoid a truncation and a very rare running flat. The target calculated expects a common Fibonacci ratio for Super Cycle wave (c).
Super Cycle wave (c) may have begun with a leading expanding diagonal for primary wave 1. Leading expanding diagonals in first wave positions are uncommon, so the probability of this wave count is reduced. However, it has a good fit and must be considered.
Second wave corrections to follow leading diagonals in first wave positions are usually very deep. Primary wave 2 may be expected to end at least about the 0.618 Fibonacci ratio at 1,920.42, and more likely a reasonable amount deeper than that. Primary wave 2 may not move beyond the start of primary wave 1 above 2,070.78.
DAILY CHART
Click chart to enlarge.
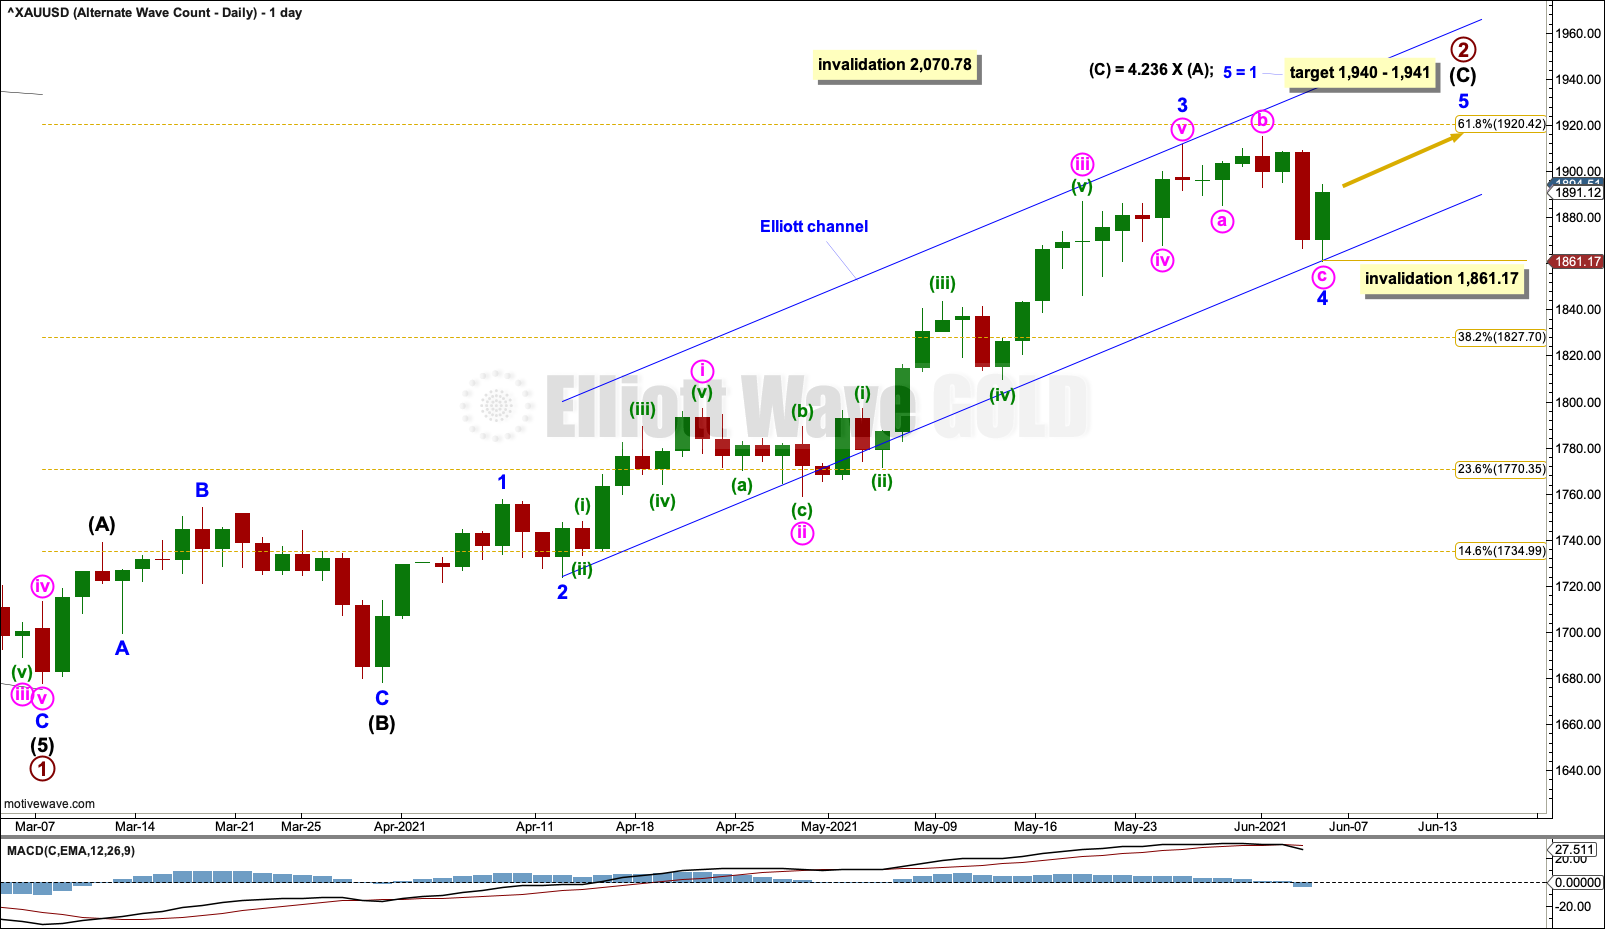
Intermediate wave (C) may be subdividing as an impulse. Minor wave 4 within intermediate wave (C) may now be complete as an expanded flat.
The target for intermediate wave (C) is now calculated at a a second wave degree, so now it widens to a zone.
No second wave correction within minor wave 5 may move beyond the start of its first wave below 1,861.17.
The channel is redrawn using Elliott’s second technique, because minor wave 4 breached a channel drawn using the first technique. Draw the first trend line from the ends of minor waves 2 to 4, then place a parallel copy on the end of minor wave 3. Minor wave 5 may end either mid way within the channel or about the upper edge. When the channel is breached by subsequent downwards movement, then it may then be used to indicate a trend change.
TECHNICAL ANALYSIS
WEEKLY CHART
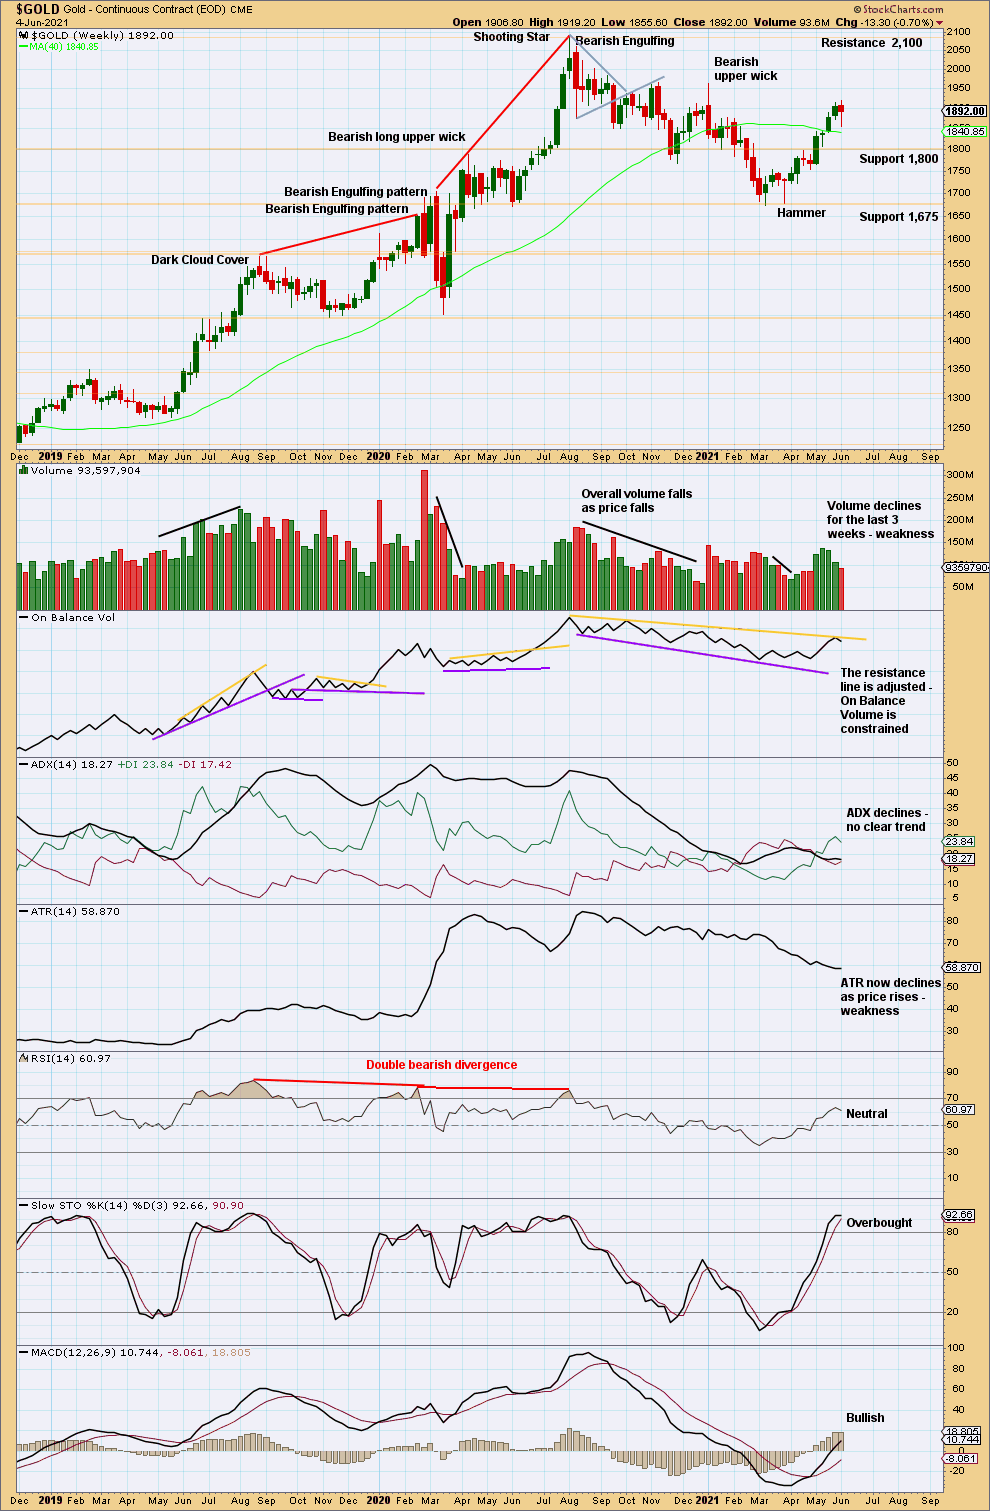
Click chart to enlarge. Chart courtesy of StockCharts.com.
The upwards trend may have ended, for now. There is no bearish candlestick reversal pattern and the trend did not reach extreme. Pullbacks or consolidations here may be more short term in nature.
DAILY CHART
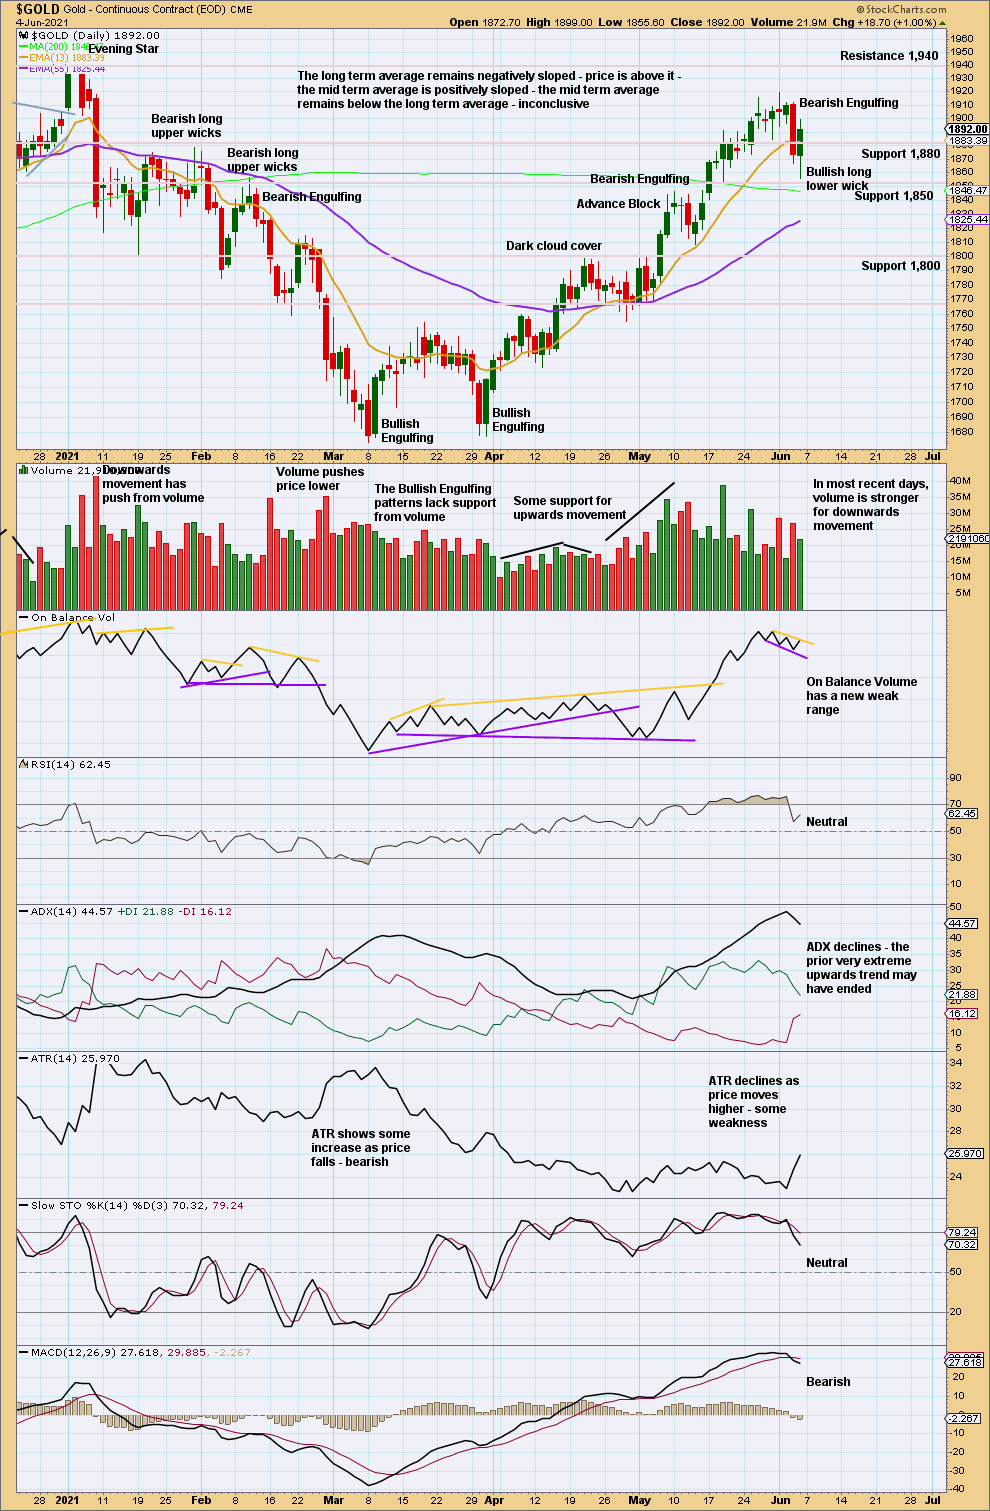
Click chart to enlarge. Chart courtesy of StockCharts.com.
With ADX indicating the prior upwards trend reached very extreme and RSI reaching overbought, a strong Bearish Engulfing pattern now has support from volume. This indicates a trend change here.
A downwards session now closes green with a bullish long lower wick. RSI and ADX are no longer extreme. But if an upwards trend develops again here, then it would very quickly reach extreme and therefore be limited.
GDX WEEKLY CHART
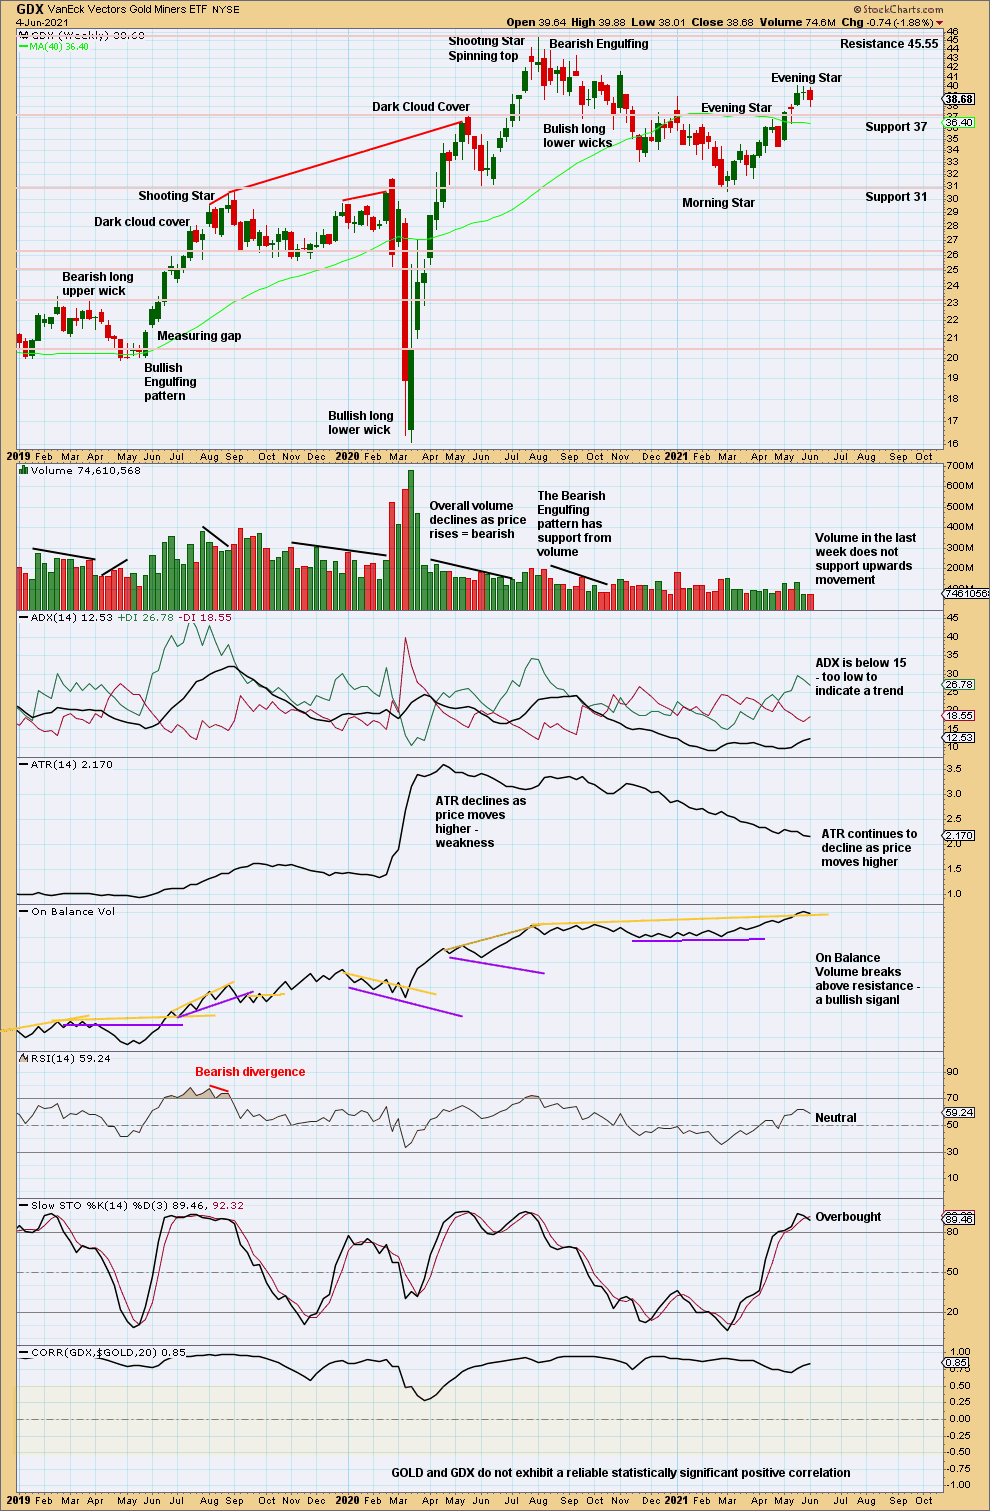
Click chart to enlarge. Chart courtesy of StockCharts.com.
Next resistance is at 45.55.
An Evening Doji Star may be a reversal pattern, but the third candlestick does not have support from volume and the last Evening Doji Star was not followed by a trend change.
If ADX indicates an upwards trend soon, then it would be in an early stage; there would be a long time and distance to go before it may become extreme.
GDX DAILY CHART
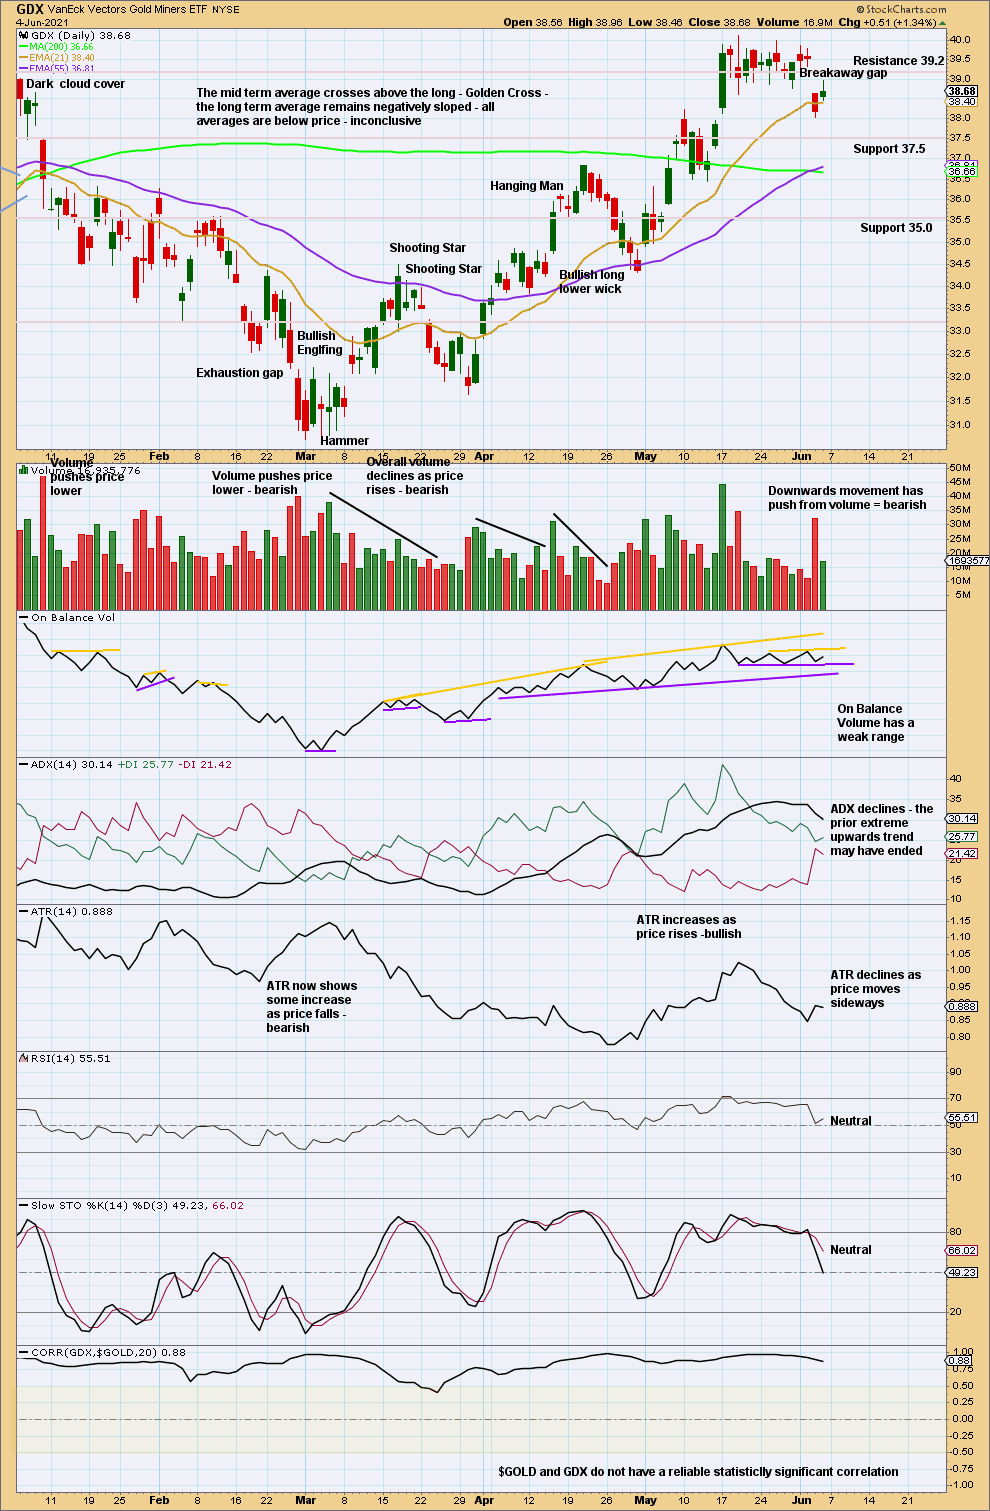
Click chart to enlarge. Chart courtesy of StockCharts.com.
The breakaway gap at 39.34 may offer resistance. Price may continue to fall to support at 37.50.
US OIL
An upwards week closes above prior resistance.
The alternate Elliott wave count from last week now looks likely.
Summary: The main Elliott wave count expects upwards movement to continue to 87.90.
The alternate Elliott wave count allows for a deep pullback here to 54.86 – 54.42 before the upwards trend resumes.
The larger trend remains up.
Oil may have found a major sustainable low in April 2020.
ELLIOTT WAVE COUNT
MONTHLY CHART
Click chart to enlarge.
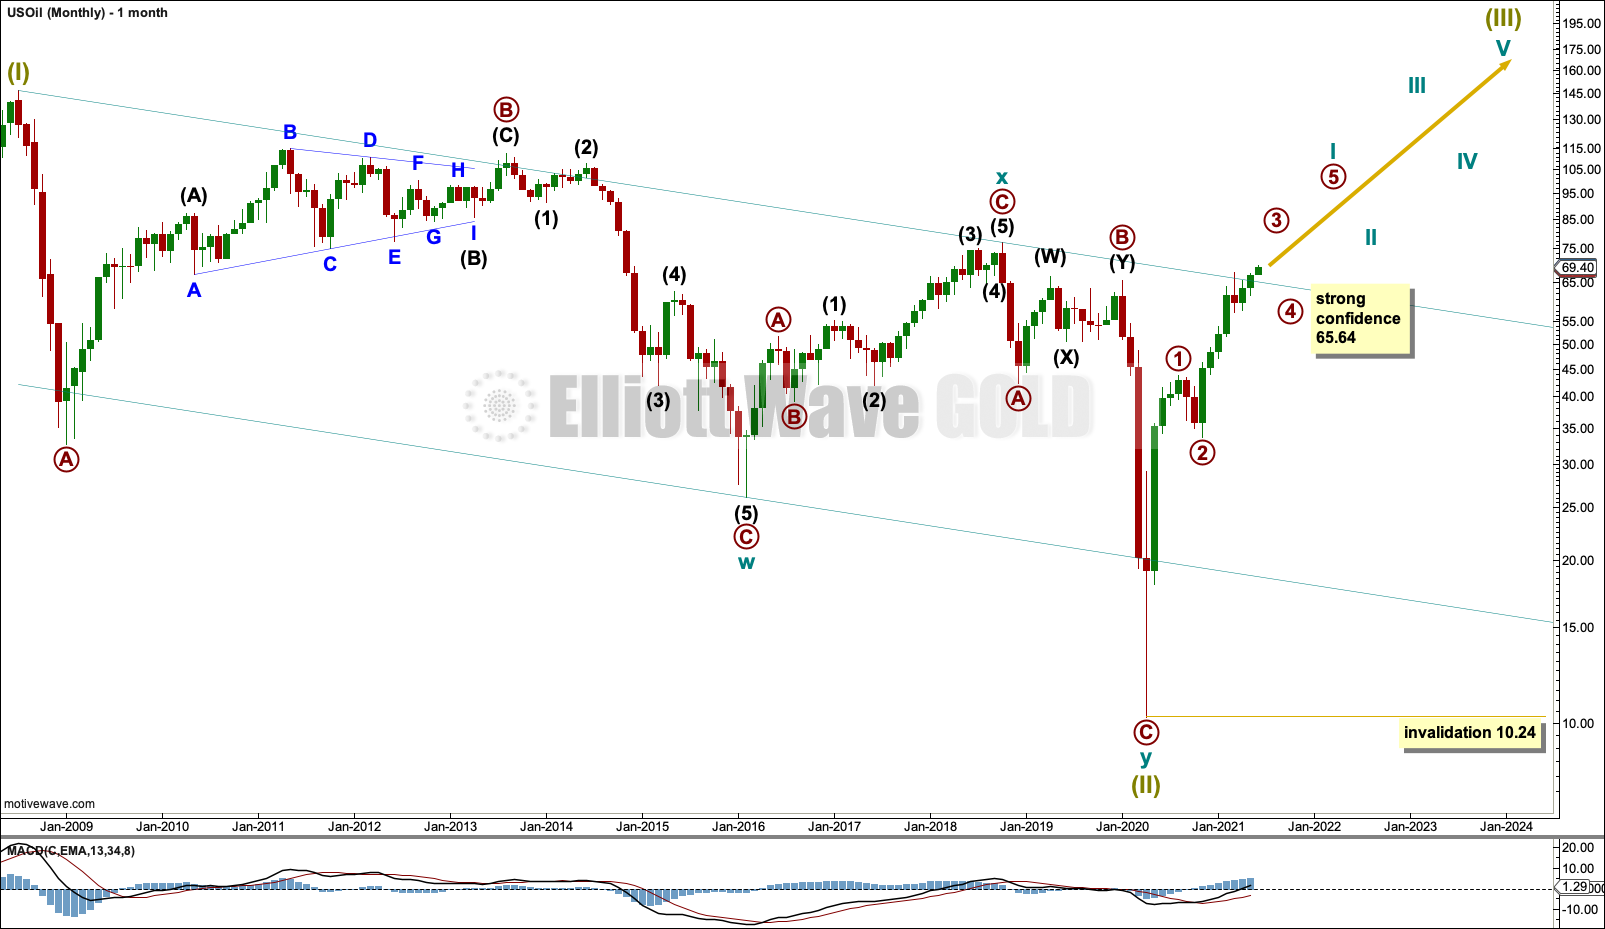
The basic Elliott wave structure is five steps forward and three steps back. This Elliott wave count expects that US Oil has completed a three steps back pattern, which began in July 2008. The Elliott wave count expects that the bear market for US Oil may now be over.
Following Super Cycle wave (II), which was a correction (three steps back), Super Cycle wave (III), which may have begun, should be five steps up when complete. Super Cycle wave (III) may last a generation and must make a new high above the end of Super Cycle wave (I) at 146.73.
A channel is drawn about Super Cycle wave (II): draw the first trend line from the start of cycle wave w to the end of cycle wave x, then place a parallel copy on the end of cycle wave w. This trend line is breached to the downside, which is a typical look for the end of a movement for a commodity.
The upper edge of the channel may provide resistance. Price is reacting down from the upper edge of this channel.
Super Cycle wave (III) may only subdivide as a five wave impulse. New trends for Oil usually start out very slowly with short first waves and deep time consuming second wave corrections. However, while this is a common tendency, it is not always seen and may not have been seen in this instance. The first reasonably sized pullback may be over already.
WEEKLY CHART
Click chart to enlarge.
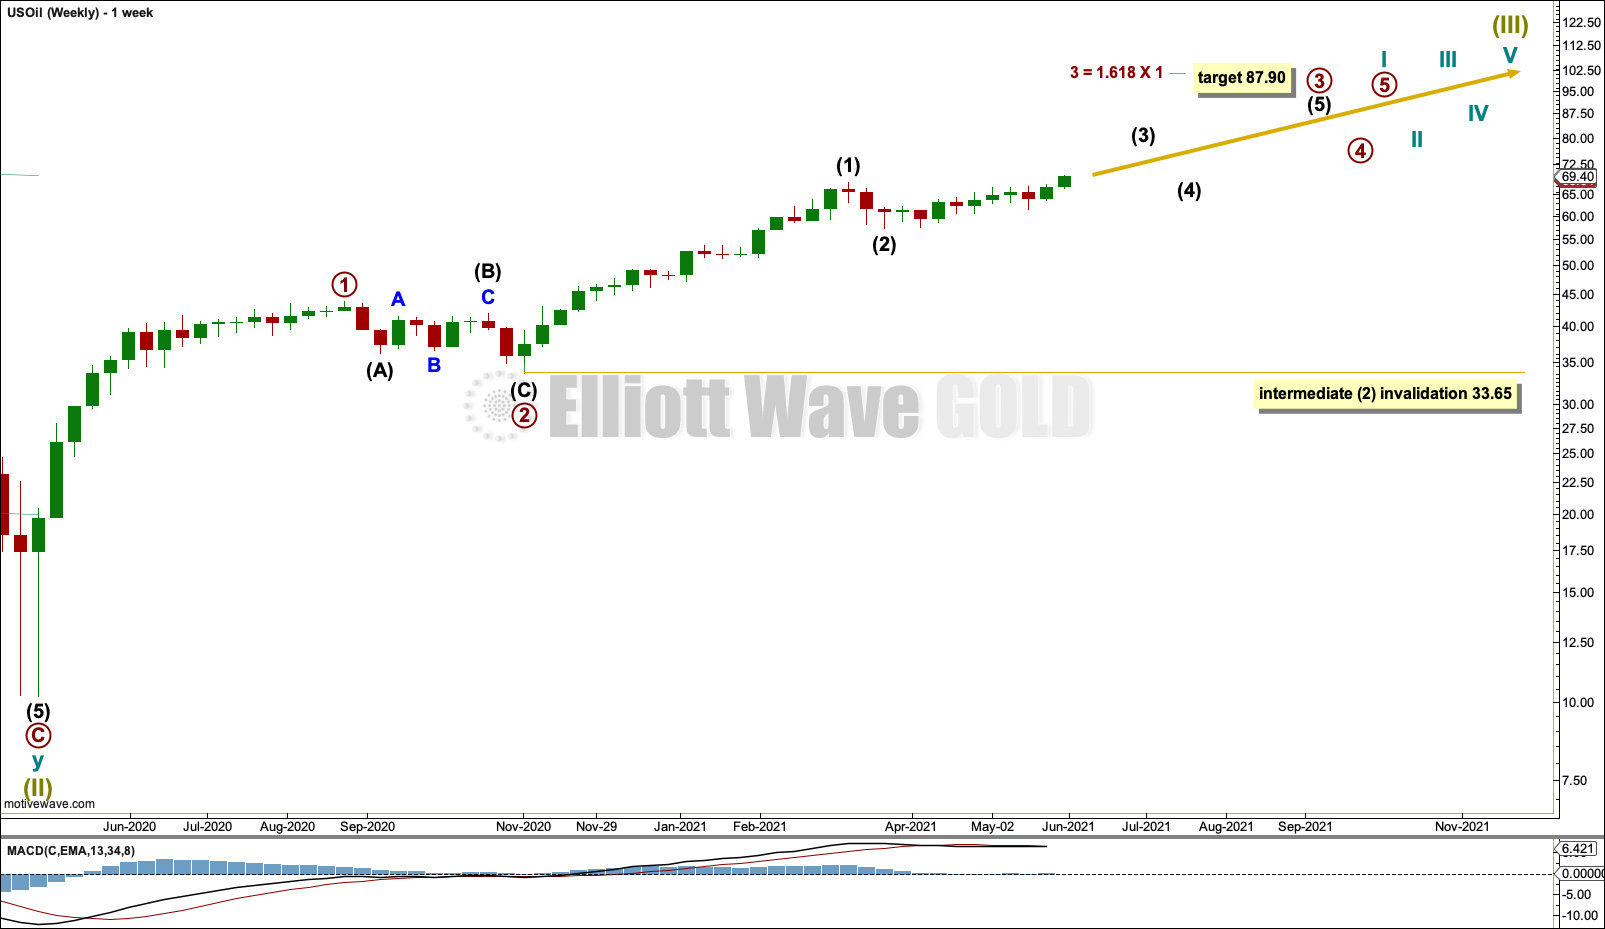
Super Cycle wave (III) must subdivide as an impulse.
Cycle wave I within Super Cycle wave (III) may be incomplete.
Within cycle wave I: Primary waves 1 and 2 may be complete, and primary wave 3, which may only subdivide as an impulse, may have begun.
Within primary wave 3: Intermediate waves (1) and (2) may be complete. If it continues lower, then intermediate wave (2) may not move beyond the start of intermediate wave (1) below 33.65.
MAIN DAILY CHART
Click chart to enlarge.
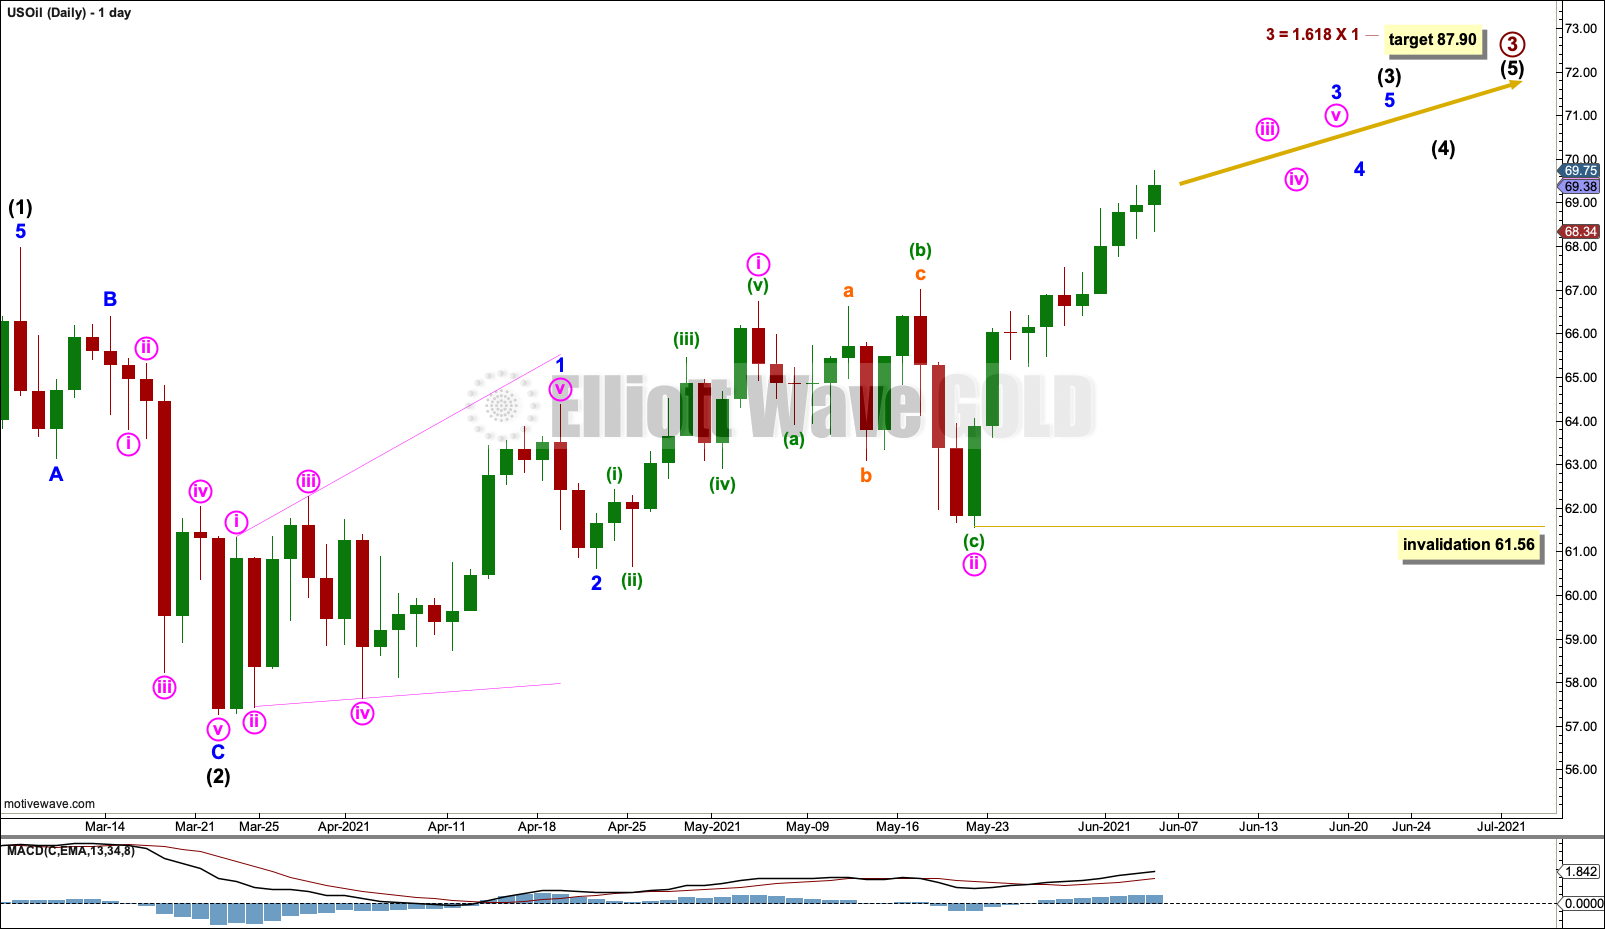
It is possible that intermediate wave (2) was over as a brief and shallow zigzag.
This wave count must see the downwards wave ending on 23rd of March as a three, but this movement looks best as a five. For this reason an alternate below is still considered.
If intermediate wave (3) has begun, then minor wave 1 within it may be a complete leading expanding diagonal. Leading expanding diagonals are less common than impulses. This reduces the probability of this wave count.
Minor wave 3 may only subdivide as an impulse. Within minor wave 3: Minute waves i and ii may be complete, minute wave iii may only subdivide as an impulse, and no second wave correction within minute wave iii may move beyond its start below 61.56.
ALTERNATE DAILY CHART
Click chart to enlarge.
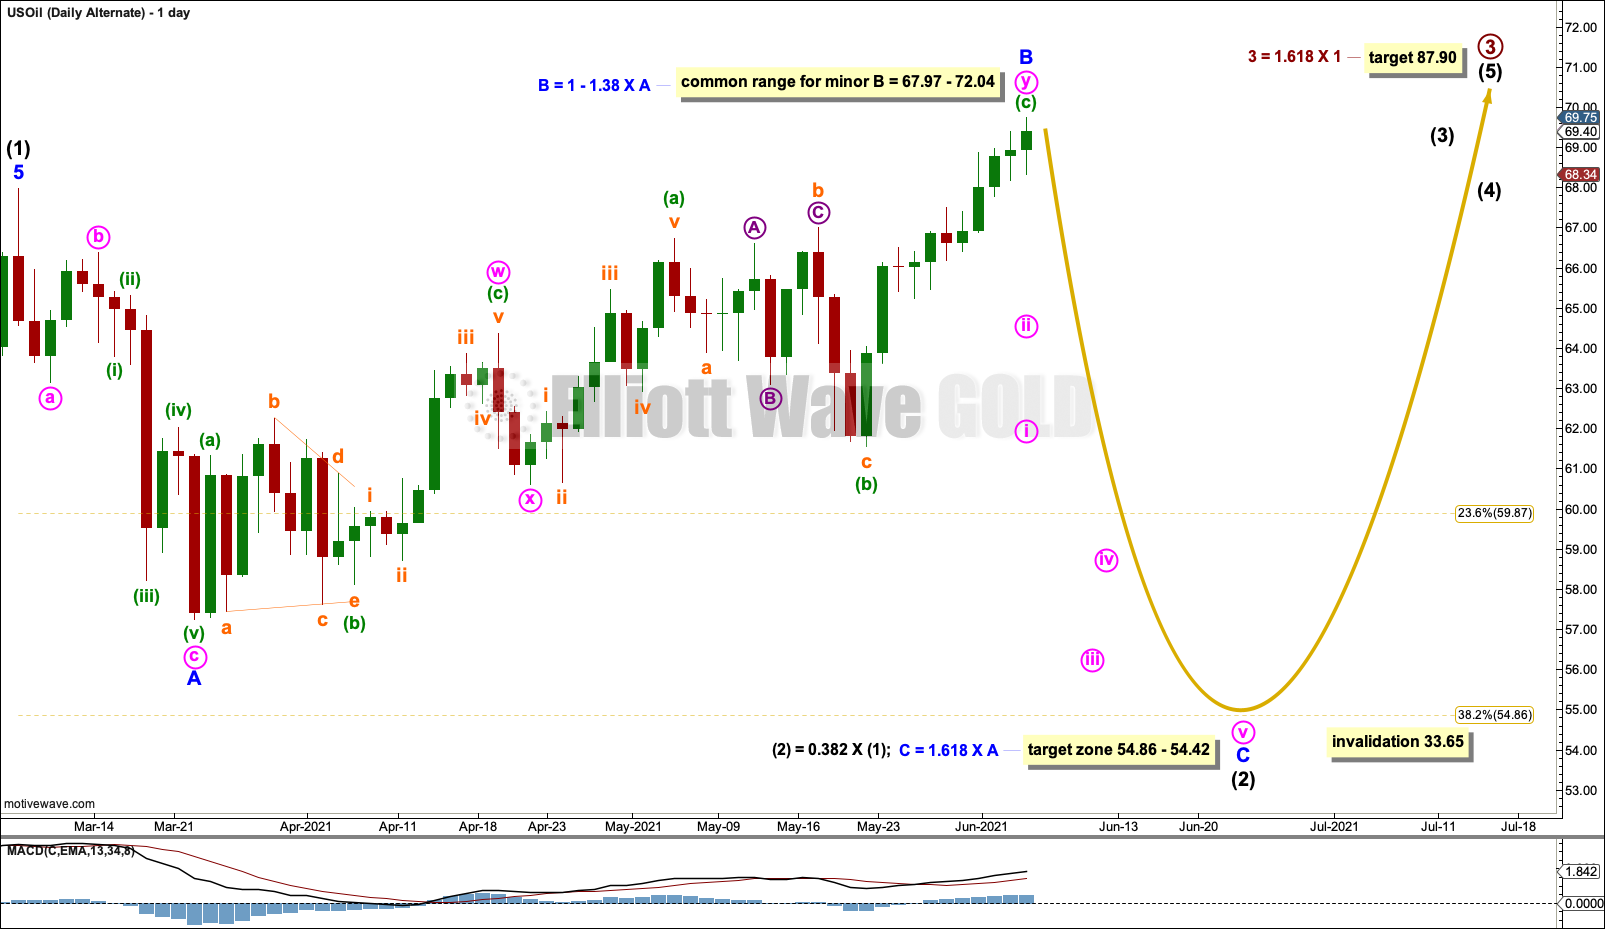
Intermediate wave (2) may be continuing as a flat.
Within a flat the common range for minor wave B would be from 67.97 to 72.04. Minor wave B may make a new high beyond the start of minor wave A, as in an expanded flat. If minor wave B is complete at this week’s high, then intermediate wave (2) may be unfolding as a regular flat. Minor wave B remains within this most common range.
Minor wave C would be likely to make at least a slight new low below the end of minor wave A at 57.26 to avoid a truncation.
Intermediate wave (2) may not move beyond the start of intermediate wave (1) below 33.65.
ALTERNATE WEEKLY CHART
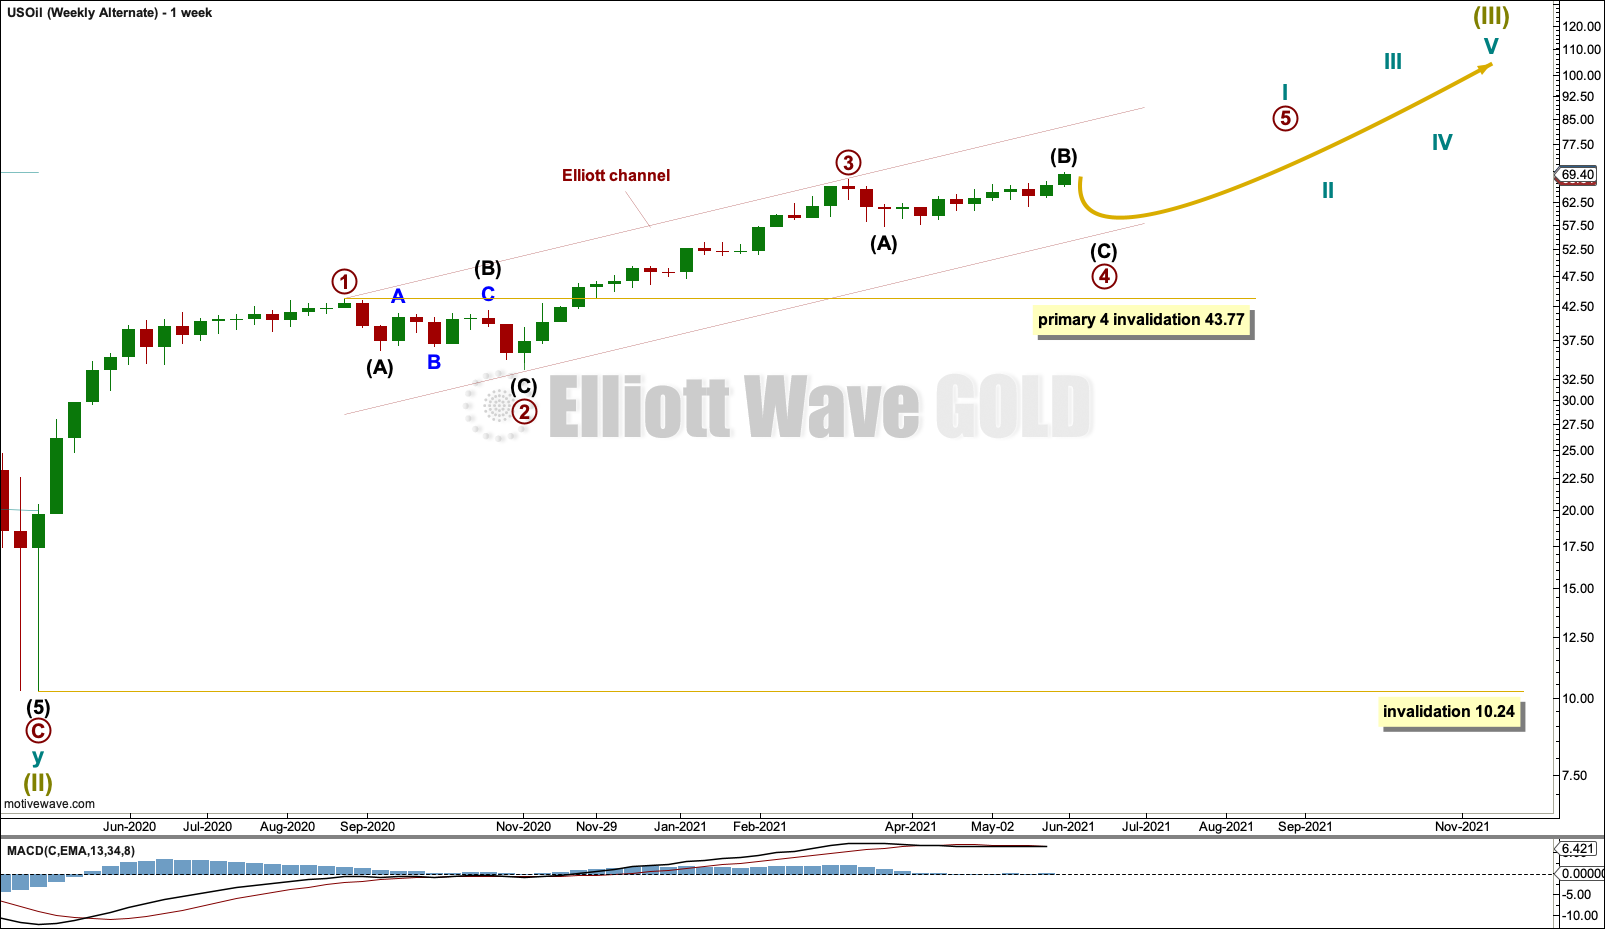
Click chart to enlarge.
This alternate wave count considers the possibility that primary wave 3 may have been over at the last high.
Primary wave 3 is close to equal in length with primary wave 1; it is 0.79 longer than primary wave 1.
Primary wave 4 may be continuing as a flat, triangle or combination. The daily charts for this alternate wave count would look the same as the daily charts above, the degree of labelling would be one degree higher.
TECHNICAL ANALYSIS
WEEKLY CHART
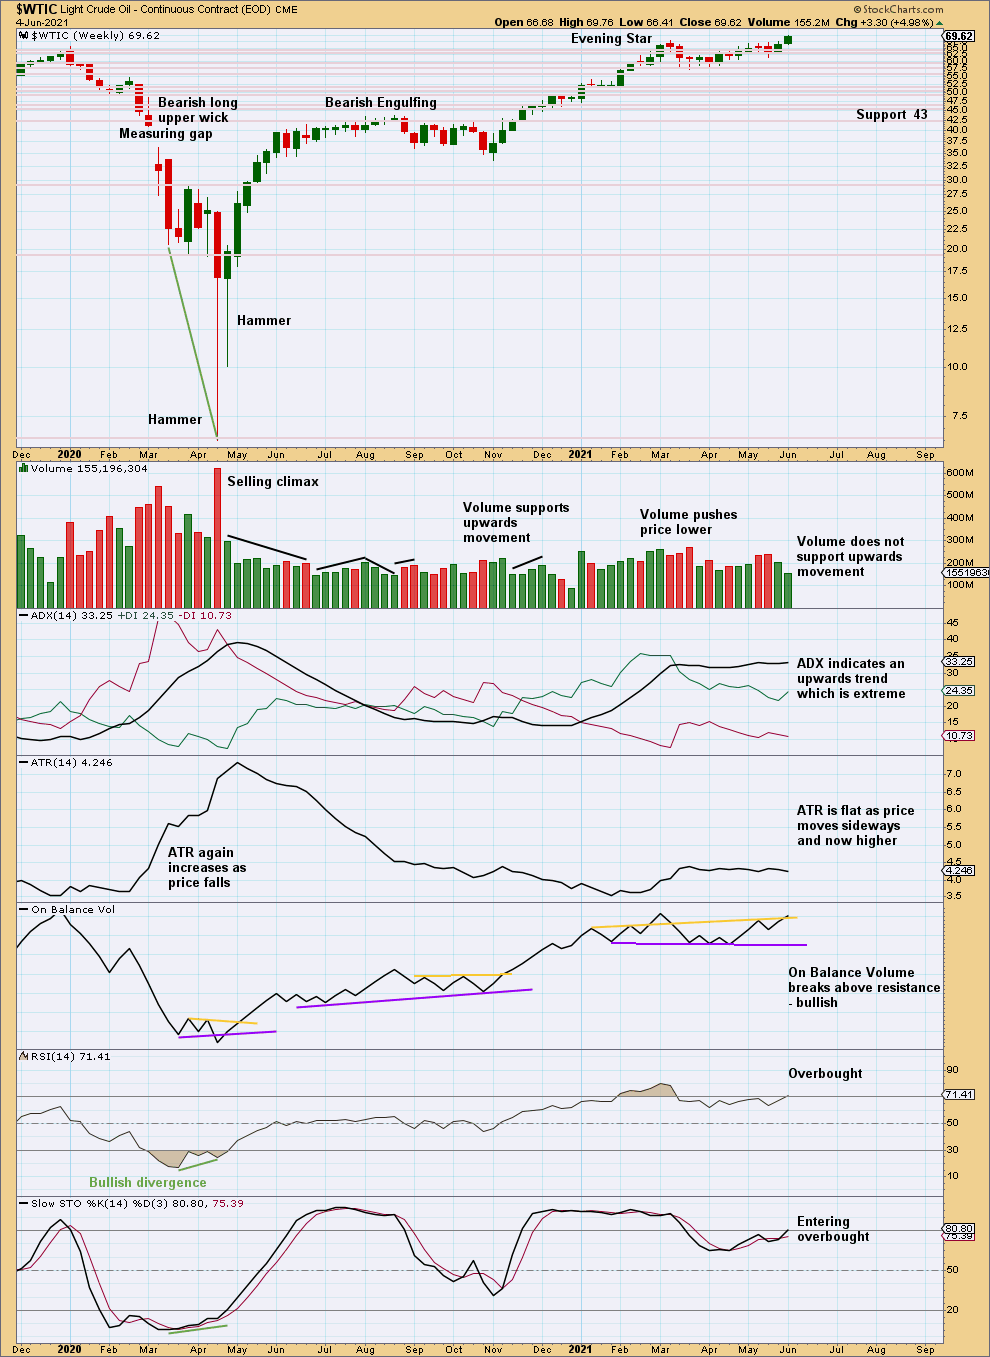
Click chart to enlarge. Chart courtesy of StockCharts.com.
An upwards week has closed above prior resistance. Volume does not support upwards movement, but the price history of this market shows that volume may not support upwards movement within an early stage of a new bullish movement yet that movement may be sustainable.
A bullish signal by On Balance Volume supports the main Elliott wave count.
DAILY CHART
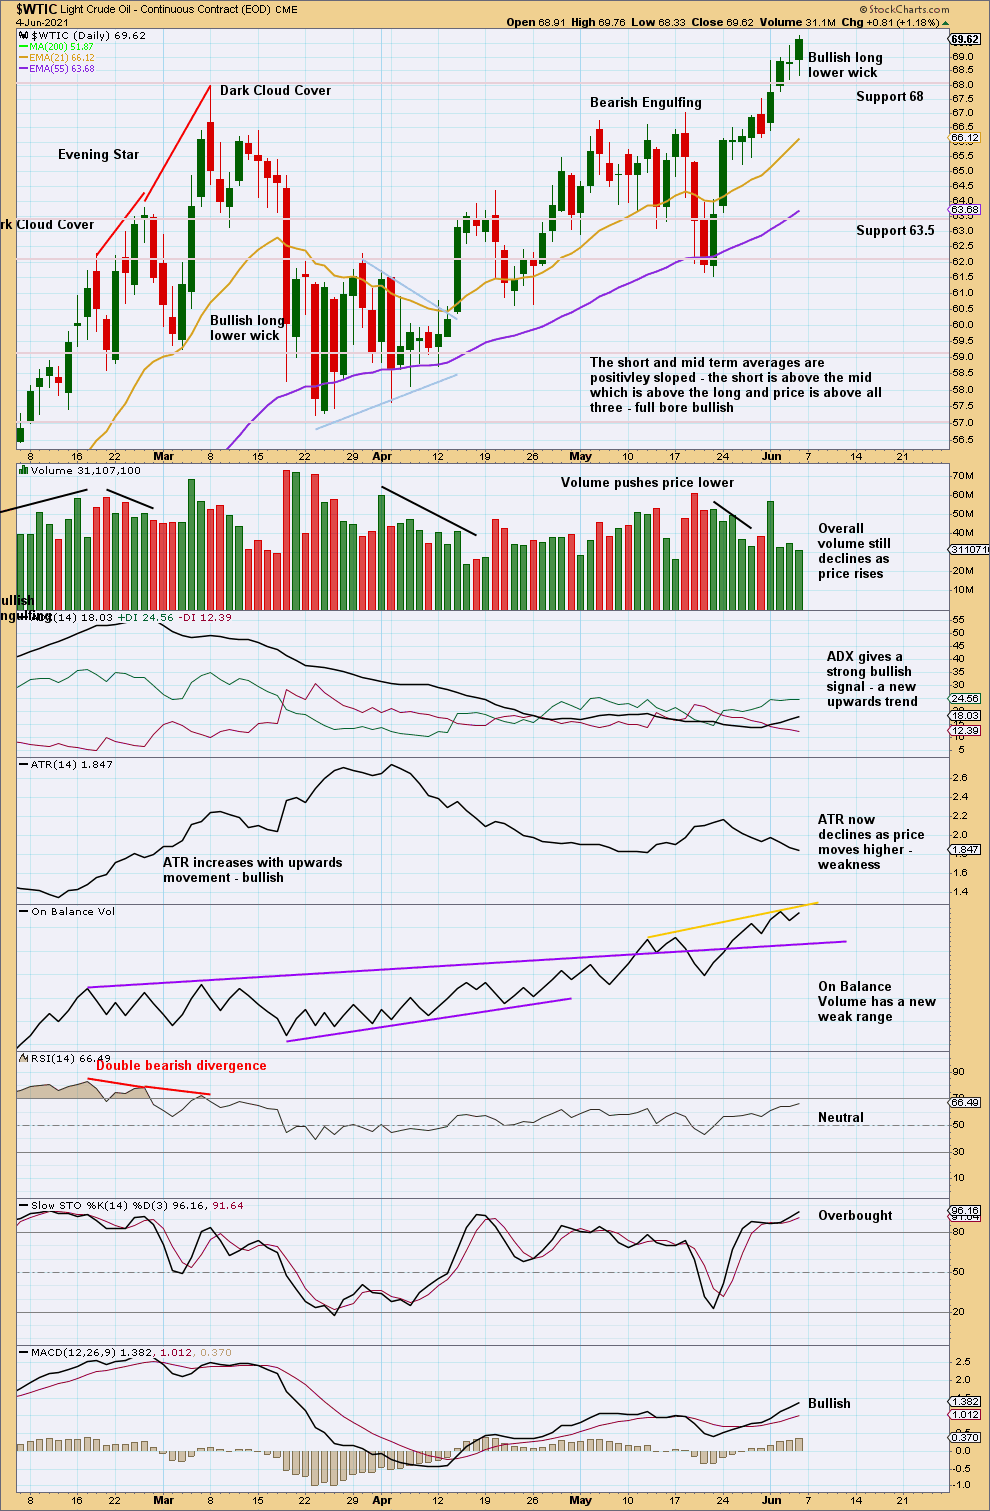
Click chart to enlarge. Chart courtesy of StockCharts.com.
There is again an upwards trend in a relatively early stage.
—
Always practice good risk management as the most important aspect of trading. Always trade with stops and invest only 1-5% of equity on any one trade. Failure to manage risk is the most common mistake new traders make.
—