
GOLD: Elliott Wave and Technical Analysis | Charts – July 9, 2021
An inside day continues sideways movement. Either a pullback or a consolidation was expected for this week; overall, sideways movement fits expectations. The Elliott wave count now focusses on when this consolidation may be over.
Summary: A multi-week to multi-month bounce may have begun. A target for resistance is at 1,814 or 1,853.
For the short term, a B wave may now continue most likely sideways for another one to few sessions. It may remain above 1,752.19.
Grand SuperCycle analysis and last monthly charts are here.
MAIN ELLIOTT WAVE COUNT
WEEKLY CHART
Click chart to enlarge.
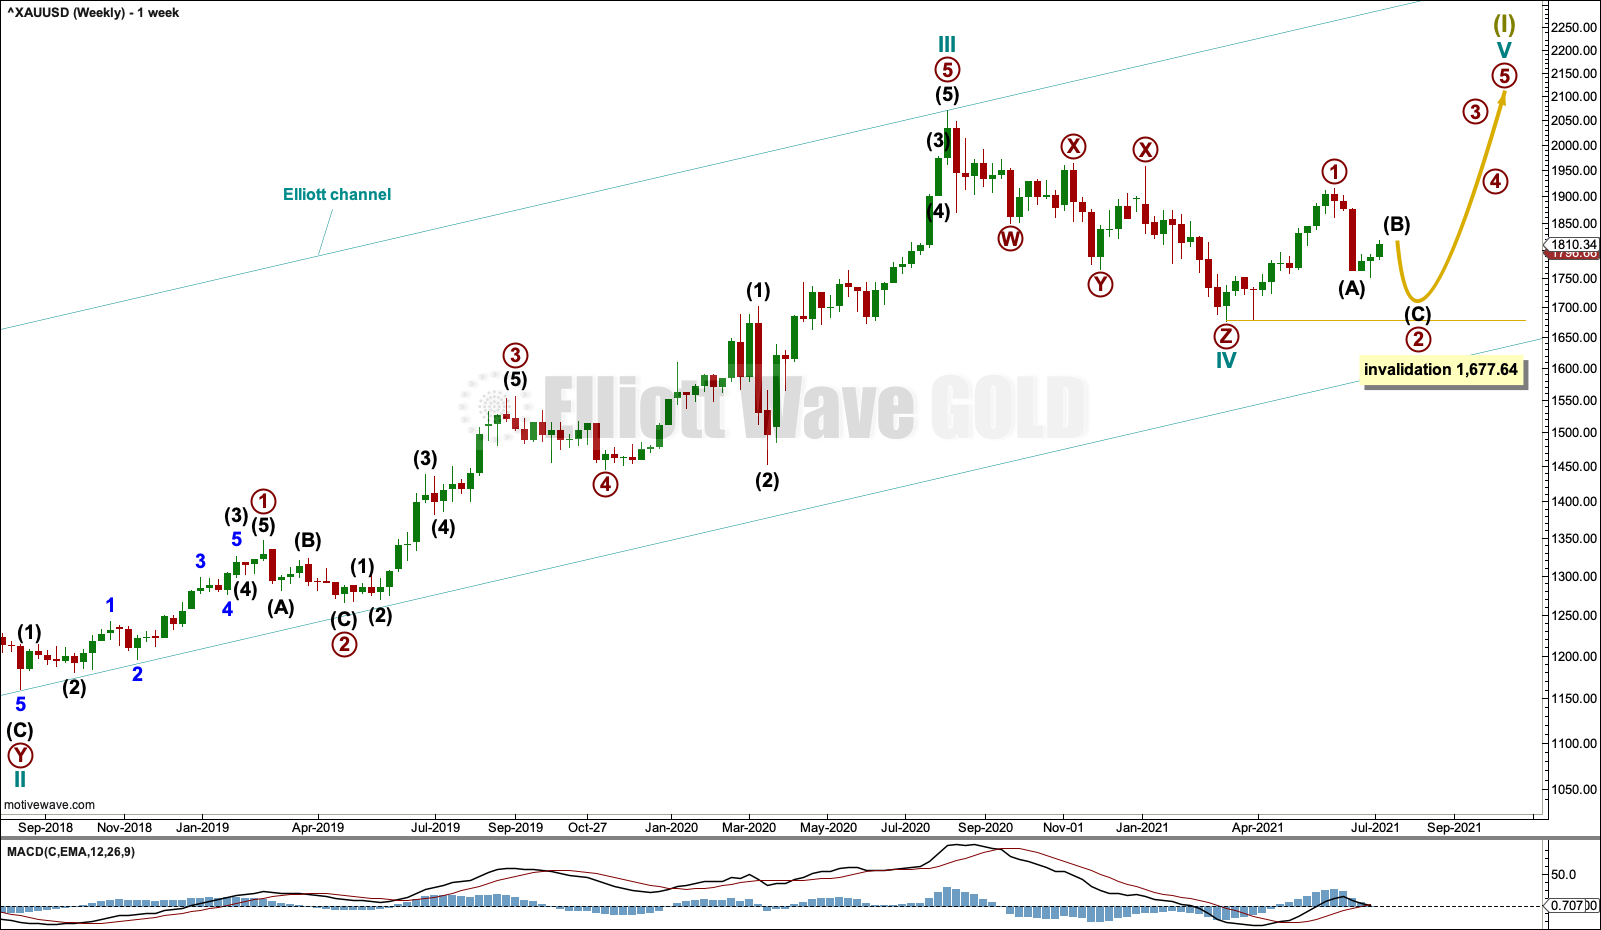
This wave count sees the the bear market complete at the last major low for Gold on 3 December 2015.
If Gold is in a new bull market, then it should begin with a five wave structure upwards on the weekly chart.
Cycle wave I fits as a five wave impulse with reasonably proportionate corrections for primary waves 2 and 4.
Cycle wave II fits as a double flat. However, within the first flat correction labelled primary wave W, this wave count needs to ignore what looks like an obvious triangle from July to September 2016 (this can be seen labelled as a triangle on the second weekly chart on prior analysis here). This movement must be labelled as a series of overlapping first and second waves. Ignoring this triangle reduces the probability of this wave count in Elliott wave terms.
Cycle wave IV may be a complete triple zigzag. Triple zigzags are not rare structures, but they are not common. The probability of this wave count is further reduced in Elliott wave terms. This is one reason why an alternate is still considered.
Cycle wave V may have begun. Within cycle wave V: Primary wave 1 may be over at the last high, and primary wave 2 may not move beyond the start of primary wave 1 below 1,677.64.
DAILY CHART
Click chart to enlarge.
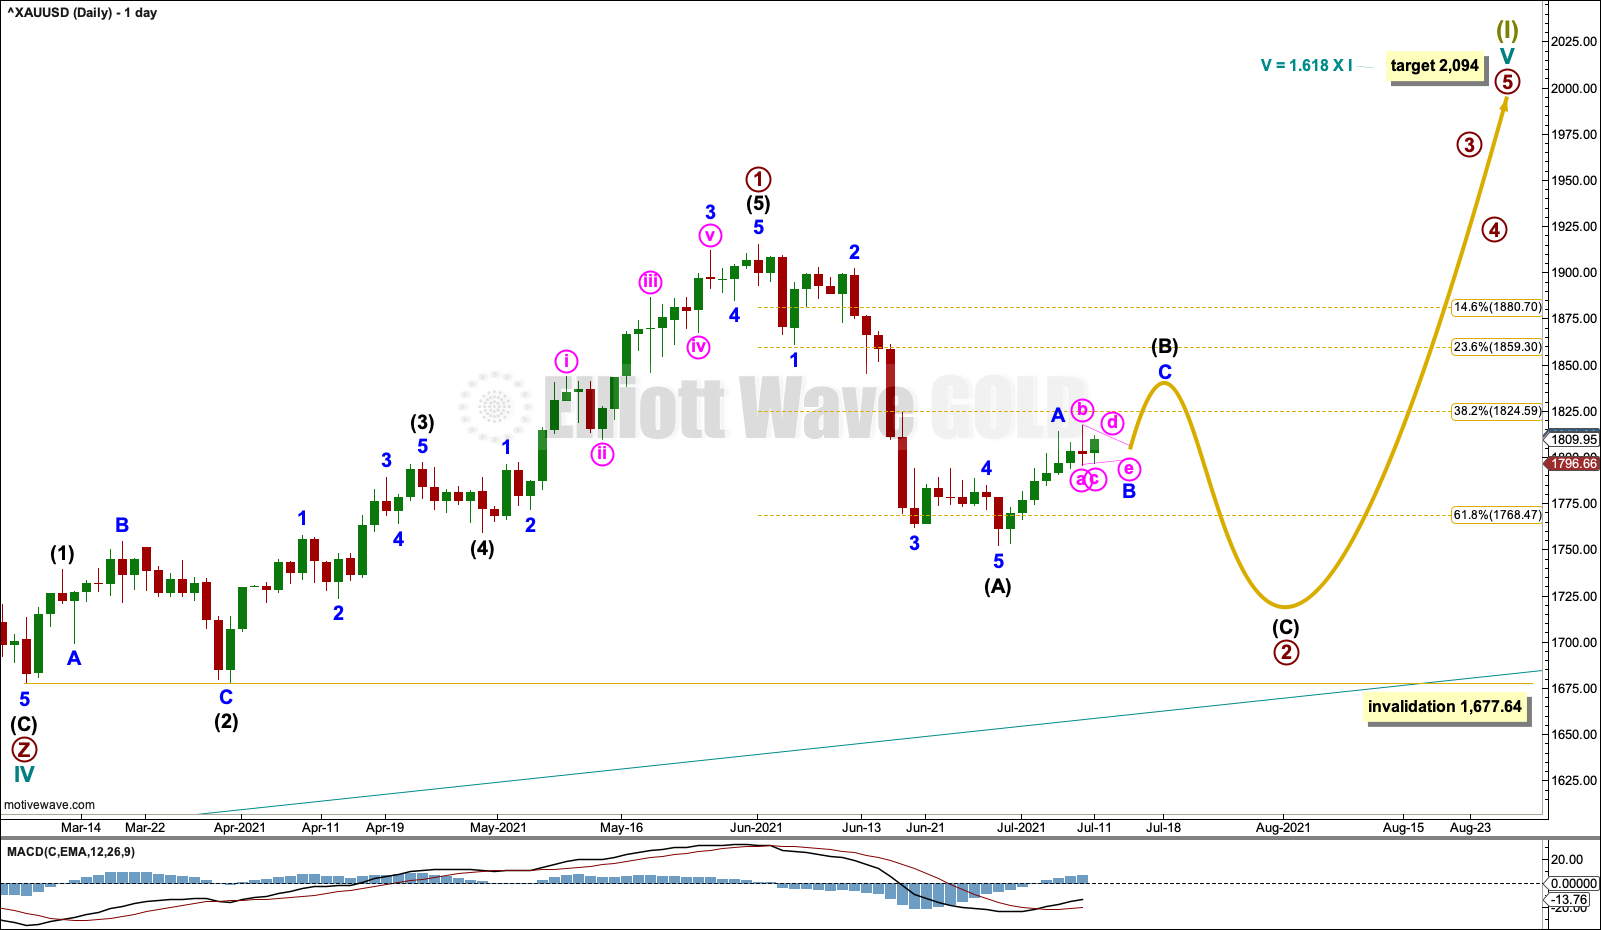
A target is calculated for cycle wave V. If this target is wrong for this wave count, then it may be too low. As price approaches the target, if the structure is incomplete, then a higher target may be calculated.
Primary wave 1 within cycle wave V may be complete.
Primary wave 2 may be an incomplete zigzag. Within primary wave 2: Intermediate wave (A) may be complete, and intermediate wave (B) may unfold over a few weeks. Thereafter, intermediate wave (C) may continue lower and should make a new low below the end of intermediate wave (A) to avoid a truncation. When the end of intermediate wave (B) and the start of intermediate wave (C) is known, then the Fibonacci ratio between intermediate waves (A) and (C) may be used to calculate a target for intermediate wave (C).
Within intermediate wave (B): Minor wave A may now be complete, and minor wave B may now continue lower or sideways for a few sessions to about two weeks. B waves within B waves are extremely difficult to analyse; the structure of minor wave B may not be known until it is complete. Combinations and expanded flats are common structures for B waves within B waves.
Primary wave 2 may not move beyond the start of primary wave 1 below 1,677.64.
HOURLY CHART
Click chart to enlarge.
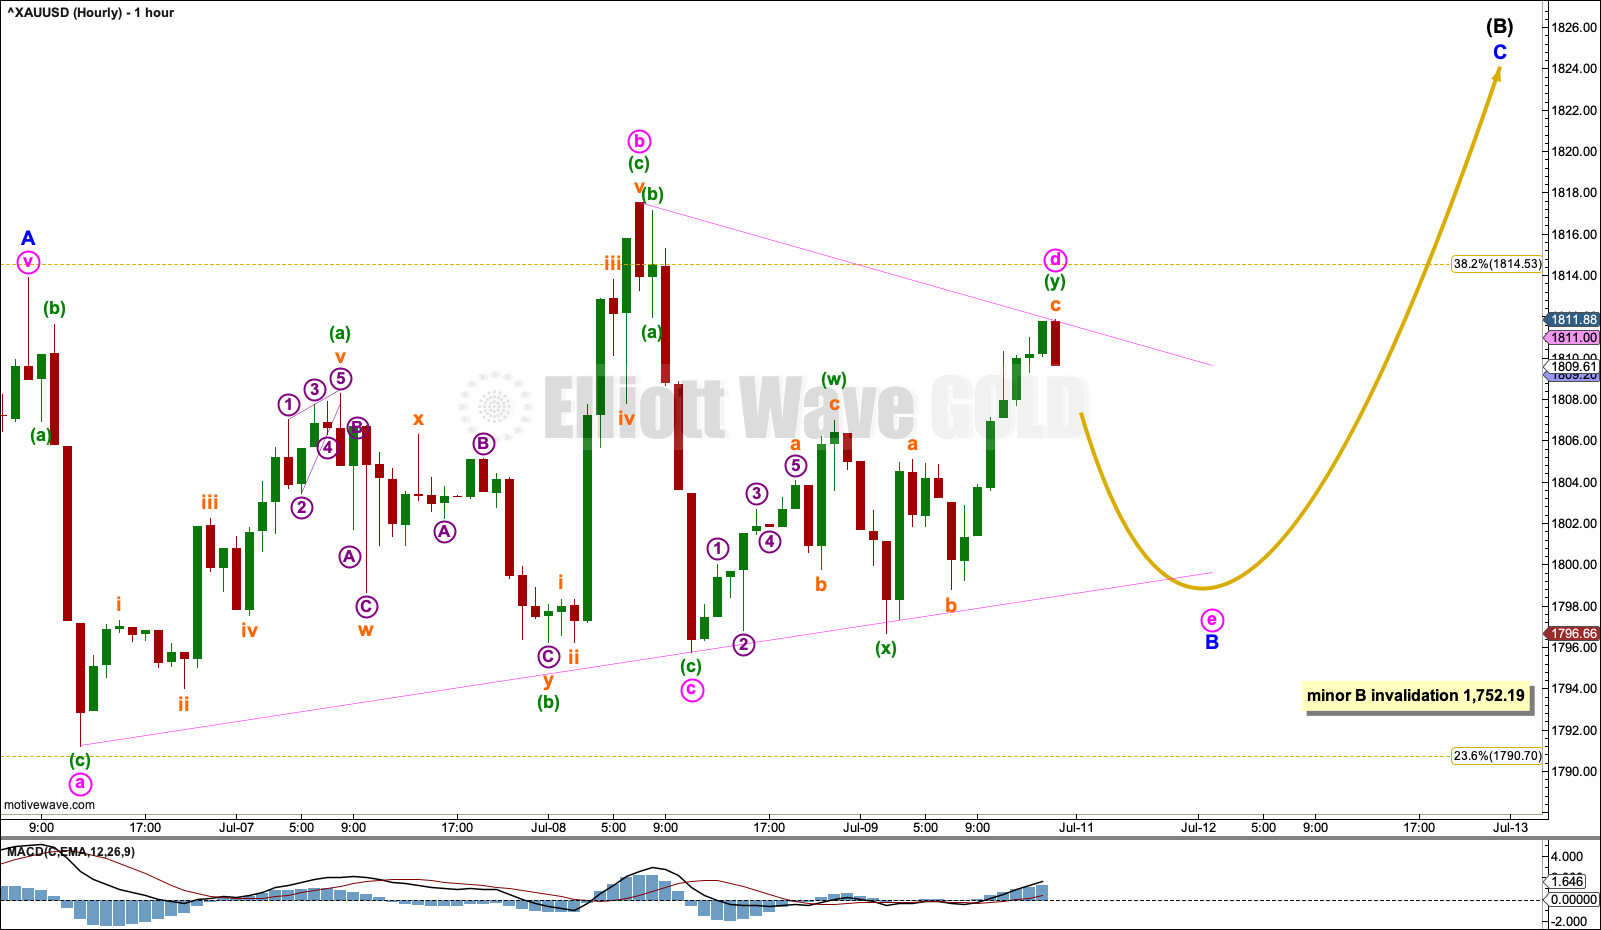
Intermediate wave (B) may subdivide as any one of more than 23 possible corrective structures. By a wide margin the most common Elliott wave corrective structure is a zigzag, so that shall be how intermediate wave (B) is labelled at the start. As it continues, alternate Elliott wave counts may be required to consider other Elliott wave structures.
If intermediate wave (B) subdivides as a zigzag, then within it minor wave A must subdivide as a five wave motive structure, most likely an impulse.
At this stage, minor wave B may be continuing sideways as a running contracting triangle. Within the triangle, minute wave e may not move below the end of minute wave c at 1,795.76. Minute wave e may end either short of the a-c trend line (most likely) or with an overshoot of the a-c trend line (less likely).
It remains possible that minor wave B may yet complete as a combination or expanded flat. A new low below 1,795.76 would indicate either of these structures may be unfolding.
If minor wave A is correctly labelled as a five wave impulse, then minor wave B may not move beyond its start below 1,752.19.
ALTERNATE ELLIOTT WAVE COUNT
WEEKLY CHART
Click chart to enlarge.
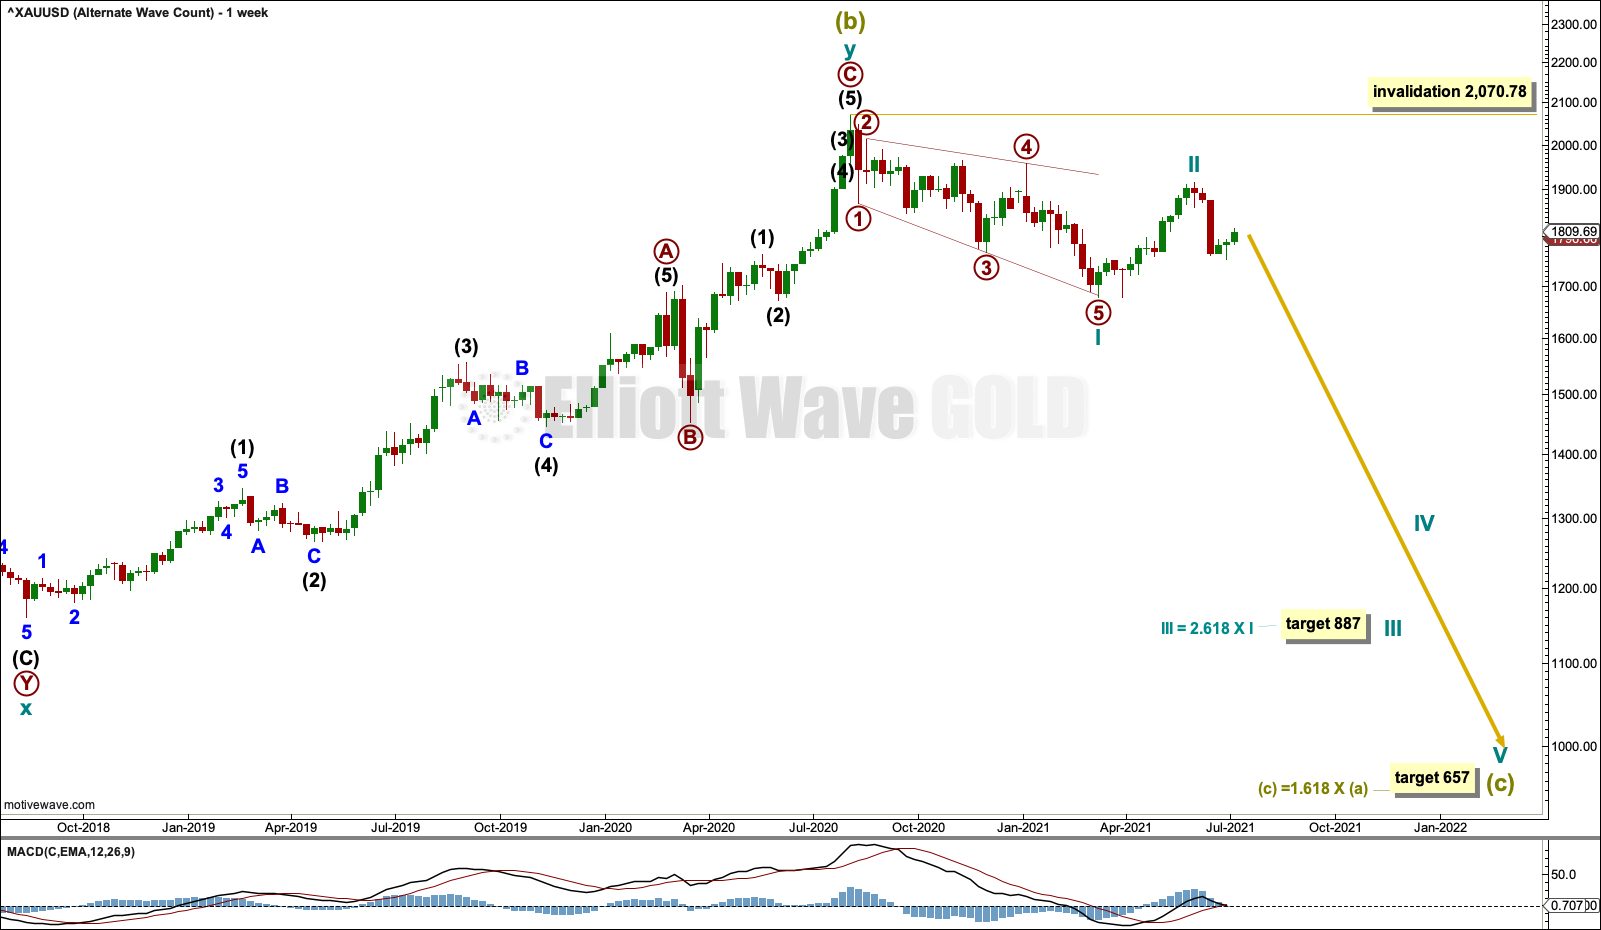
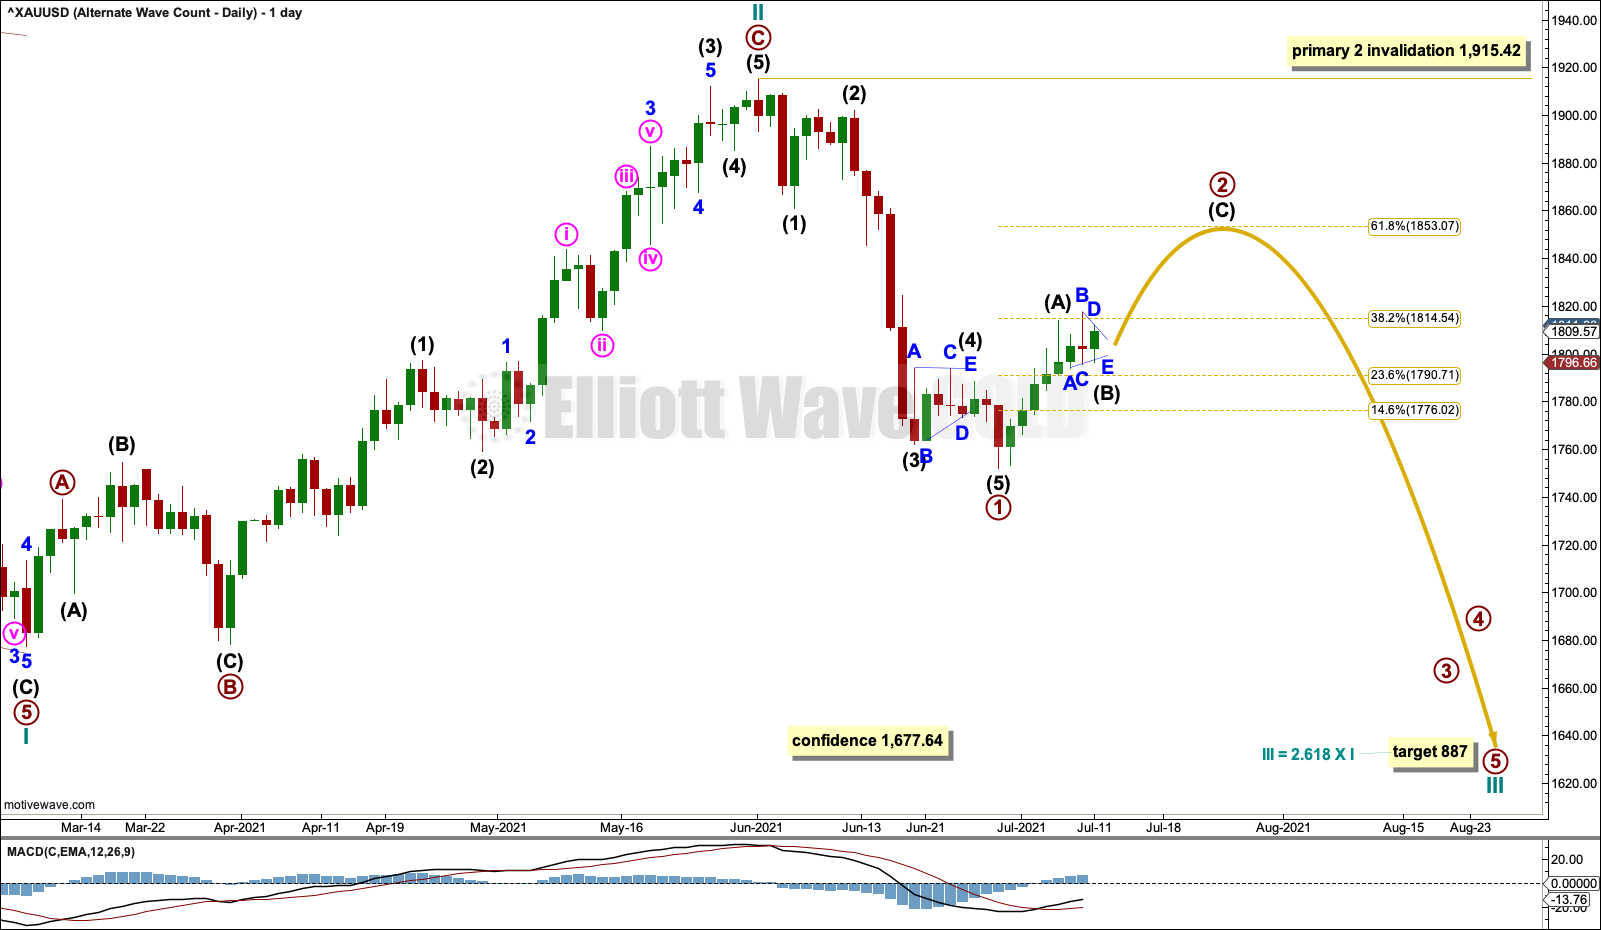
The bigger picture for this alternate Elliott wave count sees Gold as within a bear market, in a three steps back pattern that is labelled Grand Super Cycle wave IV on monthly charts. Grand Super Cycle wave IV may be subdividing as an expanded flat pattern.
Super Cycle wave (b) within Grand Super Cycle wave IV may be a complete double zigzag. This wave count expects Super Cycle wave (c) to move price below the end of Super Cycle wave (a) at 1,046.27 to avoid a truncation and a very rare running flat. The target calculated expects a common Fibonacci ratio for Super Cycle wave (c).
Super Cycle wave (c) may have begun with a leading expanding diagonal for cycle wave I. Leading expanding diagonals in first wave positions are uncommon, so the probability of this wave count is reduced. However, it has a good fit and must be considered.
Second wave corrections to follow leading diagonals in first wave positions are usually very deep. Cycle wave II is deep and the structure may be complete; so far it is following a common pattern. If it continues higher, then cycle wave II may not move beyond the start of cycle wave I above 2,070.78.
DAILY CHART
Click chart to enlarge.
A target is calculated for cycle wave III.
Primary wave 1 within cycle wave III may be complete.
Primary wave 2 may last weeks to months. Targets for resistance are the 0.382 Fibonacci ratio at 1,814.54 and the 0.618 Fibonacci ratio at 1,853.07.
Primary wave 2 may not move beyond the start of primary wave 1 above 1,915.42.
Primary wave 2 may be subdividing as a zigzag. Intermediate wave (B) within primary wave 2 may now continue sideways most likely as a triangle. B waves are the most difficult to analyse as they exhibit the greatest variety in Elliott wave structure and price behaviour. It is usually not possible to know which structure a B wave has sub-divided as until it is complete.
HOURLY CHART

Click chart to enlarge.
Primary wave 2 may unfold as any Elliott wave corrective structure except a triangle. The most common corrective structure by a wide margin is a zigzag. Primary wave 2 will be labelled as a possible zigzag, but alternate wave counts for alternate structures may be required in coming weeks.
If primary wave 2 subdivides as a zigzag, then intermediate wave (A) must subdivide as a five wave motive structure, most likely an impulse.
Intermediate wave (A) may now be a complete impulse.
Intermediate wave (B) may be subdividing a running triangle as labelled. Within the triangle, minor wave E may not move below the end of minor wave C below 1,795.76. A new low below 1,795.76 would indicate intermediate wave (B) may continue lower as an expanded flat, or sideways as a double combination. It remains possible that intermediate wave (B) may still need to be relabelled.
If intermediate wave (A) is correctly labelled as a five wave structure, then intermediate wave (B) may not move beyond its start below 1,752.19.
TECHNICAL ANALYSIS
WEEKLY CHART
Click chart to enlarge. Chart courtesy of StockCharts.com.
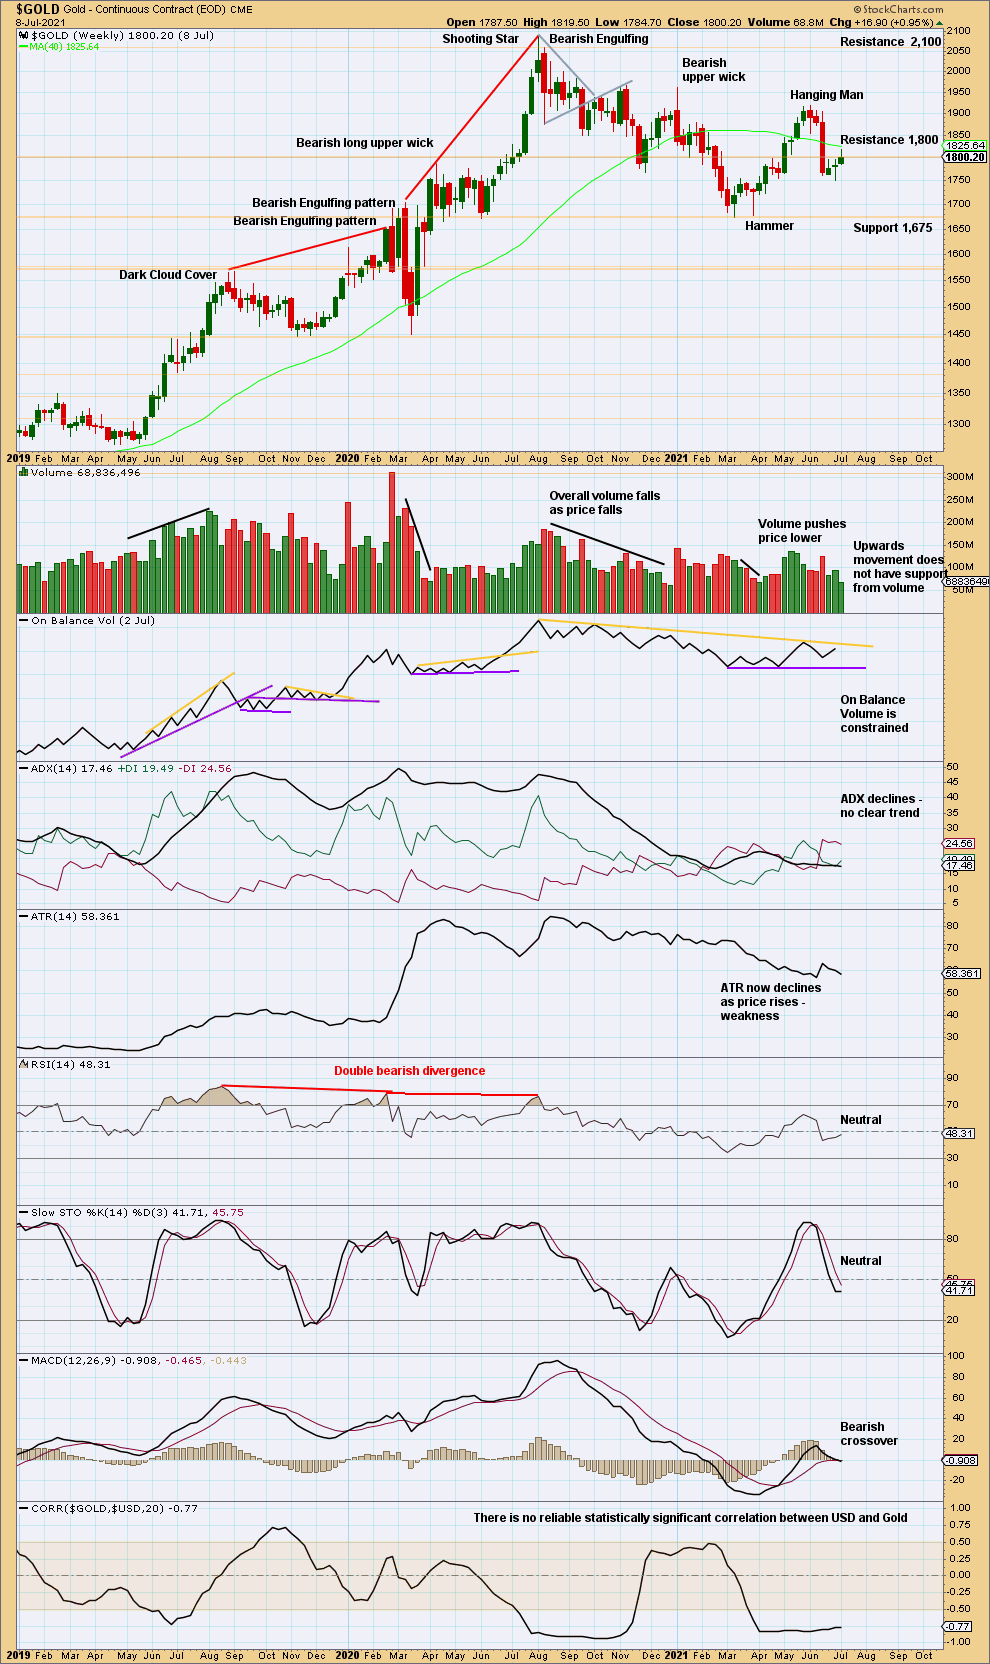
Volume declines this week as price moves higher and On Balance Volume is at resistance. Price may react downwards next week.
DAILY CHART
Click chart to enlarge. Chart courtesy of StockCharts.com.
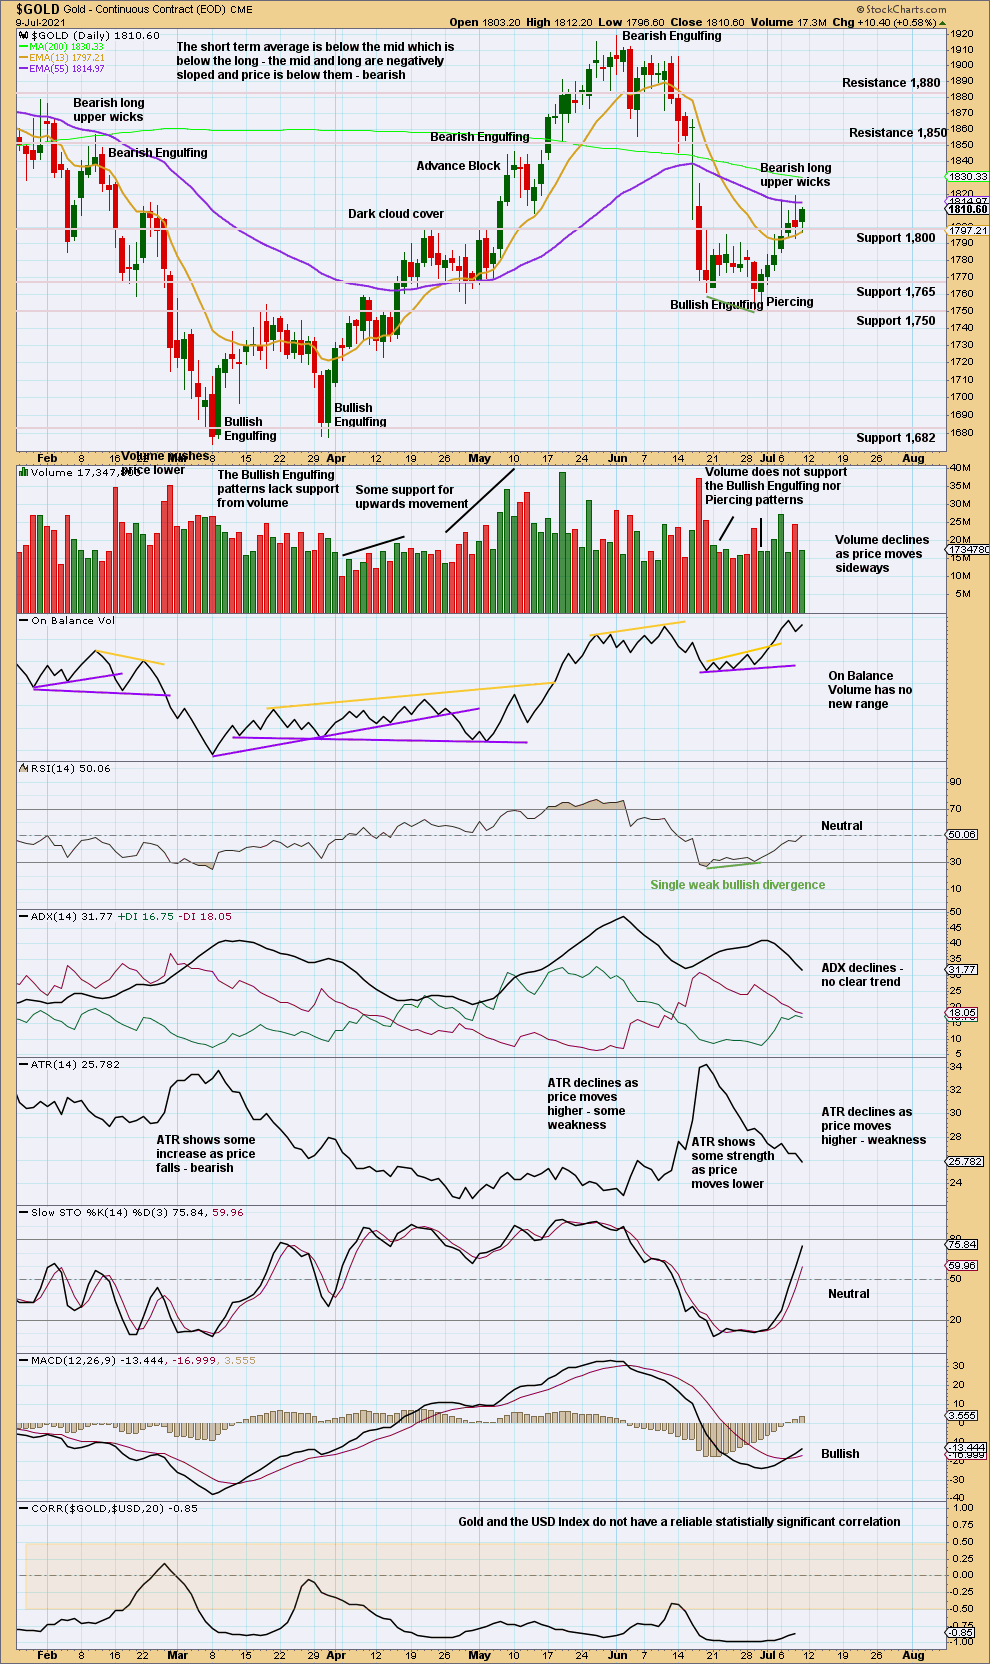
Upwards movement has not yet reached resistance and Stochastics is not yet overbought. An upwards swing may overall continue until price reaches resistance about 1,850 and Stochastics is overbought. Price is unlikely to move in a straight line though; there may be pullbacks along the way.
GDX WEEKLY CHART
Click chart to enlarge. Chart courtesy of StockCharts.com.
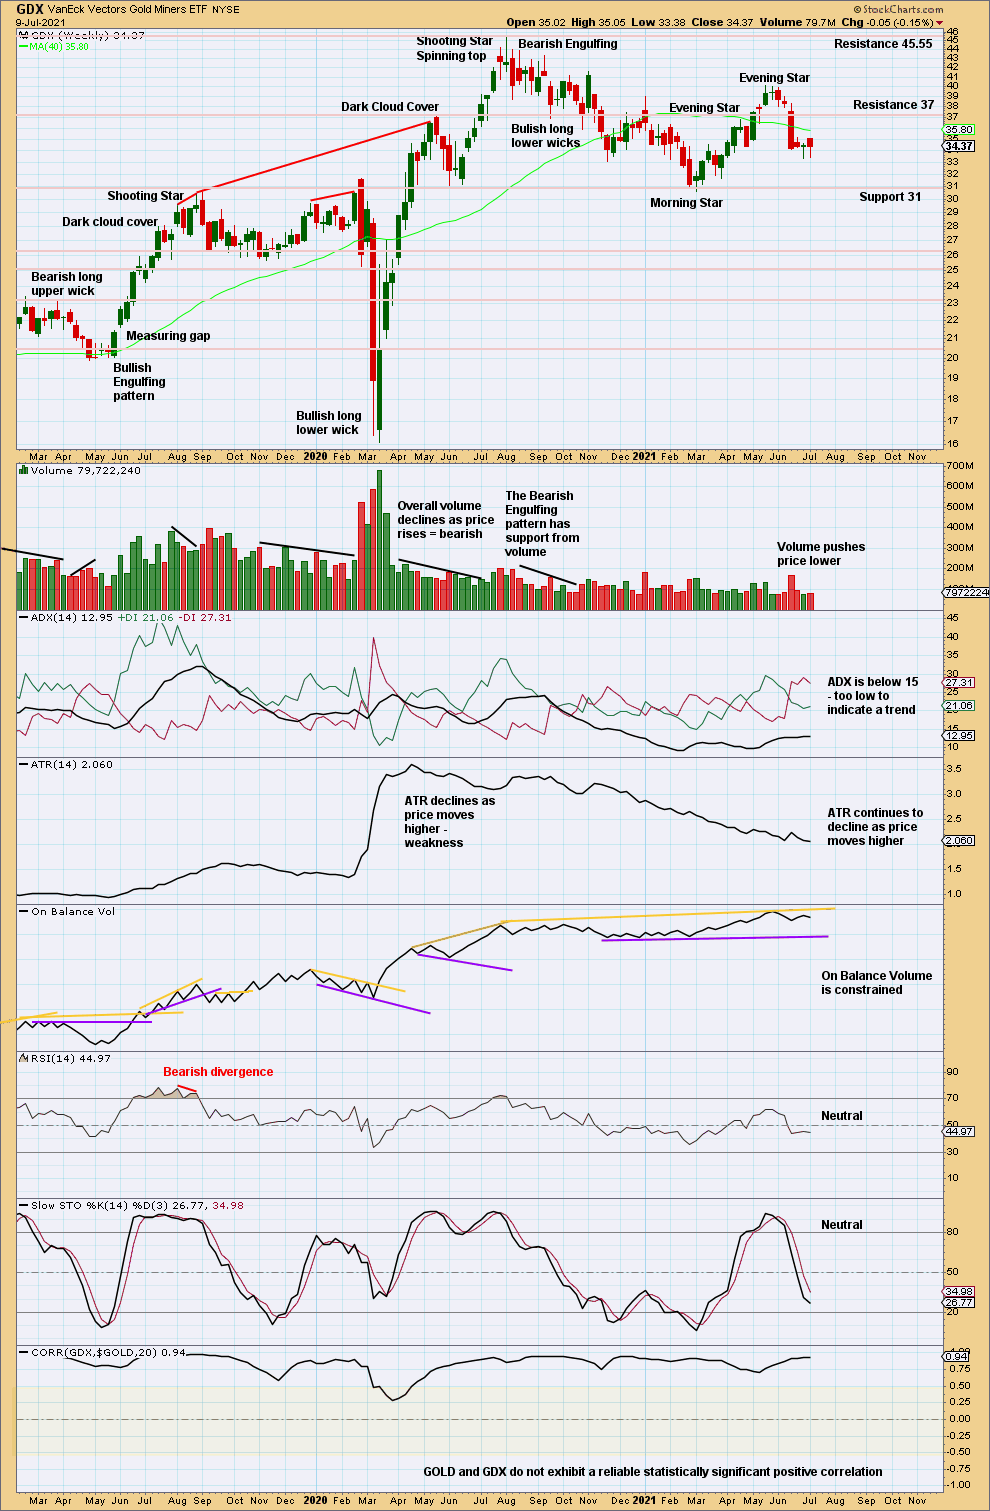
There is no bullish reversal pattern at this last low, but now two bullish long lower wicks suggest at least a little more upwards movement ahead.
GDX DAILY CHART
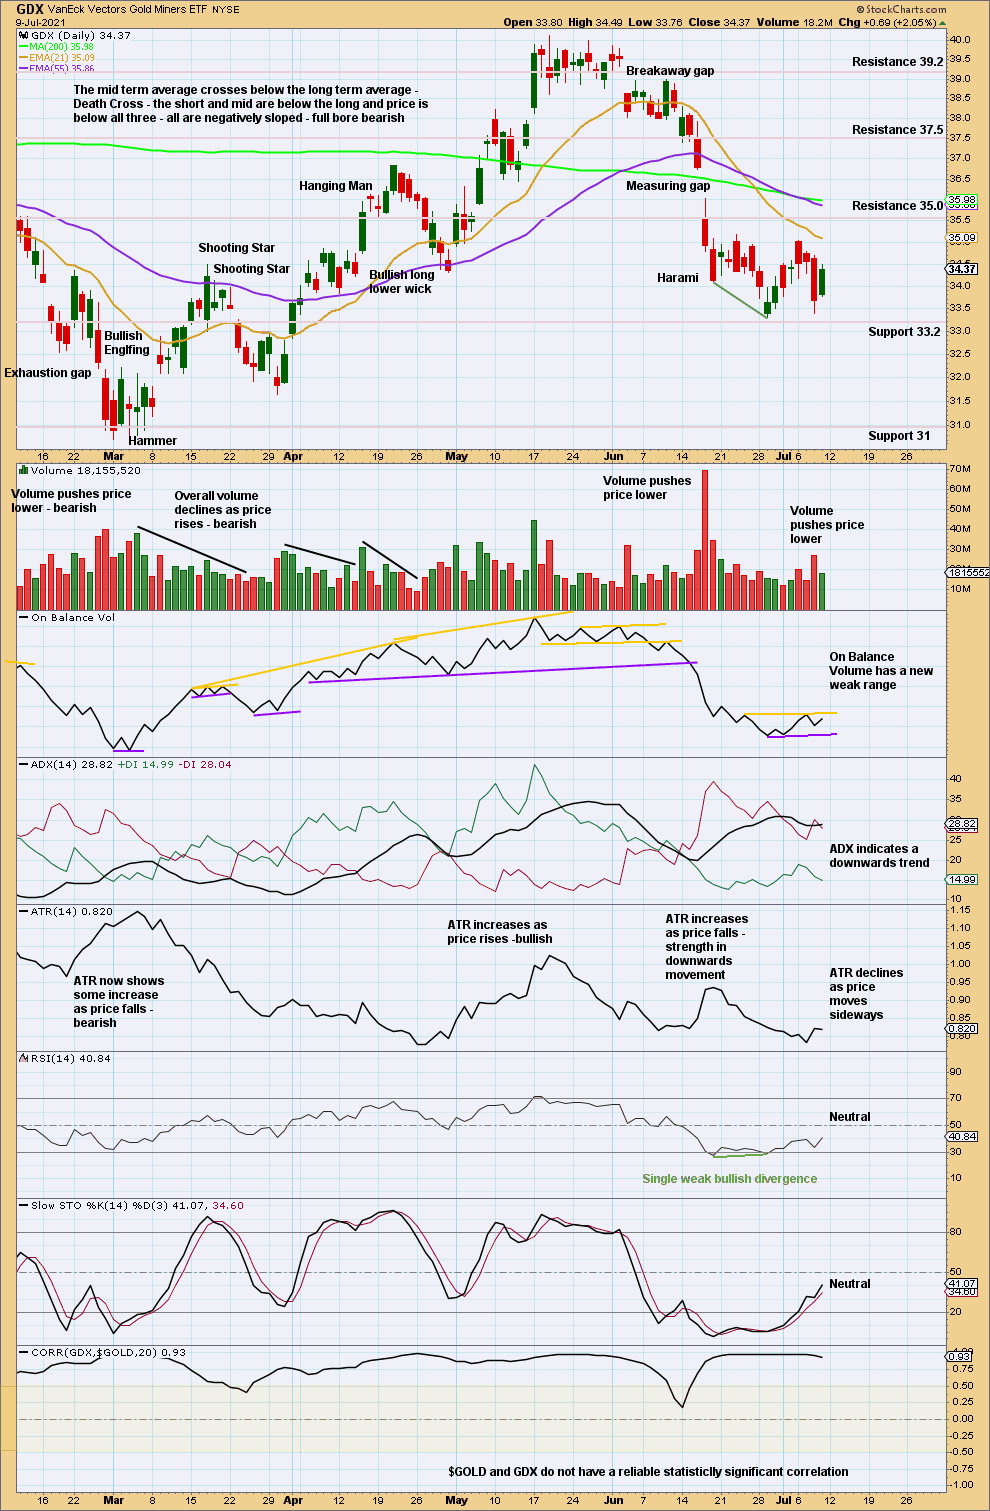
Click chart to enlarge. Chart courtesy of StockCharts.com.
An inside day does not have support from volume. If support at 33.2 can be breached by price closing below it, then price may fall to next support about 31.
Published @ 05:10 p.m. ET.
—
Careful risk management protects your trading account(s).
Follow my two Golden Rules:
1. Always trade with stops.
2. Risk only 1-5% of equity on any one trade.
—
New updates to this analysis are in bold.
—