
GOLD: Elliott Wave and Technical Analysis | Charts – July 16, 2021
The Elliott wave channel may now be used for confidence in the Elliott wave count.
Summary: The bounce may be over. The main wave count now has a target for a downwards wave at 1,732 and an invalidation point at 1,677.64. The alternate wave count now has a target for a primary degree third wave down at 1,569 and a confidence point at 1,677.64.
Confidence in these targets may only be had once the upwards sloping channel on the daily charts is breached by at least one full daily candlestick below and not touching the lower trend line. While price remains within the channel, there is risk this bounce may not be over; if the bounce continues, then a target may be at 1,853.
Grand SuperCycle analysis and last monthly charts are here.
MAIN ELLIOTT WAVE COUNT
WEEKLY CHART
Click chart to enlarge.
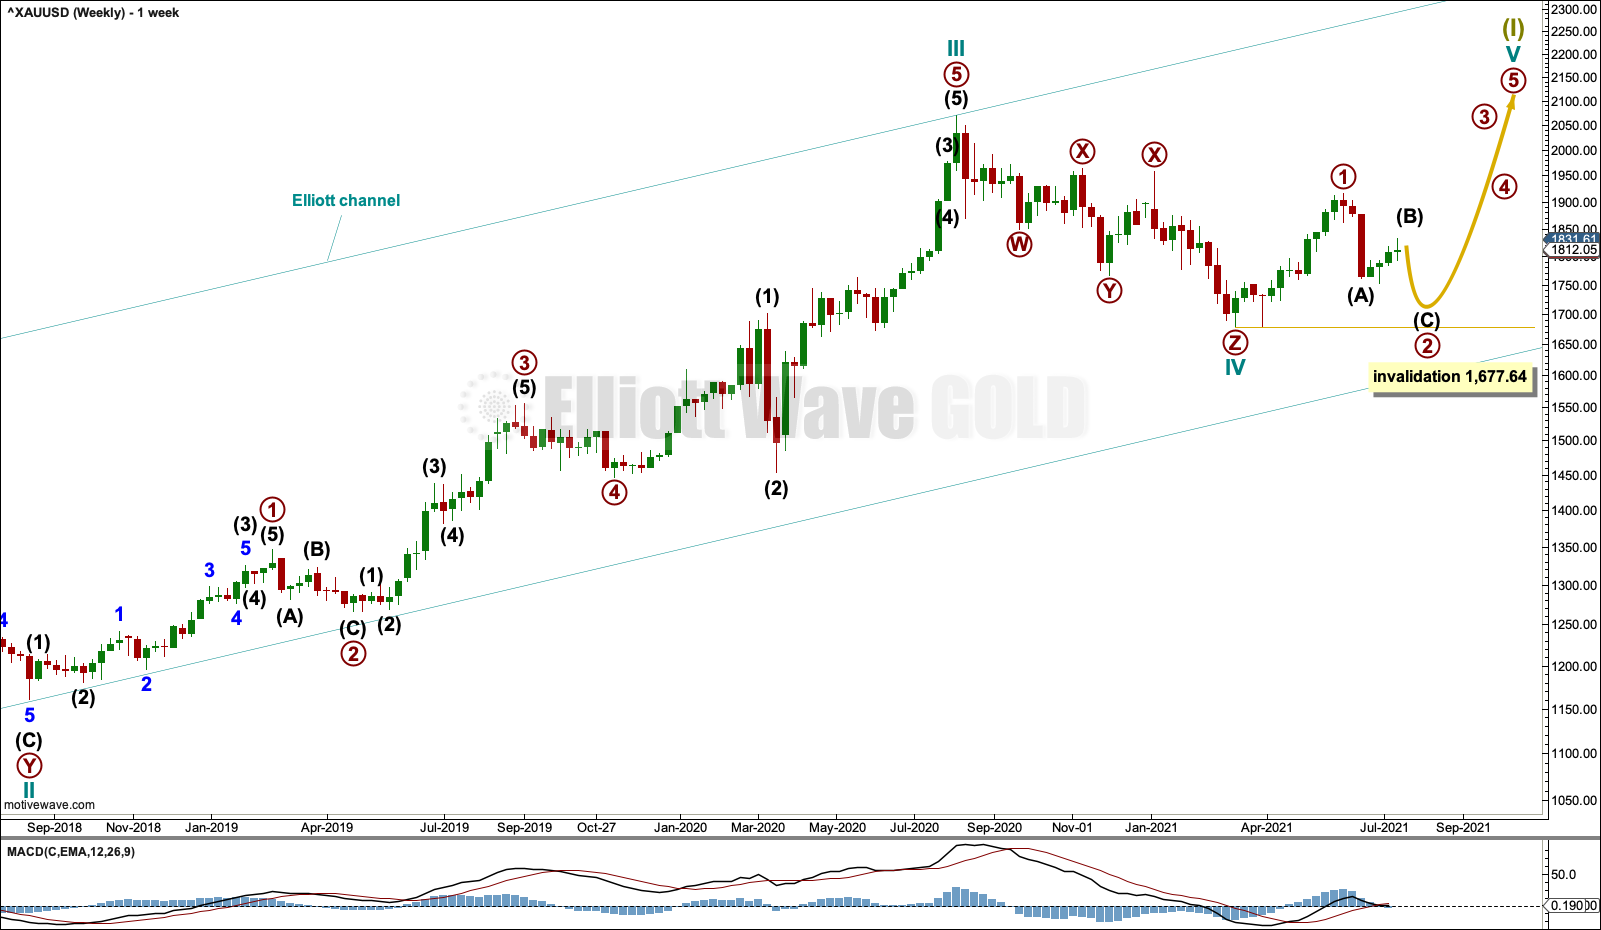
This wave count sees the the bear market complete at the last major low for Gold on 3 December 2015.
If Gold is in a new bull market, then it should begin with a five wave structure upwards on the weekly chart.
Cycle wave I fits as a five wave impulse with reasonably proportionate corrections for primary waves 2 and 4.
Cycle wave II fits as a double flat. However, within the first flat correction labelled primary wave W, this wave count needs to ignore what looks like an obvious triangle from July to September 2016 (this can be seen labelled as a triangle on the second weekly chart on prior analysis here). This movement must be labelled as a series of overlapping first and second waves. Ignoring this triangle reduces the probability of this wave count in Elliott wave terms.
Double flats are fairly rare structures. The probability of this wave count is further reduced.
Cycle wave IV may be a complete triple zigzag. Triple zigzags are not rare structures, but they are not common. The probability of this wave count is further reduced in Elliott wave terms. This is one reason why an alternate is still considered.
Cycle wave V may have begun. Within cycle wave V: Primary wave 1 may be over at the last high, and primary wave 2 may not move beyond the start of primary wave 1 below 1,677.64.
DAILY CHART
Click chart to enlarge.
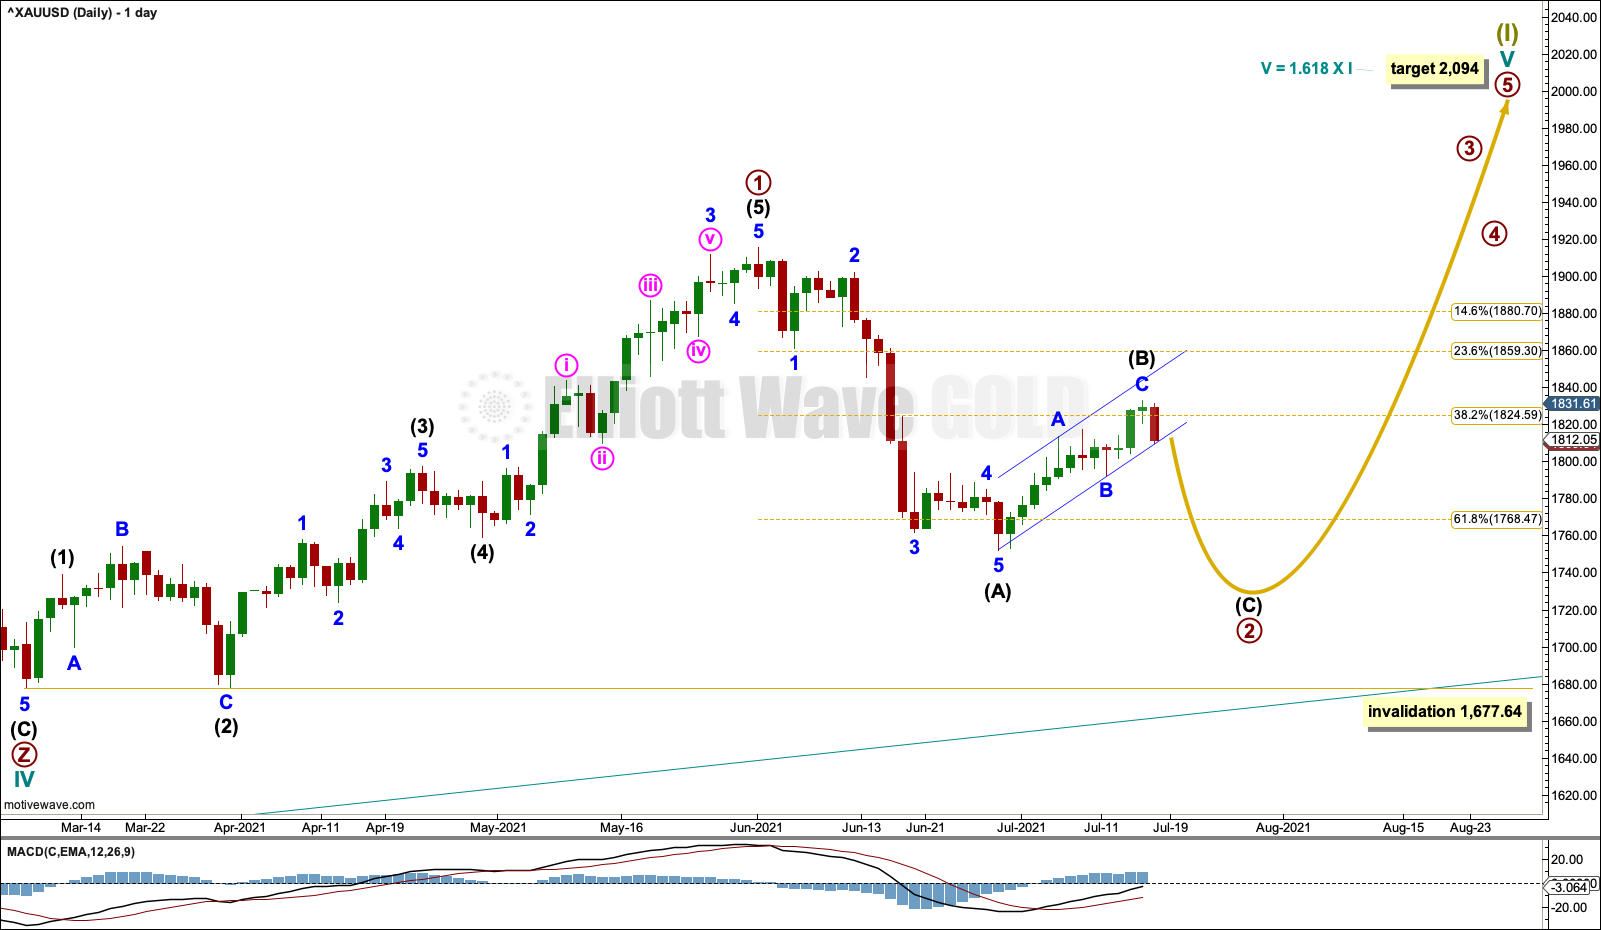
A target is calculated for cycle wave V. If this target is wrong for this wave count, then it may be too low. As price approaches the target, if the structure is incomplete, then a higher target may be calculated.
Primary wave 1 within cycle wave V may be complete.
Primary wave 2 may be an incomplete zigzag. Intermediate waves (A) and (B) within primary wave 2 may now both be complete. A target is calculated for intermediate wave (C). Intermediate wave (C) should at least make a new low below the end of intermediate wave (A) to avoid a truncation. When the channel about intermediate wave (B) is breached by downwards movement, then that shall provide confidence that intermediate wave (B) is over.
Primary wave 2 may not move beyond the start of primary wave 1 below 1,677.64.
HOURLY CHART
Click chart to enlarge.
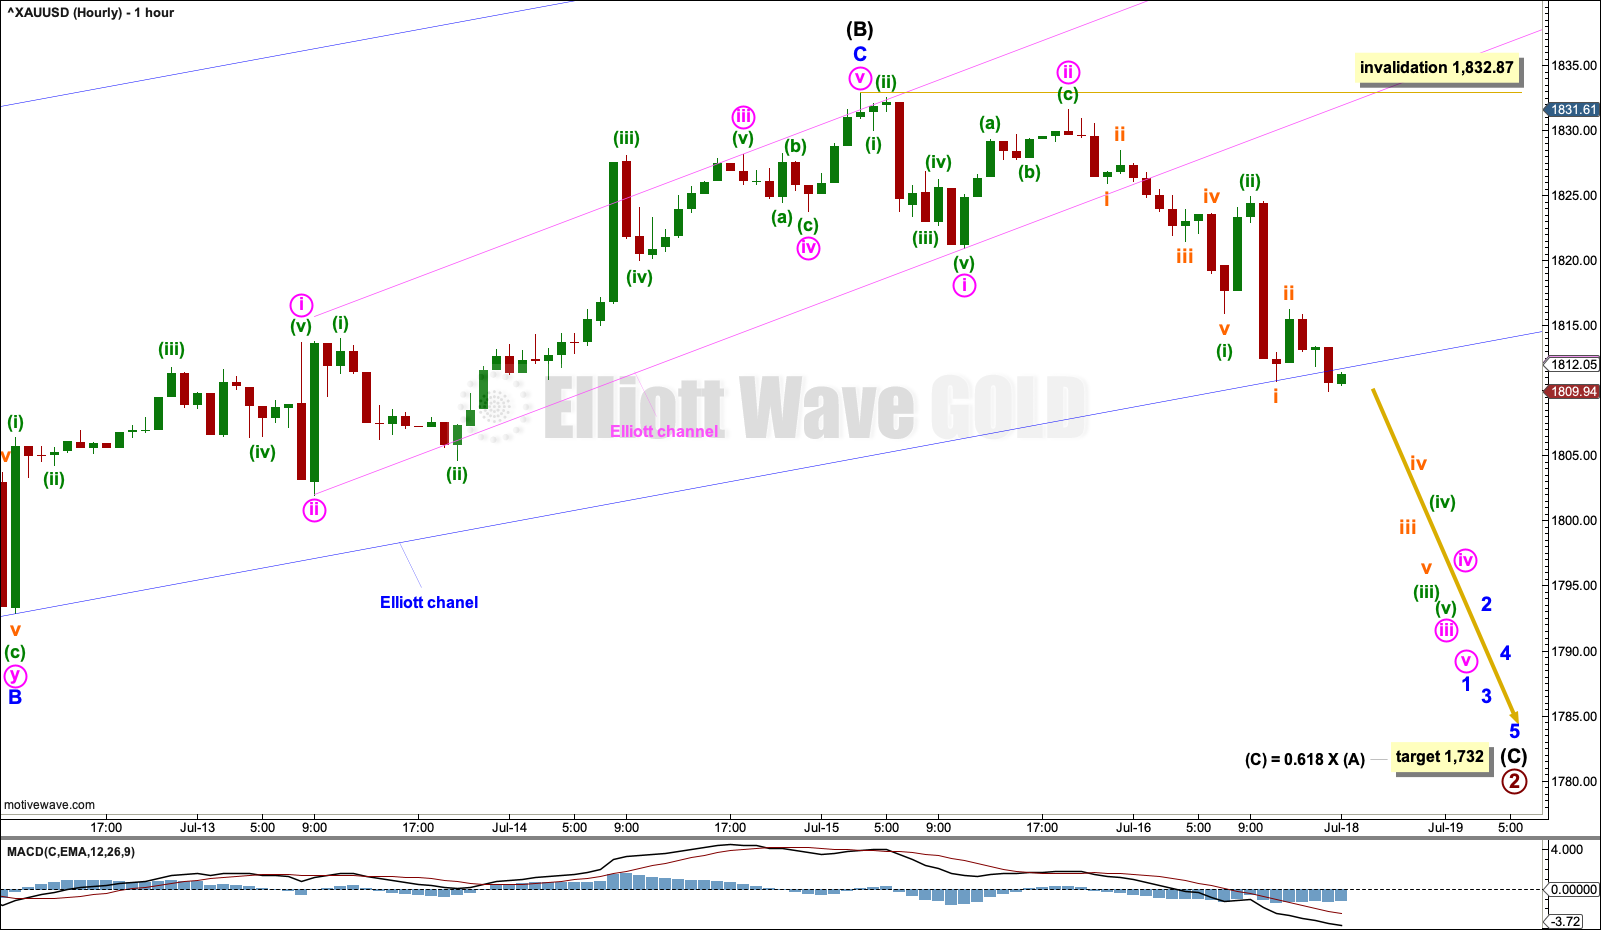
A zigzag for intermediate wave (B) may now be complete. The small pink Elliott channel drawn about minor wave C is breached by downwards movement; this is the earliest indication that minor wave C should be over.
If the wider blue Elliott channel drawn about intermediate wave (B) is breached by downwards movement, then that would add further confidence that intermediate wave (B) should be over.
A target is calculated for intermediate wave (C) to end.
ALTERNATE ELLIOTT WAVE COUNT
WEEKLY CHART
Click chart to enlarge.
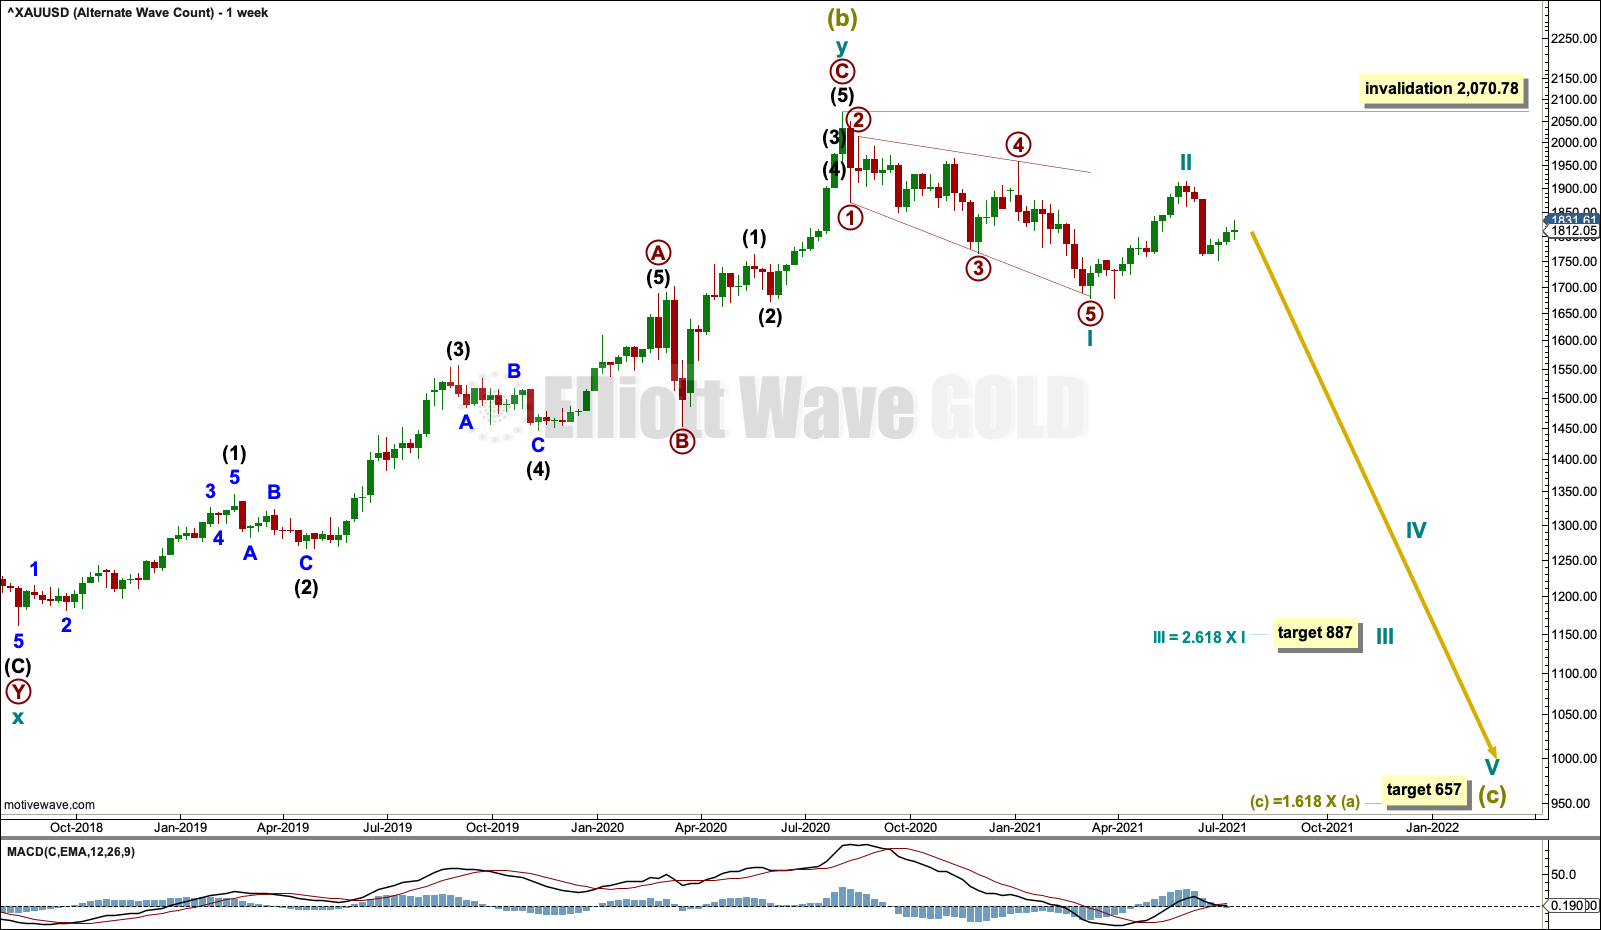
The bigger picture for this alternate Elliott wave count sees Gold as within a bear market, in a three steps back pattern that is labelled Grand Super Cycle wave IV on monthly charts. Grand Super Cycle wave IV may be subdividing as an expanded flat pattern.
Super Cycle wave (b) within Grand Super Cycle wave IV may be a complete double zigzag. This wave count expects Super Cycle wave (c) to move price below the end of Super Cycle wave (a) at 1,046.27 to avoid a truncation and a very rare running flat. The target calculated expects a common Fibonacci ratio for Super Cycle wave (c).
Super Cycle wave (c) may have begun with a leading expanding diagonal for cycle wave I. Leading expanding diagonals in first wave positions are uncommon, so the probability of this wave count is reduced. However, it has a good fit and must be considered.
Second wave corrections to follow leading diagonals in first wave positions are usually very deep. Cycle wave II is deep and the structure may be complete; so far it is following a common pattern. If it continues higher, then cycle wave II may not move beyond the start of cycle wave I above 2,070.78.
DAILY CHART
Click chart to enlarge.
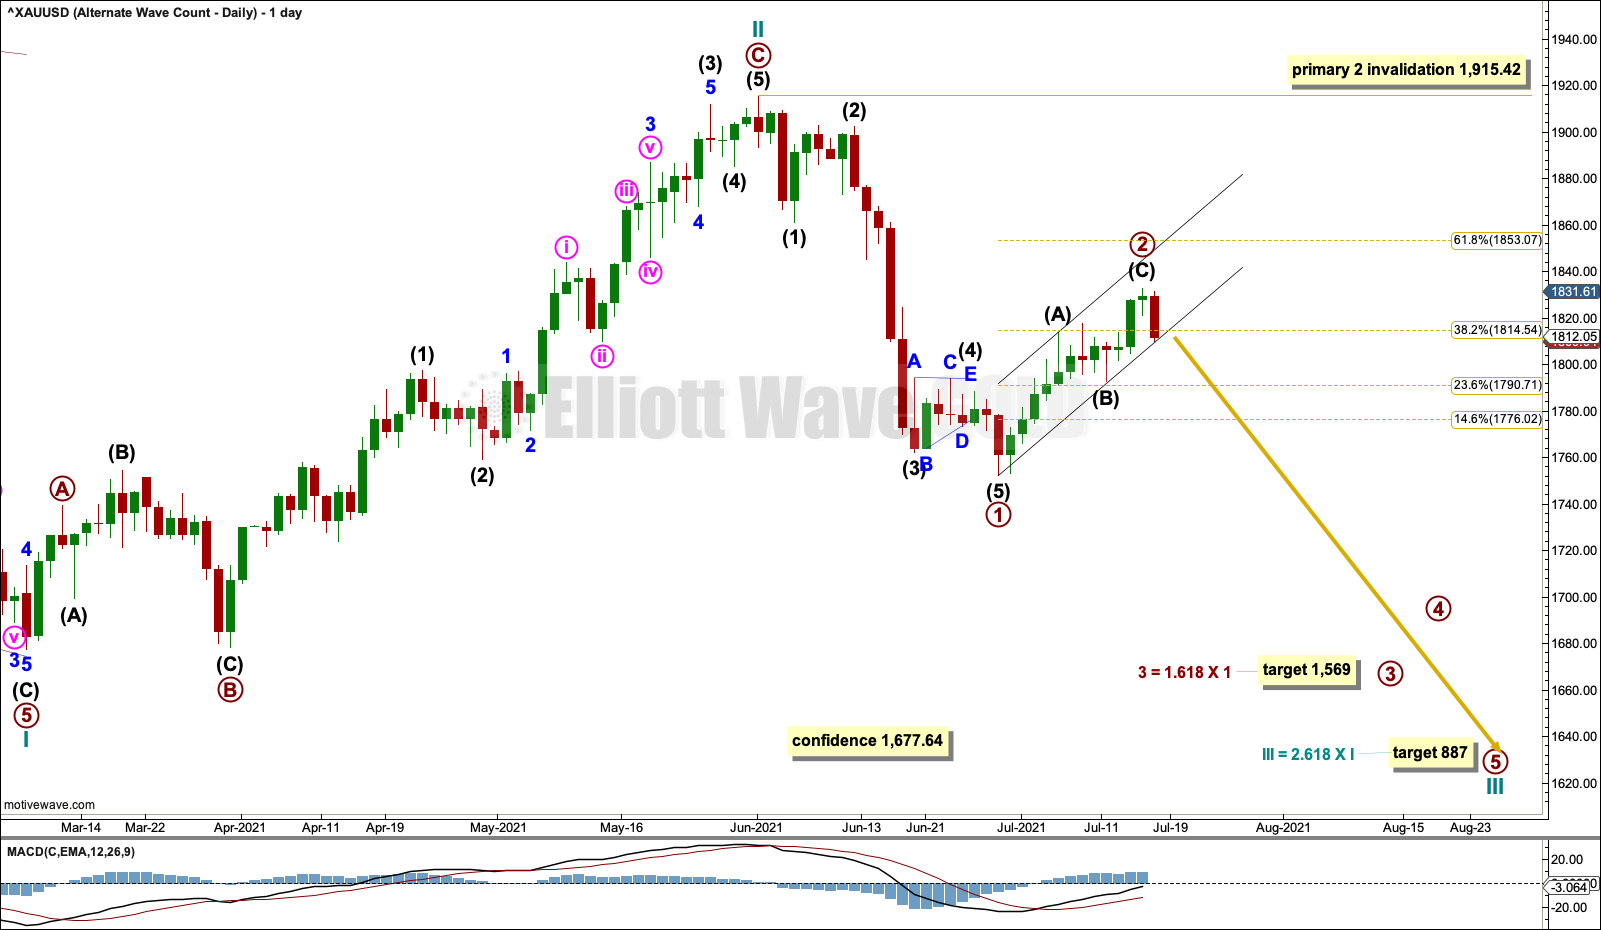
A target is calculated for cycle wave III.
Primary wave 1 within cycle wave III may be complete.
Primary wave 2 may now also be complete as a zigzag. However, it is possible that primary wave 2 may move higher as a double zigzag. If it does continue higher, then the target would be at the 0.618 Fibonacci ratio of primary wave 1 at 1,853.
Primary wave 2 may not move beyond the start of primary wave 1 above 1,915.42.
Draw a channel about primary wave 2. When this channel is breached by downwards movement, it may then provide confidence primary wave 2 as complete and primary wave 3 as just begun.
HOURLY CHART
Click chart to enlarge.
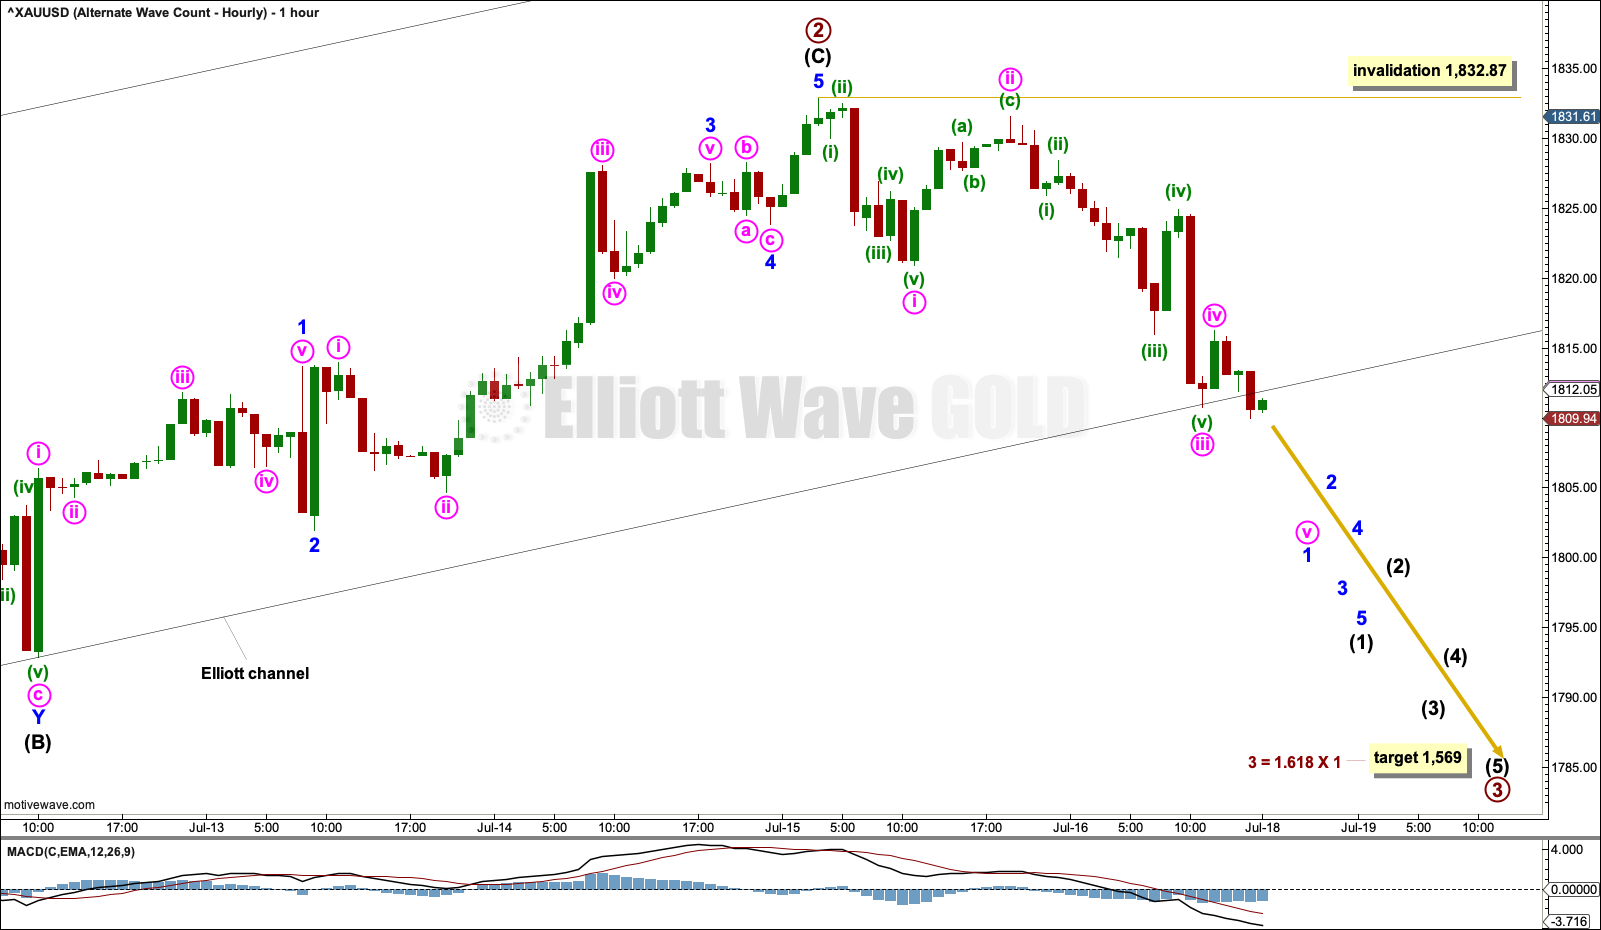
Primary wave 2 and intermediate wave (C) may be complete.
A target is calculated for primary wave 3.
Within primary wave 3, no second wave correction may move beyond its start above 1,832.87.
TECHNICAL ANALYSIS
WEEKLY CHART
Click chart to enlarge. Chart courtesy of StockCharts.com.
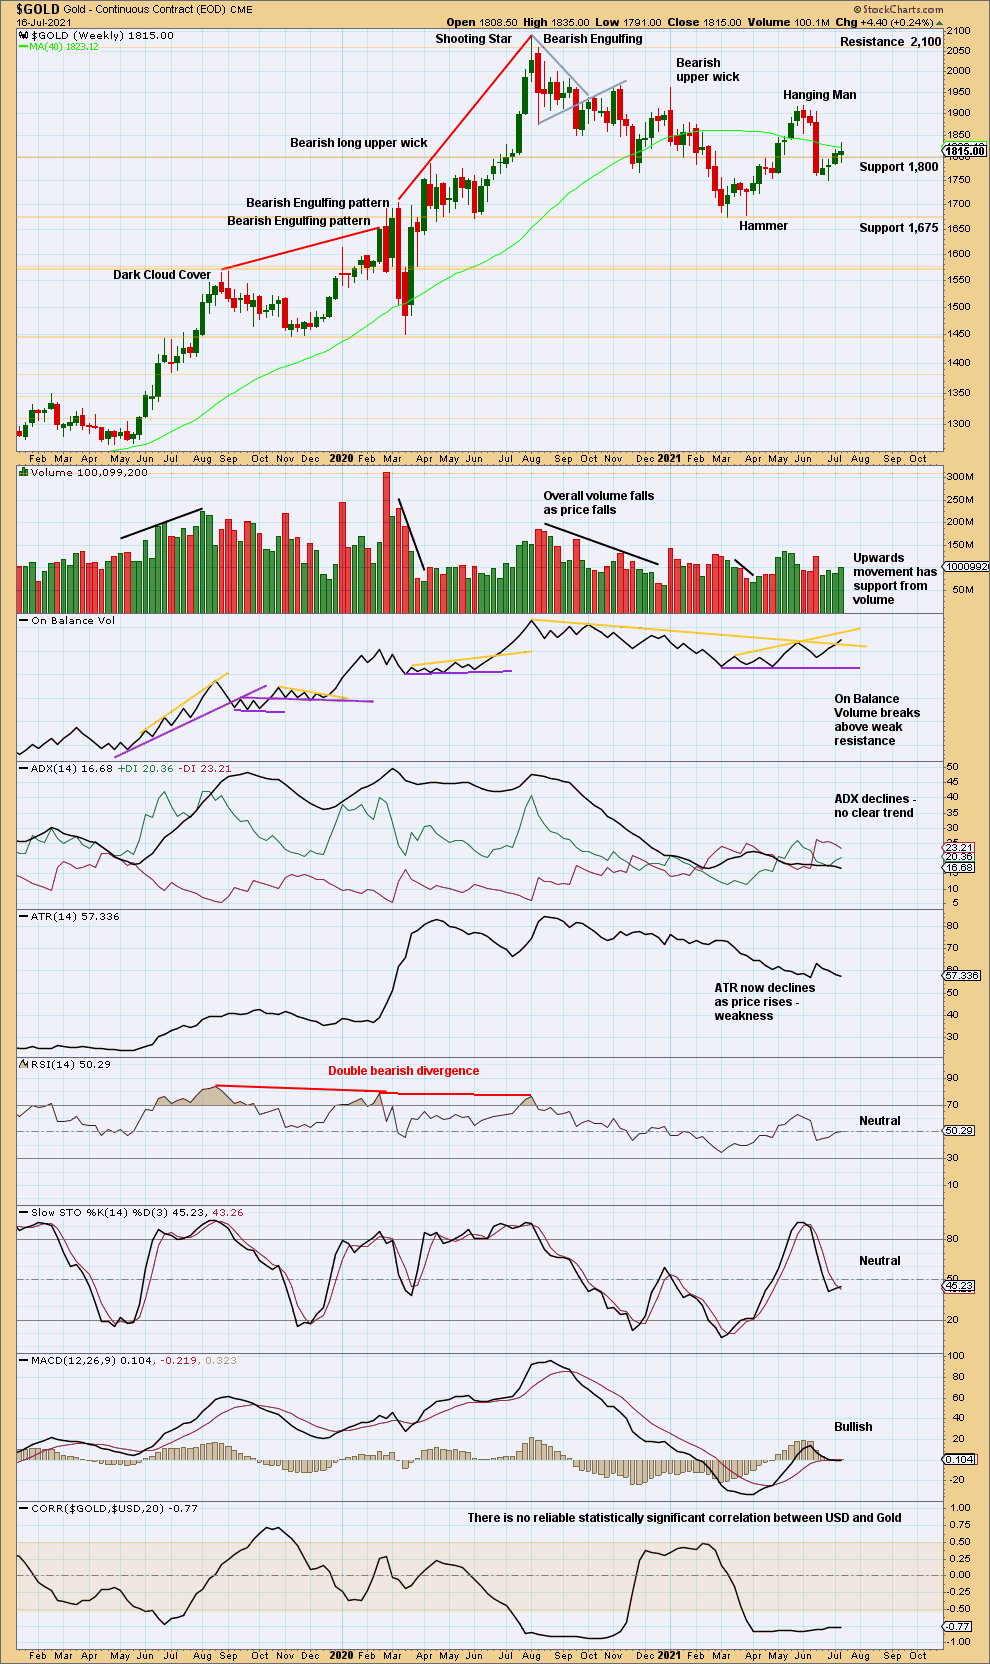
Range of the last four green weekly candlesticks is small. Volume has provided some support though and price has closed above prior resistance at 1,800. On Balance Volume gives a bullish signal.
It is possible that this bounce may continue a little further.
DAILY CHART
Click chart to enlarge. Chart courtesy of StockCharts.com.
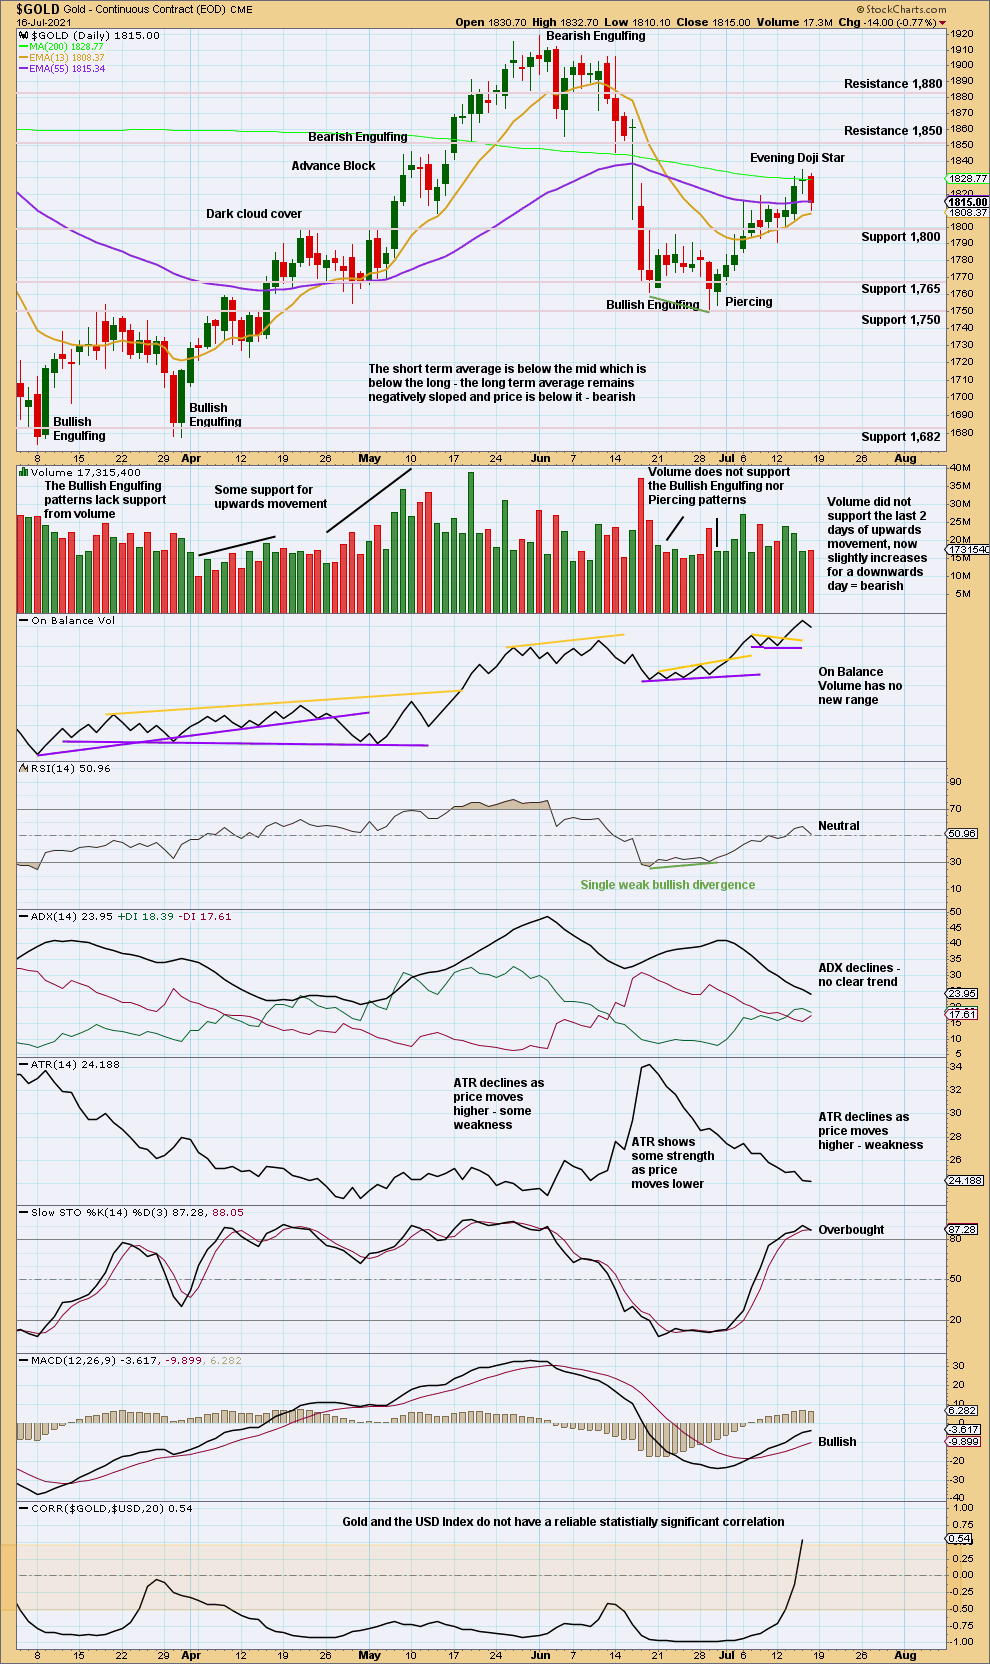
Stochastsics is overbought, ADX indicates no clear trend, and now there is a bearish candlestick pattern at the high. The bounce may be over.
GDX WEEKLY CHART
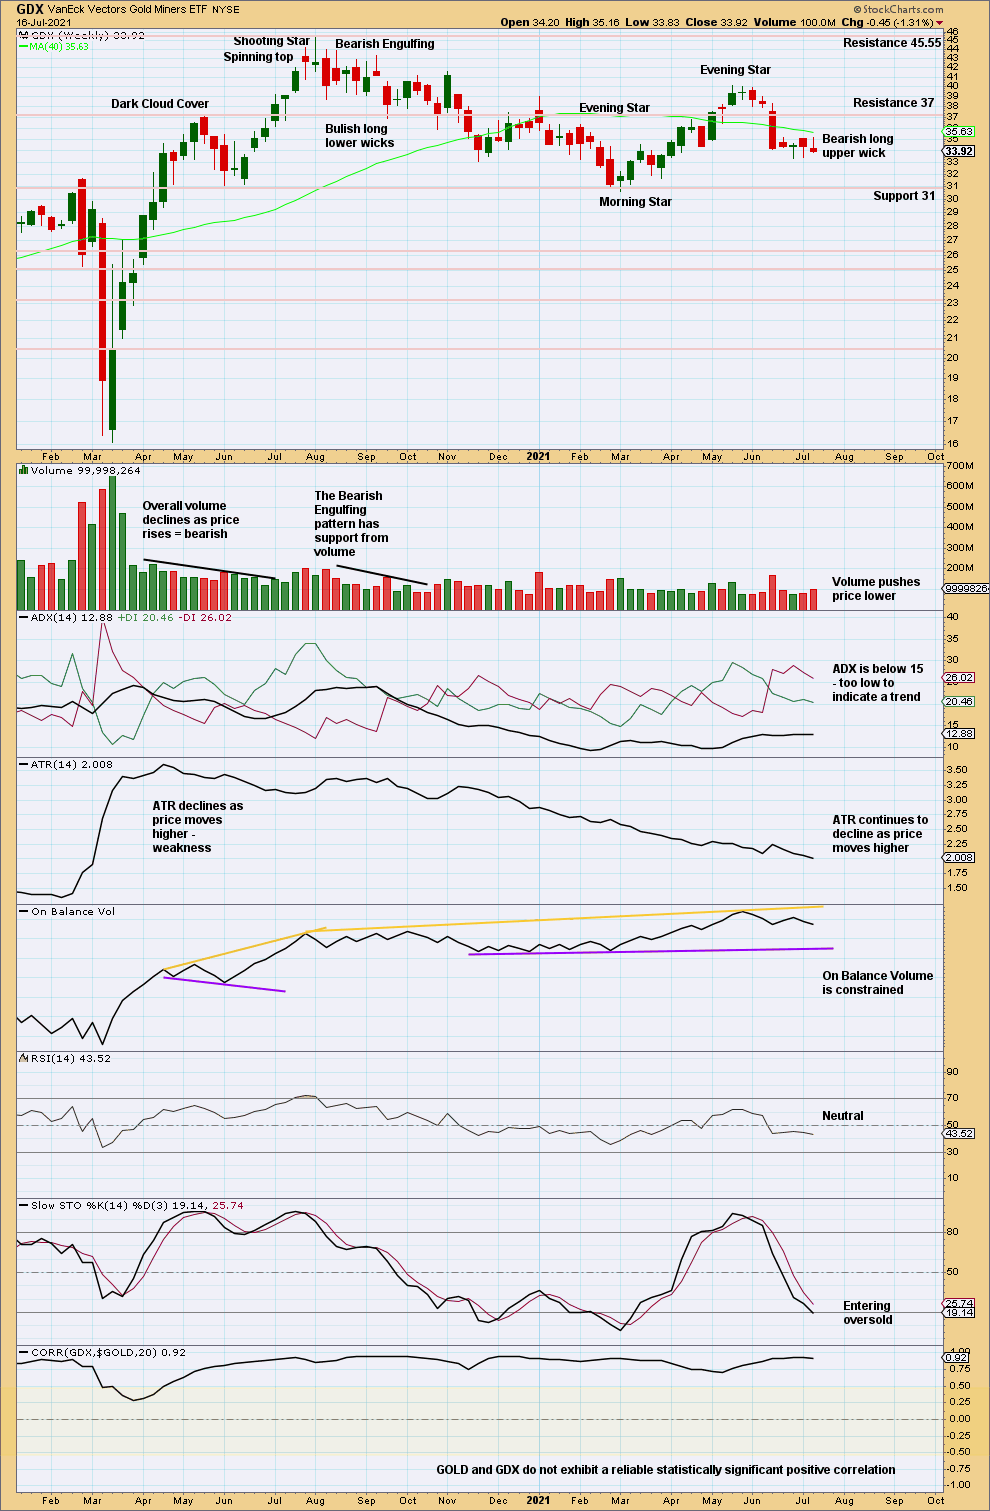
Click chart to enlarge. Chart courtesy of StockCharts.com.
An increase in volume for a downwards week and a bearish long upper wick suggest more downwards movement next week.
GDX DAILY CHART
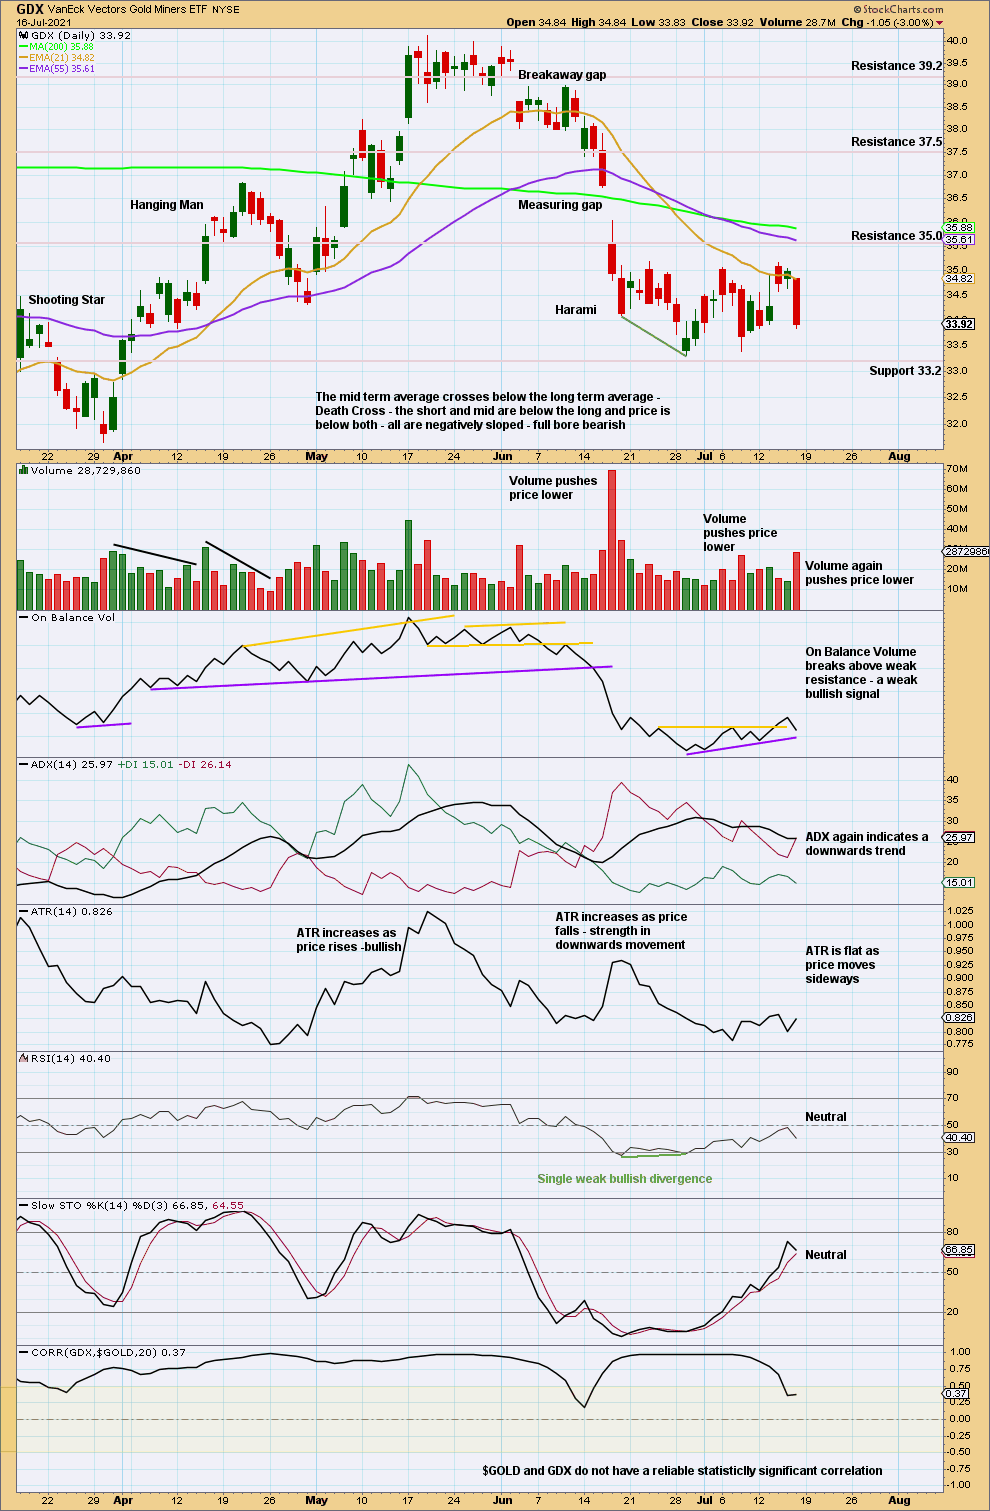
Click chart to enlarge. Chart courtesy of StockCharts.com.
Price is consolidating with resistance about 35 and support about 33.3. A breakout is required before confidence in the next direction may be had. Friday’s strong downwards session suggests a downwards breakout may come soon.
Published @ 06:53 p.m. ET.
—
Careful risk management protects your trading account(s).
Follow my two Golden Rules:
1. Always trade with stops.
2. Risk only 1-5% of equity on any one trade.
—
New updates to this analysis are in bold.
—