
GOLD: Elliott Wave and Technical Analysis | Charts – July 30, 2021
An inside day on Friday leaves both Elliott wave counts unchanged.
Short-term targets are given for a bounce next week; a short-term price point is indicated, which would indicate the bounce may be over.
Summary: Both the main and alternate Elliott wave counts expect upwards movement to a short-term target at 1,843. Thereafter, a strong downwards wave should move below 1,793.21.
For the short term, a new low below 1,806.79 would expect a high in place and a target would be either at 1,731 or 1,568.
Grand SuperCycle analysis and last monthly charts are here.
MAIN ELLIOTT WAVE COUNT
WEEKLY CHART
Click chart to enlarge.
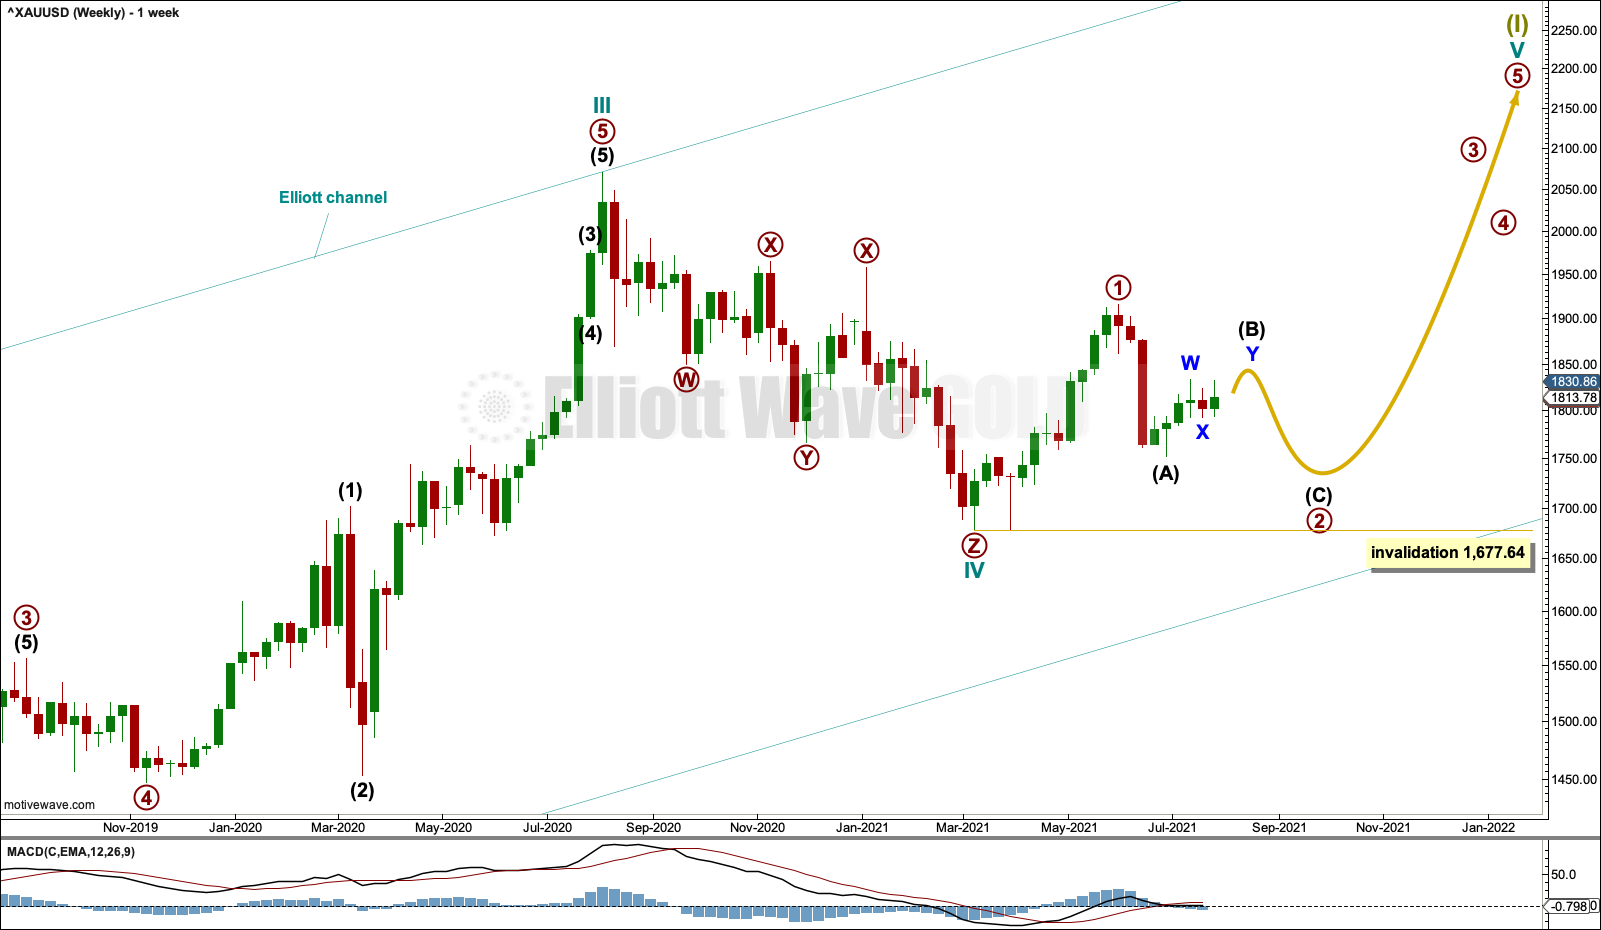
This wave count sees the the bear market complete at the last major low for Gold on 3 December 2015.
If Gold is in a new bull market, then it should begin with a five wave structure upwards on the weekly chart.
Cycle wave I fits as a five wave impulse with reasonably proportionate corrections for primary waves 2 and 4.
Cycle wave II fits as a double flat. However, within the first flat correction labelled primary wave W, this wave count needs to ignore what looks like an obvious triangle from July to September 2016 (this can be seen labelled as a triangle on the second weekly chart on prior analysis here). This movement must be labelled as a series of overlapping first and second waves. Ignoring this triangle reduces the probability of this wave count in Elliott wave terms.
Double flats are fairly rare structures. The probability of this wave count is further reduced.
Cycle wave IV may be a complete triple zigzag. Triple zigzags are not rare structures, but they are not common. The probability of this wave count is further reduced in Elliott wave terms. This is one reason why an alternate is still considered.
Cycle wave V may have begun. Within cycle wave V: Primary wave 1 may be over at the last high, and primary wave 2 may not move beyond the start of primary wave 1 below 1,677.64.
DAILY CHART
Click chart to enlarge.
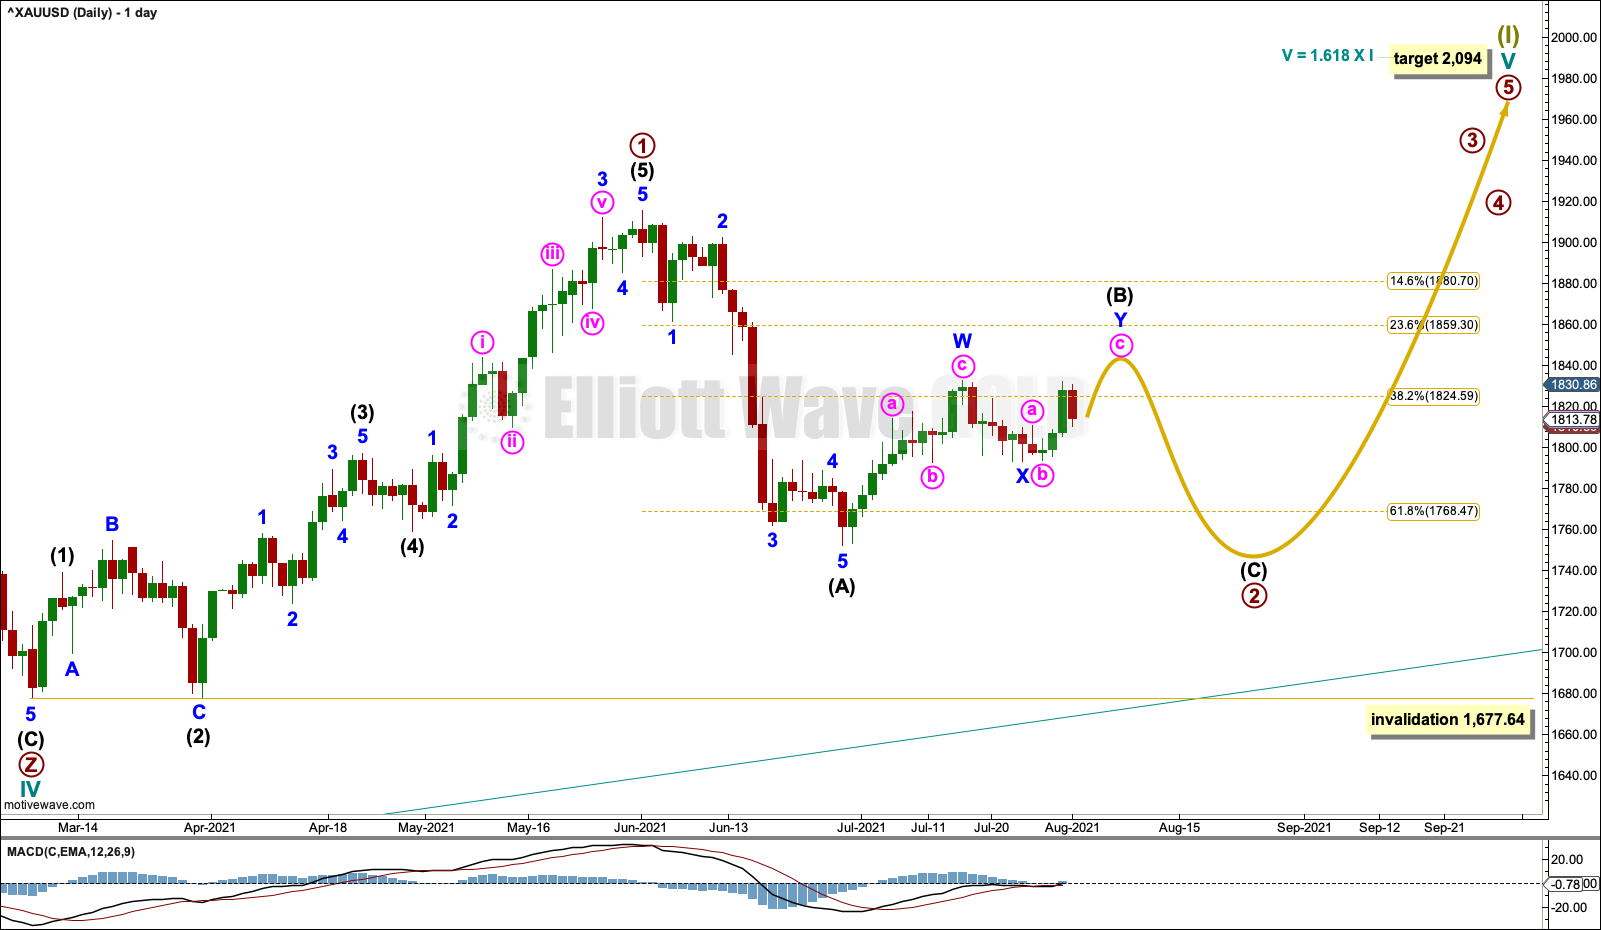
A target is calculated for cycle wave V. If this target is wrong for this wave count, then it may be too low. As price approaches the target, if the structure is incomplete, then a higher target may be calculated.
Primary wave 1 within cycle wave V may be complete.
Primary wave 2 may be an incomplete zigzag. Intermediate wave (B) within primary wave 2 may be continuing higher as a double zigzag.
When intermediate wave (B) may be complete, then intermediate wave (C) should make at least a slight new low below the end of intermediate wave (A) at 1,752.19 to avoid a truncation. When intermediate wave (B) may be complete, then a target can be calculated for intermediate wave (C).
Primary wave 2 may not move beyond the start of primary wave 1 below 1,677.64.
For the short term, a new low below 1,806.79 would see intermediate wave (B) labelled over at the last high and intermediate wave (C) down would have a target at 1,731.
HOURLY CHART
Click chart to enlarge.
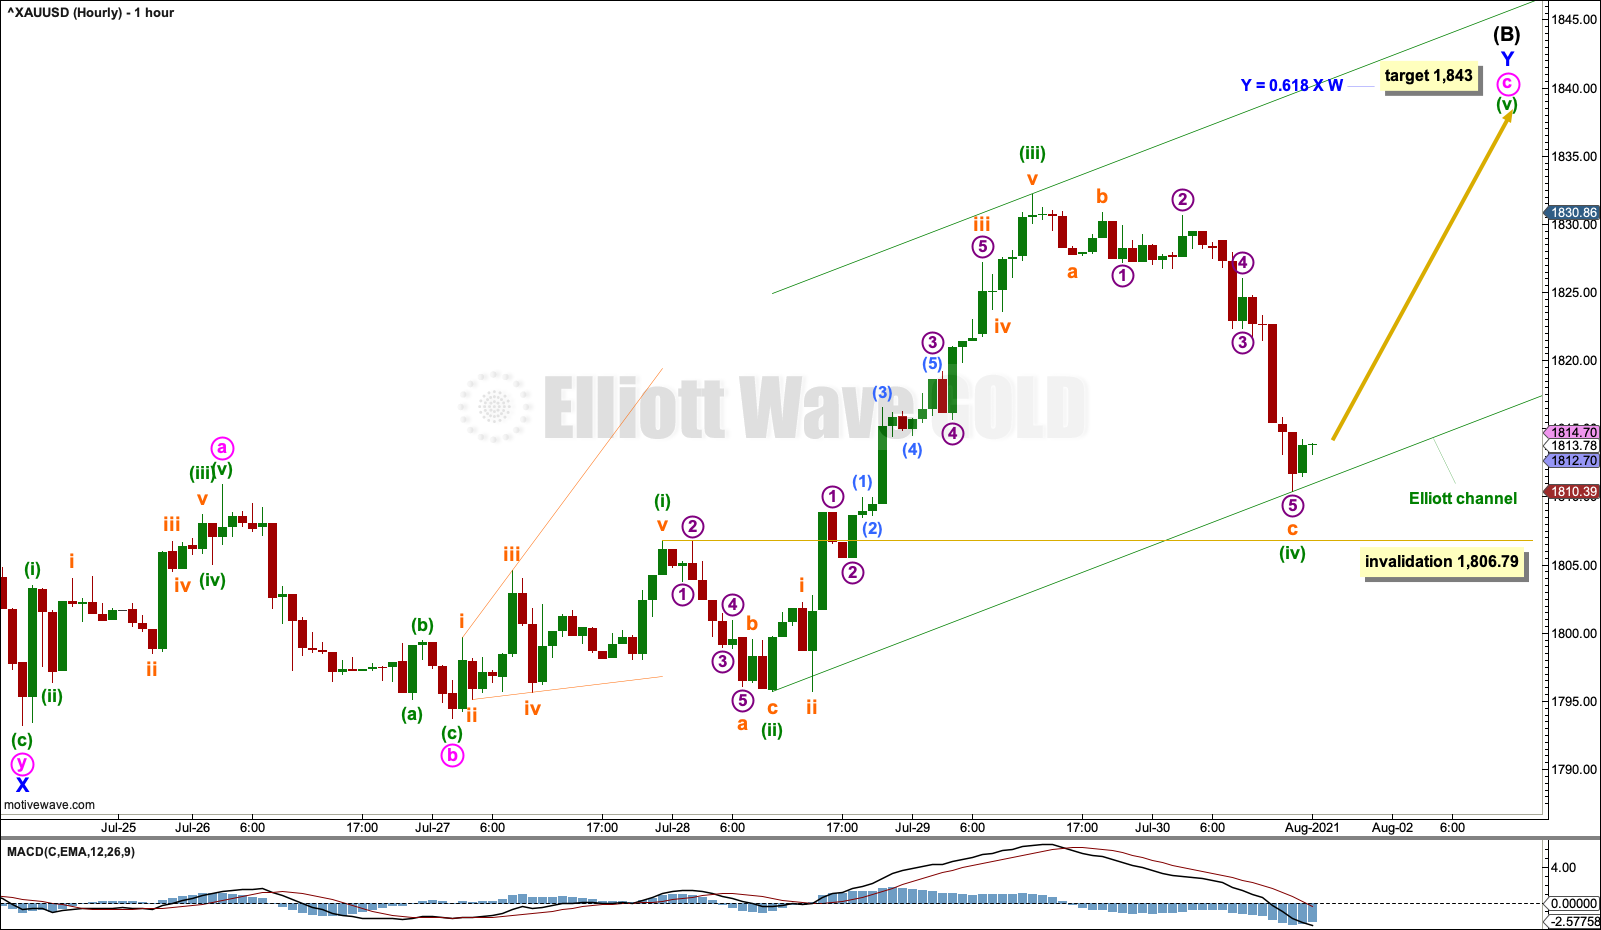
Intermediate wave (B) may be subdividing as a double zigzag, which is a common structure. The first zigzag is labelled minor wave W and can be seen on the daily chart. The two zigzags in the double are joined by a three in the opposite direction that subdivides as a double zigzag, which is minor wave X. Minor wave Y may now be subdividing as a zigzag.
A target is calculated for minor wave Y.
Within minor wave Y: Minute waves a and b may be complete, and minute wave c may now be underway.
Minute wave c may be subdividing as an impulse. Minuette waves (i) through to (iv) within the impulse may be complete. If minuette wave (iv) continues lower, then it may not move into minuette wave (i) price territory below 1,806.79.
If this hourly chart is invalidated in the short term with a new low below 1,806.79, then intermediate wave (B) would be labelled over at the last high and intermediate wave (C) down would have a target at 1,731.
ALTERNATE ELLIOTT WAVE COUNT
WEEKLY CHART
Click chart to enlarge.
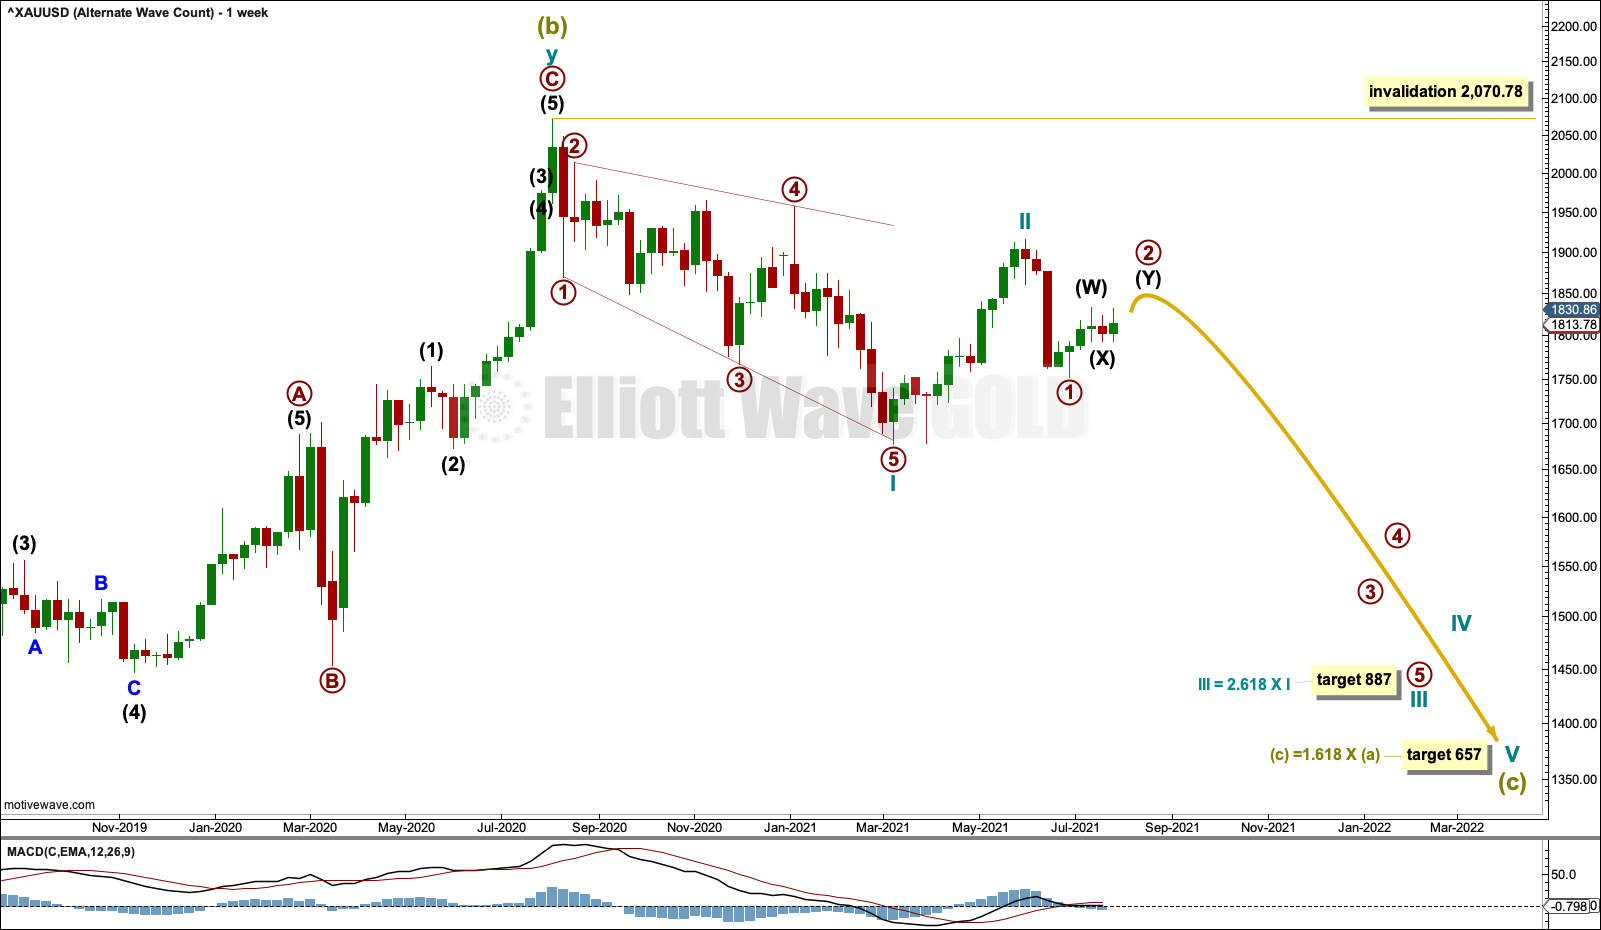
The bigger picture for this alternate Elliott wave count sees Gold as within a bear market, in a three steps back pattern that is labelled Grand Super Cycle wave IV on monthly charts. Grand Super Cycle wave IV may be subdividing as an expanded flat pattern.
Super Cycle wave (b) within Grand Super Cycle wave IV may be a complete double zigzag. This wave count expects Super Cycle wave (c) to move price below the end of Super Cycle wave (a) at 1,046.27 to avoid a truncation and a very rare running flat. The target calculated expects a common Fibonacci ratio for Super Cycle wave (c).
Super Cycle wave (c) may have begun with a leading expanding diagonal for cycle wave I. Leading expanding diagonals in first wave positions are uncommon, so the probability of this wave count is reduced. However, it has a good fit and must be considered.
Second wave corrections to follow leading diagonals in first wave positions are usually very deep. Cycle wave II is deep and the structure may be complete; so far it is following a common pattern. If it continues higher, then cycle wave II may not move beyond the start of cycle wave I above 2,070.78.
DAILY CHART
Click chart to enlarge.
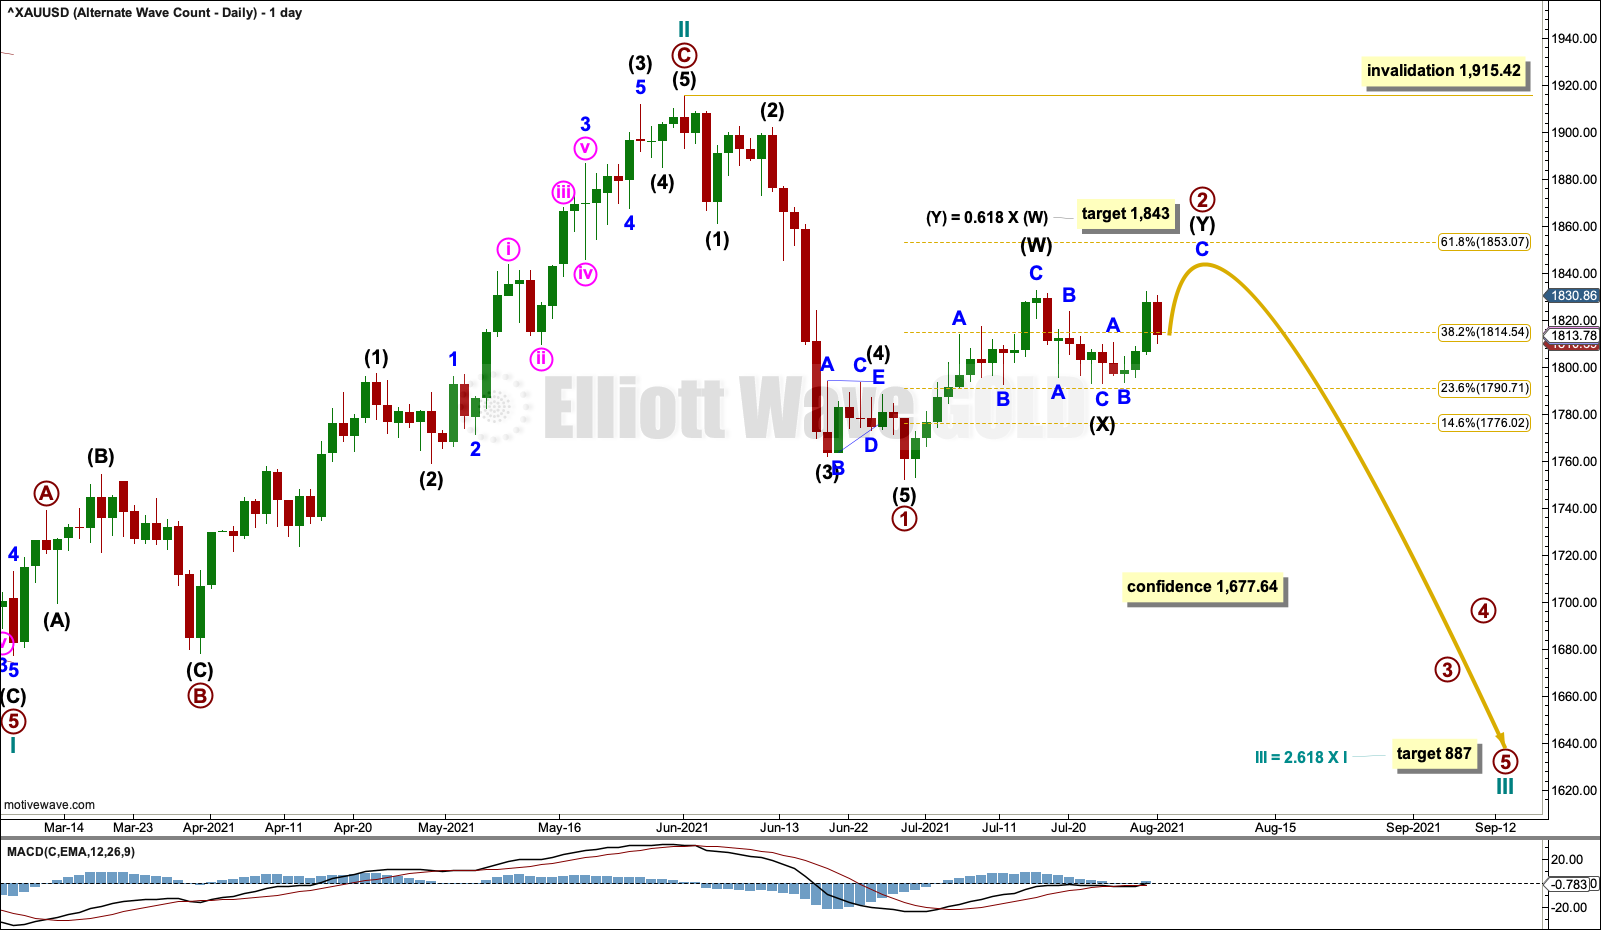
A target is calculated for cycle wave III.
Primary wave 2 may be completing as a double zigzag. The first zigzag in the double may be complete, labelled intermediate wave (W). The double may be joined by a three in the opposite direction, labelled intermediate wave (X). The second zigzag in the double may now be underway, labelled intermediate wave (Y).
The purpose of a second zigzag in a double is to deepen a correction. To achieve this purpose the second zigzag usually moves beyond the end of the first. Intermediate wave (Y) may be expected to end reasonably above the end of intermediate wave (W).
A target is calculated for primary wave 2 to end.
Primary wave 2 may not move beyond the start of primary wave 1 above 1,915.42.
For the short term, a new low below 1,806.79 would see primary wave 2 labelled over at the last high and a target for primary wave 3 would be at 1,568.
HOURLY CHART
Click chart to enlarge.
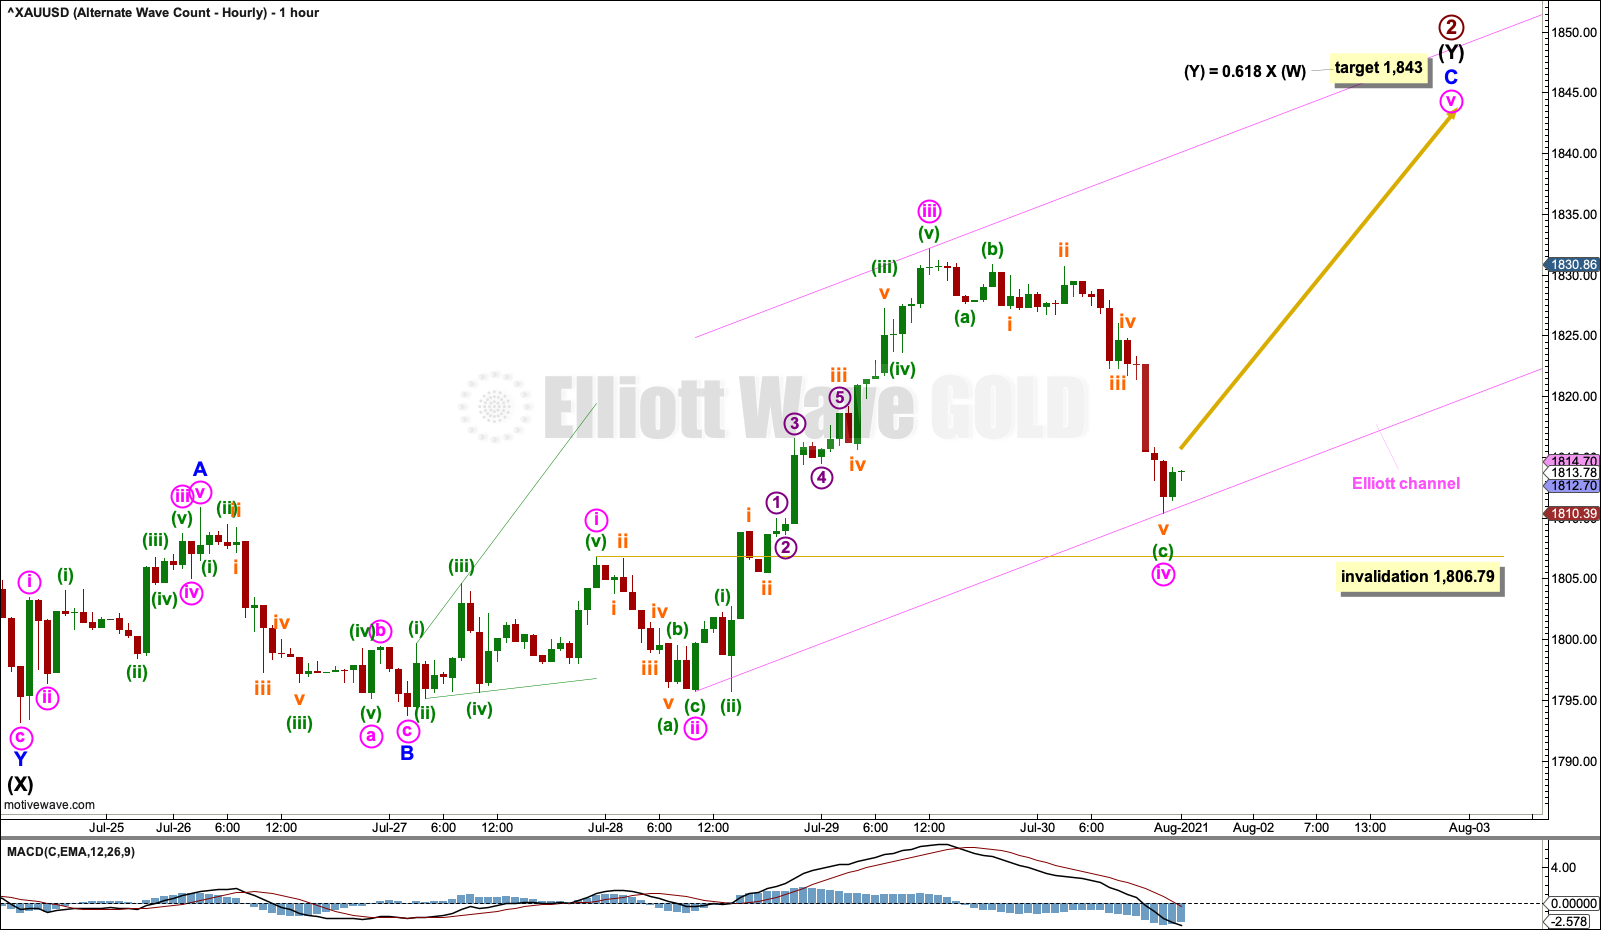
Within intermediate wave (Y): Minor waves A and B may be complete, and minor wave C may be underway.
Minor wave C may be subdividing as an impulse. Minute waves i through to iv within the impulse may be complete. If minute wave iv continues lower, then it may not move into minute wave i price territory below 1,806.79.
If this hourly chart is invalidated in the short term with a new low below 1,806.79, then primary wave 2 would be labelled over at the last high and a target for primary wave 3 would be at 1,568.
TECHNICAL ANALYSIS
WEEKLY CHART
Click chart to enlarge. Chart courtesy of StockCharts.com.
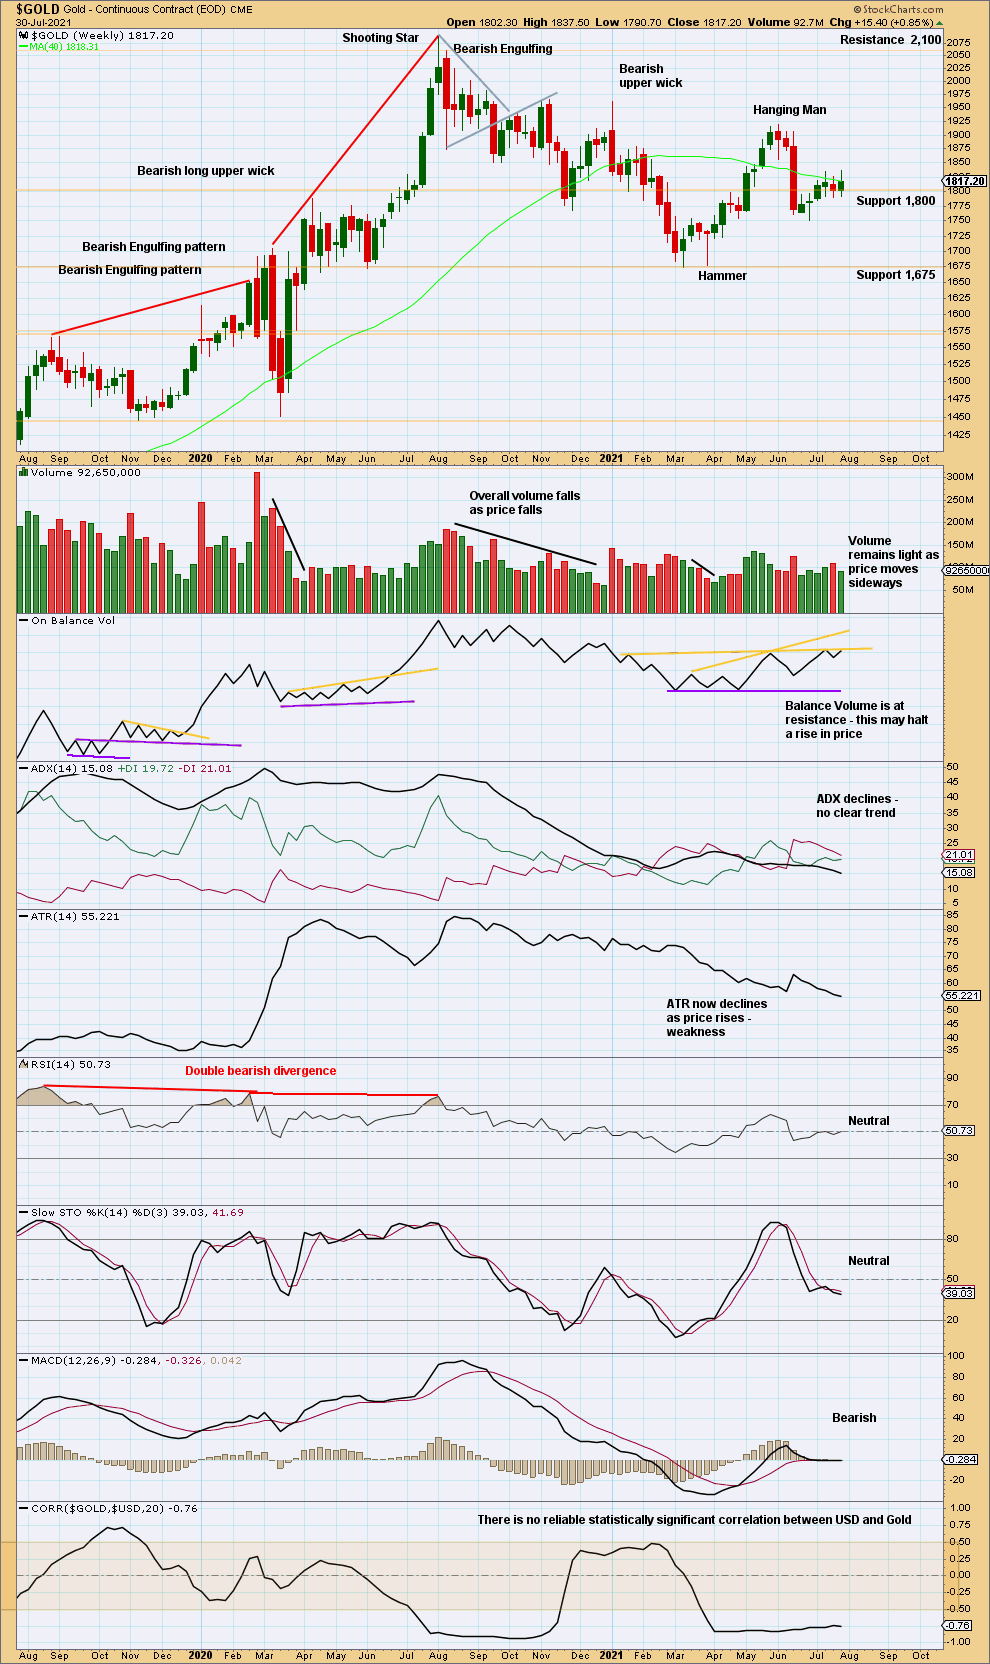
For recent weeks, volume has been strongest in the last downwards week. This is slightly bearish.
Price has not been able to break below and remain below support about 1,800. On Balance Volume suggests upwards movement here is limited.
DAILY CHART
Click chart to enlarge. Chart courtesy of StockCharts.com.
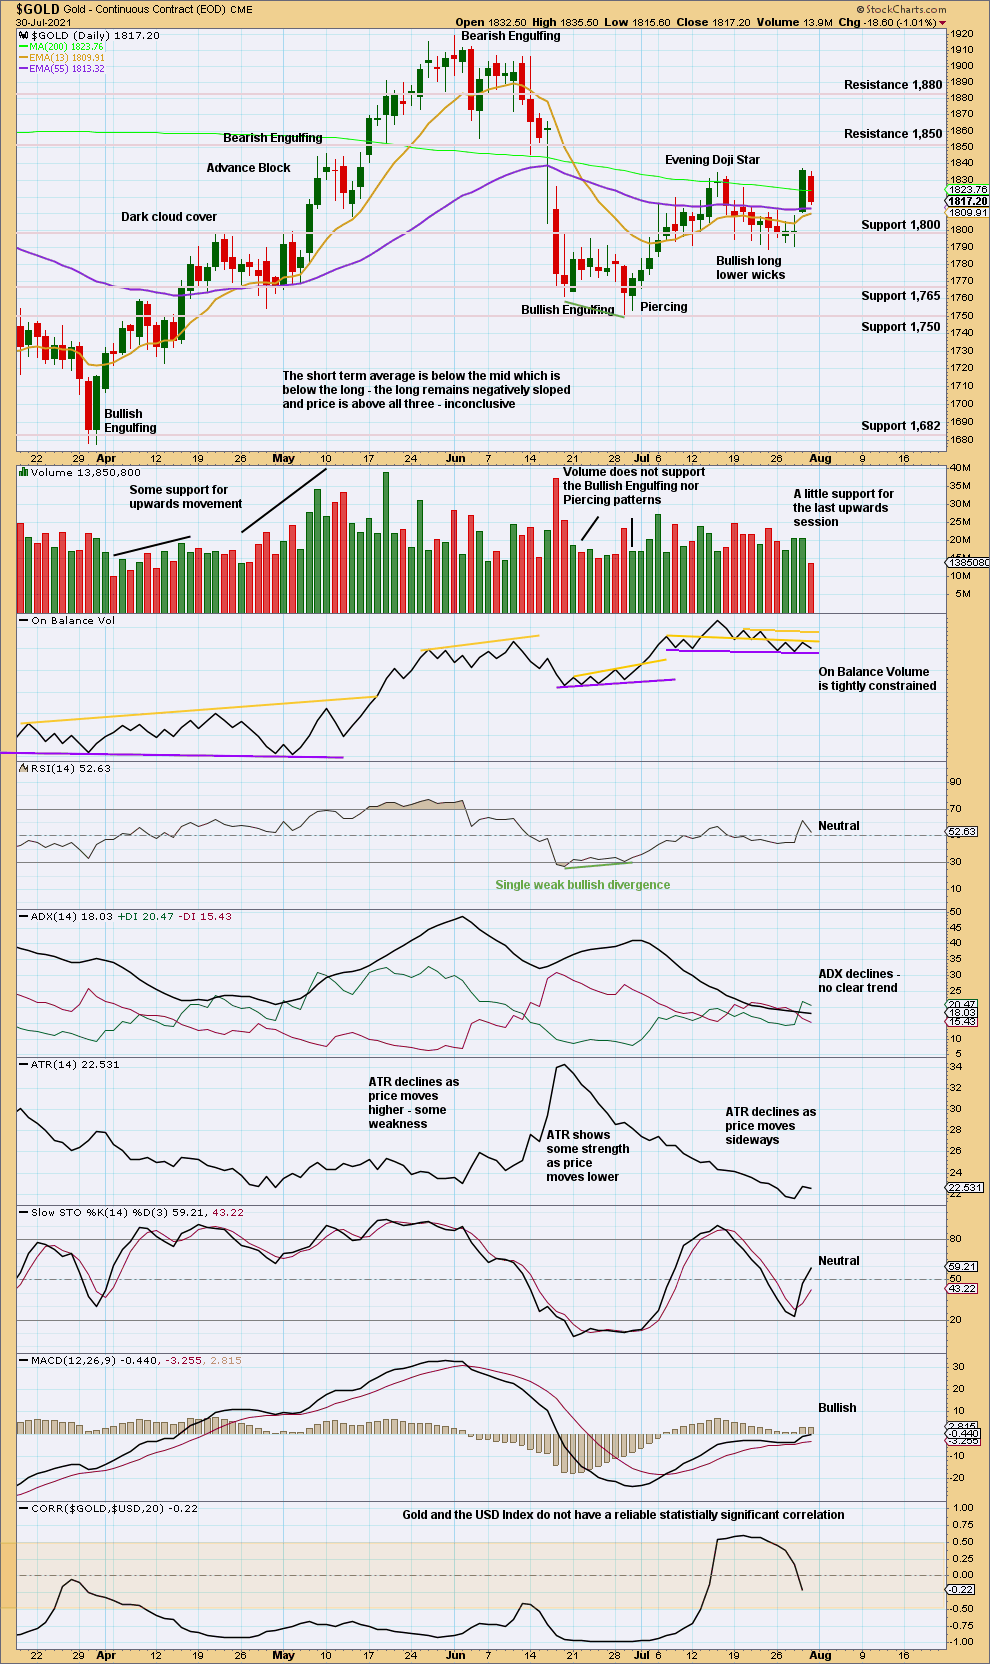
Price is nearing resistance. On Balance Volume is at weak resistance. ADX indicates no trend, but Stochastics is still well within neutral territory. Expect an upwards swing to continue until price is at resistance and Stochastics reaches overbought. Next resistance is about 1,850.
GDX WEEKLY CHART
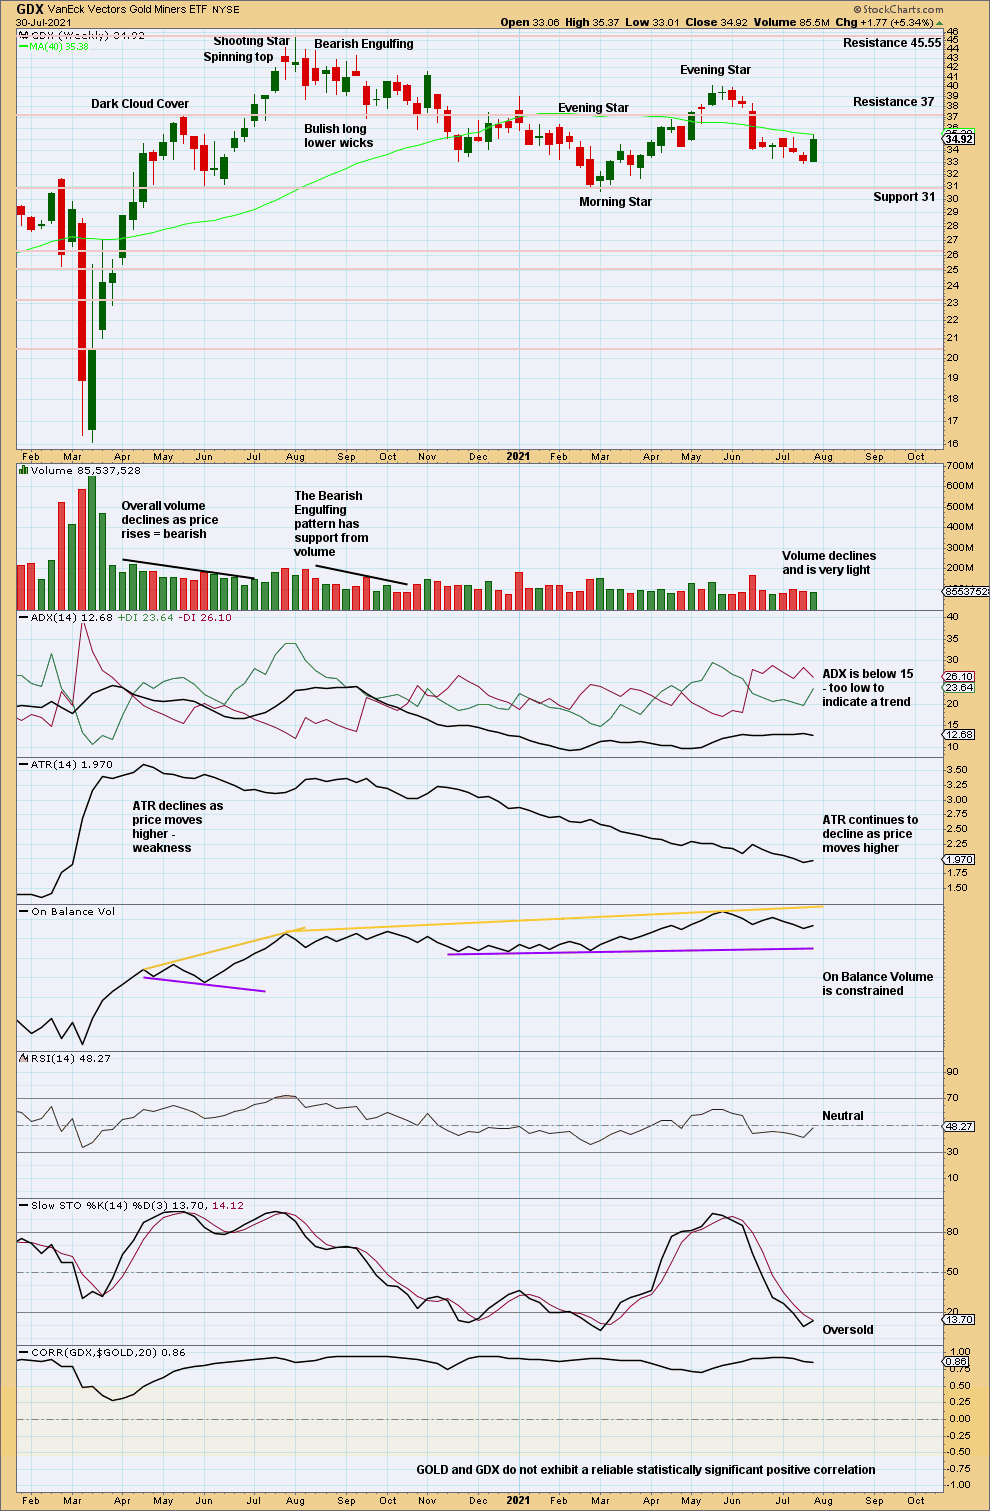
Click chart to enlarge. Chart courtesy of StockCharts.com.
Stochastics reached oversold in the last downwards swing, but price did not quite reach support. Now an upwards week suggests an upwards swing may continue until price reaches resistance and Stochastics reaches overbought.
GDX DAILY CHART
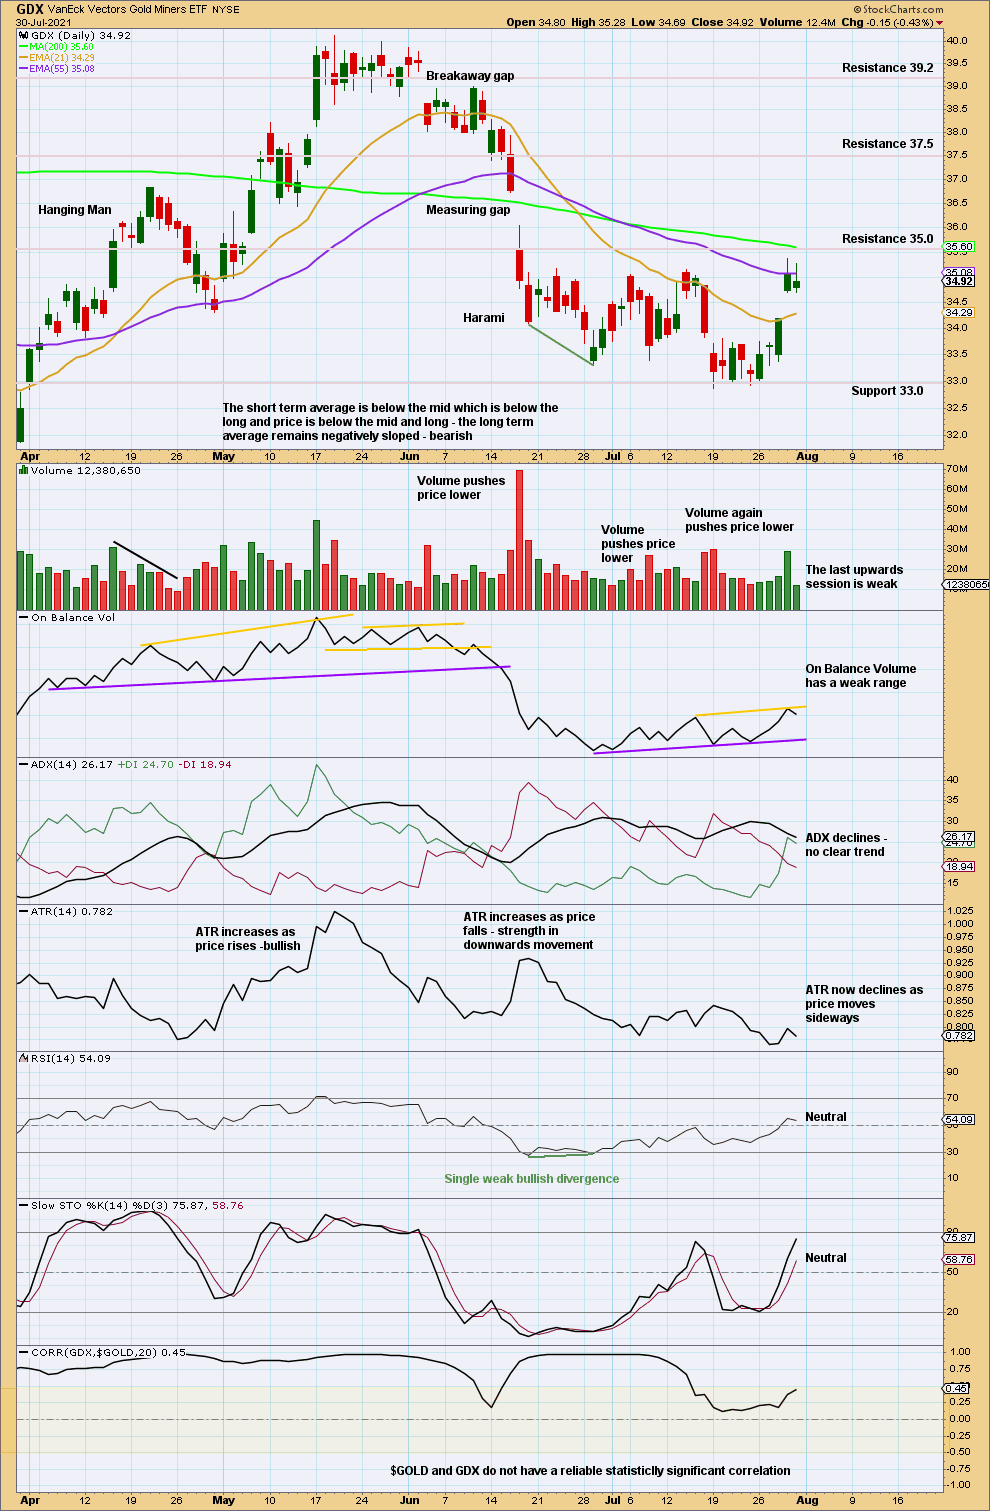
Click chart to enlarge. Chart courtesy of StockCharts.com.
Price is consolidating with resistance about 35 and support about 33.0. A breakout is required before confidence in the next direction may be had.
An upwards swing within the consolidation is now underway. Price is now very close to resistance at 35 and Stochastics is close to overbought. The upwards swing may end soon.
Published @ 06:09 p.m. ET.
—
Careful risk management protects your trading account(s).
Follow my two Golden Rules:
1. Always trade with stops.
2. Risk only 1-5% of equity on any one trade.
—
New updates to this analysis are in bold.
—