
Lara’s Weekly: Elliott Wave and Technical Analysis of S&P500 and Gold and US Oil | Charts – July 2, 2021

S&P 500
Again, further upwards movement was expected from the main Elliott wave count.
Summary: The primary trend remains up. Pullbacks are a normal and to be expected part of a bull market and are best used as buying opportunities, not as opportunities to go short against the main trend.
New targets for the Elliott wave count this week: short term 4,488, mid term 4,922, and long term 5,468.
The biggest picture, Grand Super Cycle analysis, is here.
Last monthly charts are here. Video is here.
MAIN ELLIOTT WAVE COUNT
WEEKLY CHART
Click chart to enlarge.
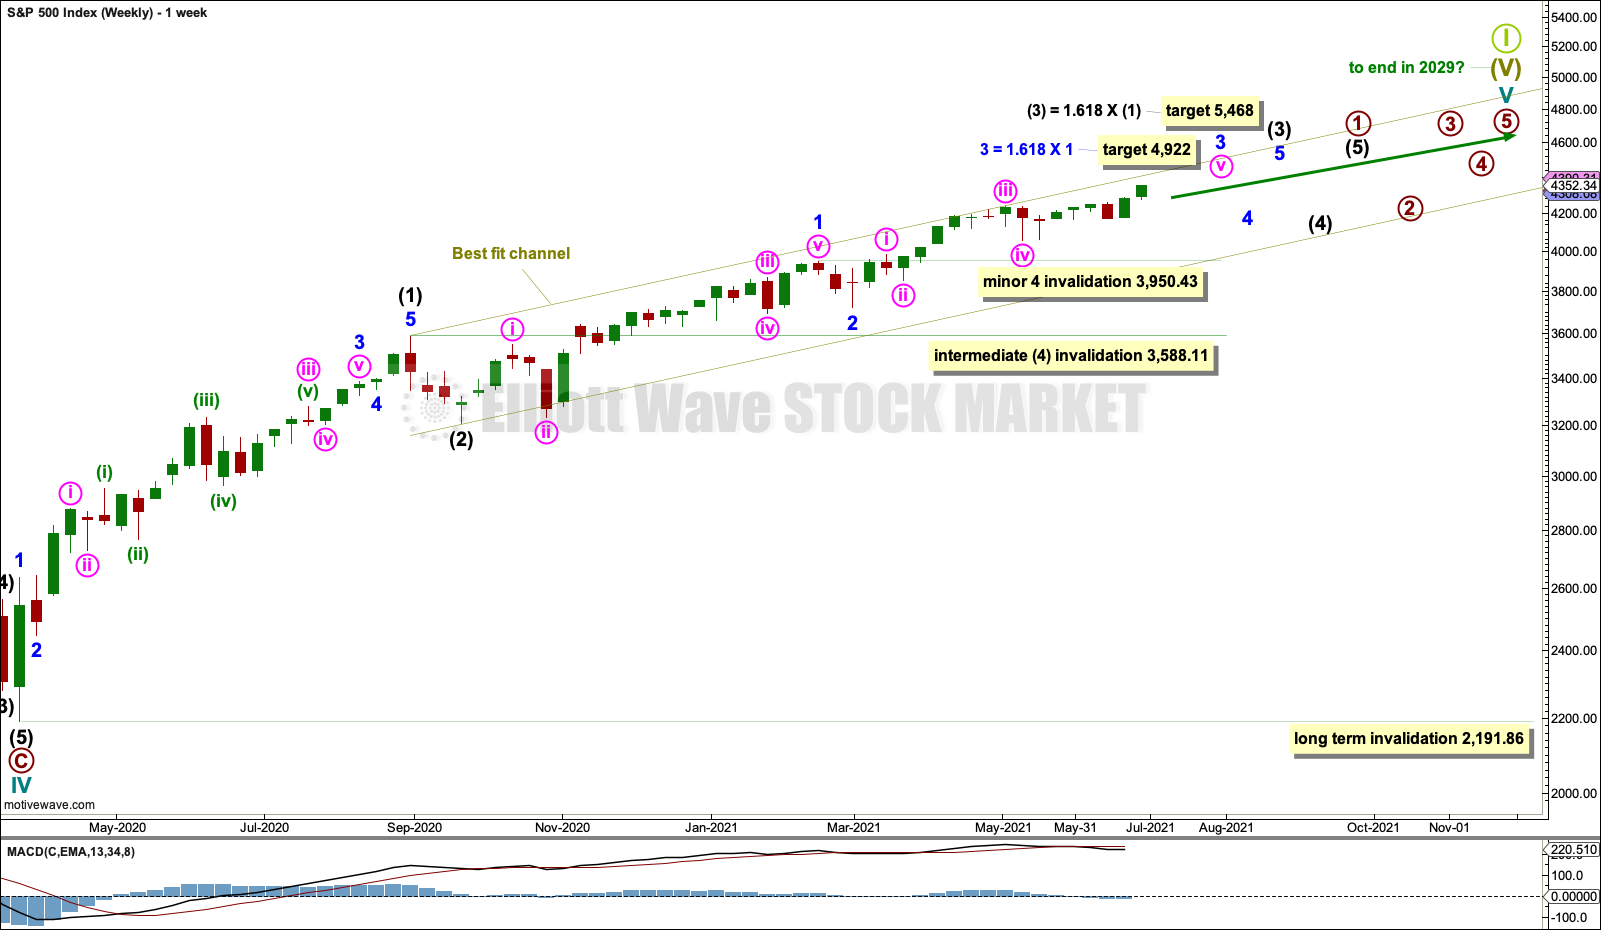
Cycle wave V may last from one to several years. So far it is in its sixteenth month.
This wave count may allow time for the AD line to diverge from price as price makes final highs before the end of the bull market. The AD line most commonly diverges a minimum of 4 months prior to the end of a bull market. A longer divergence is positively correlated with a deeper bear market. A shorter divergence is positively correlated with a more shallow bear market. With zero divergence at this stage, if a surprise bear market does develop here, then it would likely be shallow.
A longer divergence between price and the AD line would be expected towards the end of Grand Super Cycle wave I.
It is possible that cycle wave V may continue until 2029, if the 2020s mirror the 1920s. Either March or October 2029 may be likely months for the bull market to end.
Cycle wave V would most likely subdivide as an impulse. But if overlapping develops, then an ending diagonal should be considered. This chart considers the more common impulse.
There is already a Fibonacci ratio between cycle waves I and III within Super Cycle wave (V). The S&P500 often exhibits a Fibonacci ratio between two of its actionary waves but rarely between all three; it is less likely that cycle wave V would exhibit a Fibonacci ratio. The target for Super Cycle wave (V) to end would best be calculated at primary degree, but that cannot be done until all of primary waves 1, 2, 3 and 4 are complete.
Primary wave 1 within cycle wave V may be incomplete. This gives a very bullish wave count, expecting a long duration for cycle wave V which has not yet passed its middle strongest portion.
Within primary wave 1: Intermediate waves (1) and (2) may be complete, and intermediate wave (3) may now be approaching an end.
Minor waves 1 and 2 within intermediate wave (3) may be complete. A target is calculated for intermediate wave (3) that expects a common Fibonacci ratio to intermediate wave (1).
Intermediate wave (4) may not move into intermediate wave (1) price territory below 3,588.11.
Within intermediate wave (3), minor waves 1 and 2 may be complete. A target is calculated for minor wave 3 to reach a common Fibonacci ratio to minor wave 1.
A best fit channel is drawn about cycle wave V. Draw the first trend line from the end of intermediate wave (1) to the end of minute wave iii within minor wave 3, then place a parallel copy on the end of intermediate wave (2). The channel may need to be redrawn as price continues higher. The channel may show where price may find resistance and support along the way up.
When primary wave 1 may be complete, then a multi-month pullback or consolidation may unfold for primary wave 2. It is possible that primary wave 2 may meet the technical definition of a bear market; it may correct to 20% or more of market value.
Primary wave 2 may not move beyond the start of primary wave 1 below 2,191.86.
DAILY CHART
Click chart to enlarge.
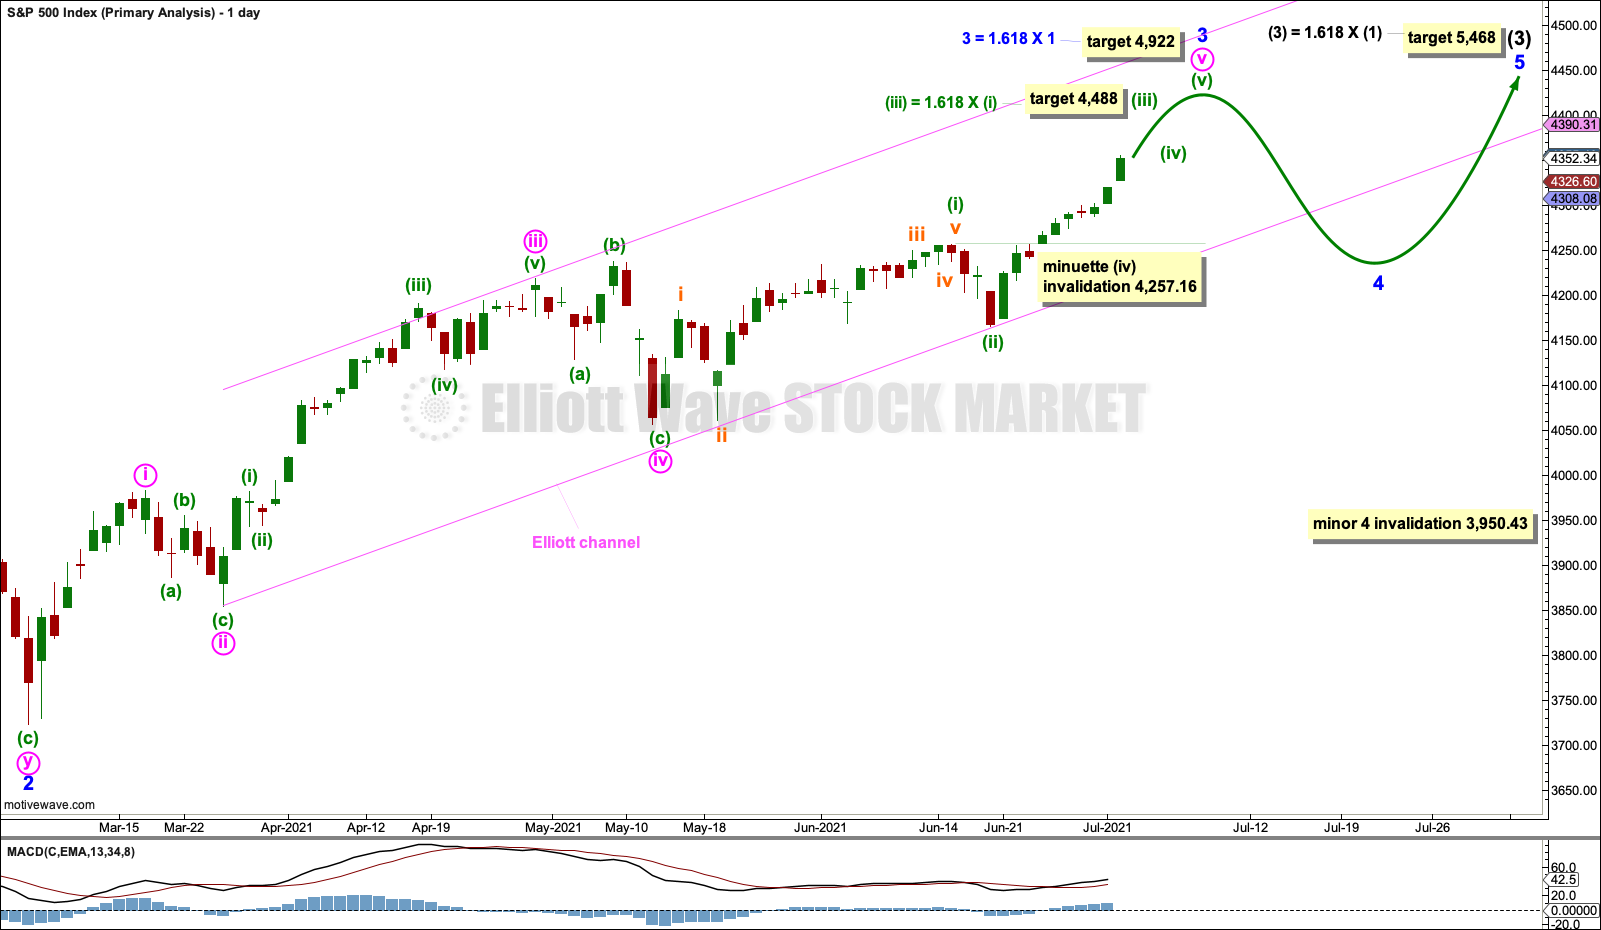
The daily chart focusses on minor wave 3 within intermediate wave (3). This labelling is changed from last analysis, and it fits with MACD.
Within minor wave 3: Minute waves i, ii, iii and iv may all be complete, and minute wave v may be extending.
Within minute wave v: Minuette waves (i) and (ii) may be complete, and minuette wave (iii) exhibits an increased slope.
Minuette wave (iv), when it arrives, may not move into minuette wave (i) price territory below 4,257.16.
Minuette wave (ii) lasted 3 sessions and saw price fall 2.18 of market value. Minuette wave (iv), when it arrives, may last from 3 sessions to about a week or so and would most likely be a shallow consolidation.
Draw an Elliott channel about minor wave 3 using Elliott’s second technique: Draw the first trend line from the ends of minute waves ii to iv, then place a parallel copy on the end of minute wave iii. Along the way up, the lower edge of this channel may provide support. Minute wave v may end about the upper edge.
TECHNICAL ANALYSIS
WEEKLY CHART
Click chart to enlarge. Chart courtesy of StockCharts.com.
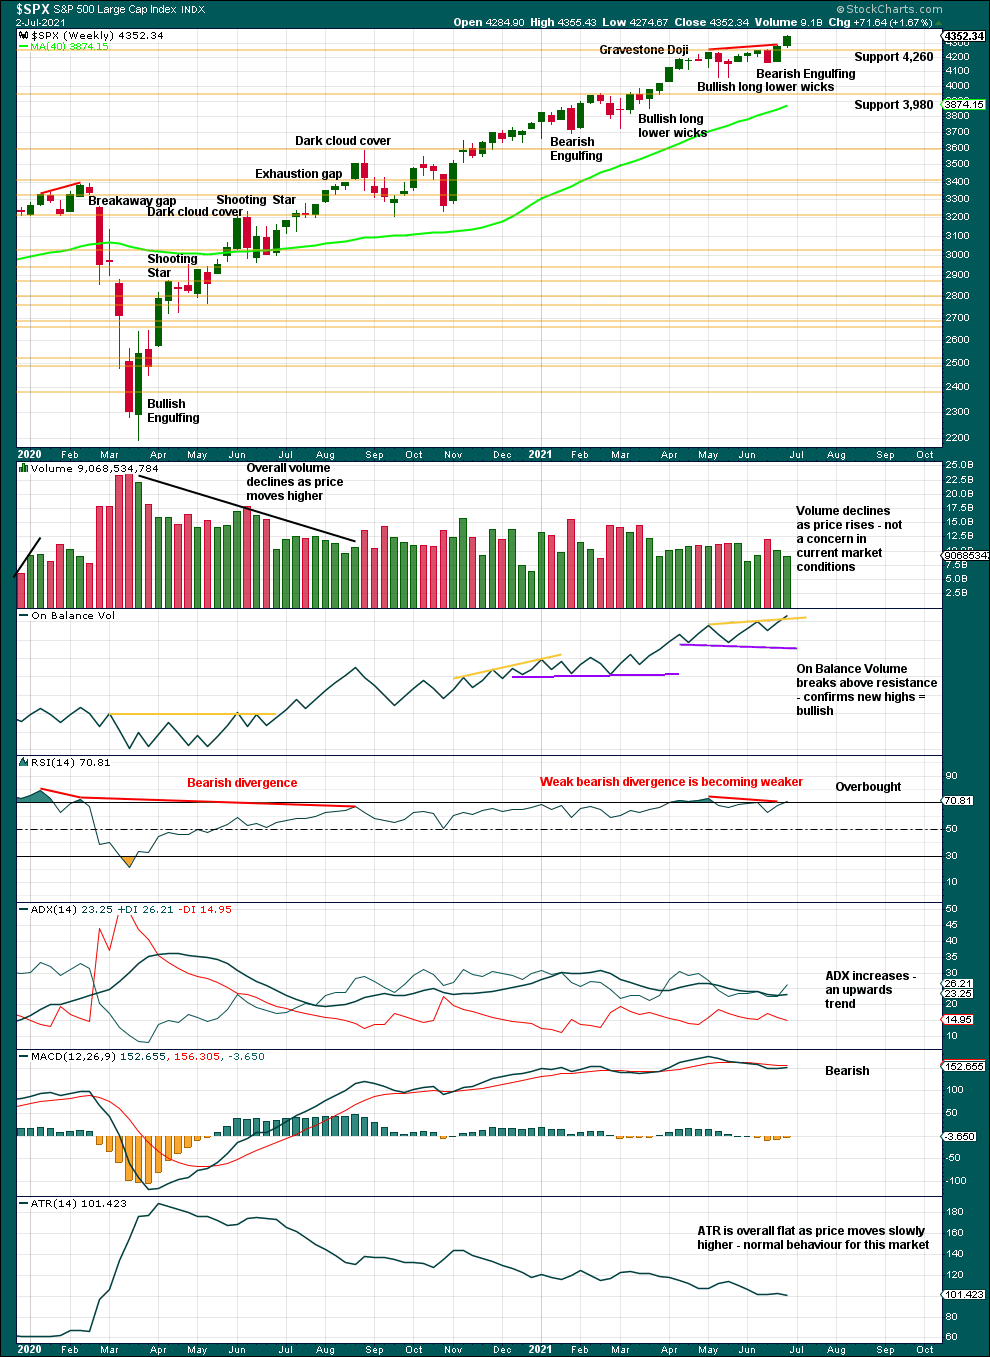
A series of higher highs and higher lows off the low of March 2020 continues. The last short-term swing low is now 4,164.40 on the 18th of June. While this remains intact, the dominant view should be of an upwards trend. There is a long way for this trend to run before conditions may become extreme.
On Balance Volume and ADX are bullish.
RSI is now just overbought again, but this indicator may reach extremely overbought and remain there for a long time when this market has a strong bullish trend.
DAILY CHART
Click chart to enlarge. Chart courtesy of StockCharts.com.
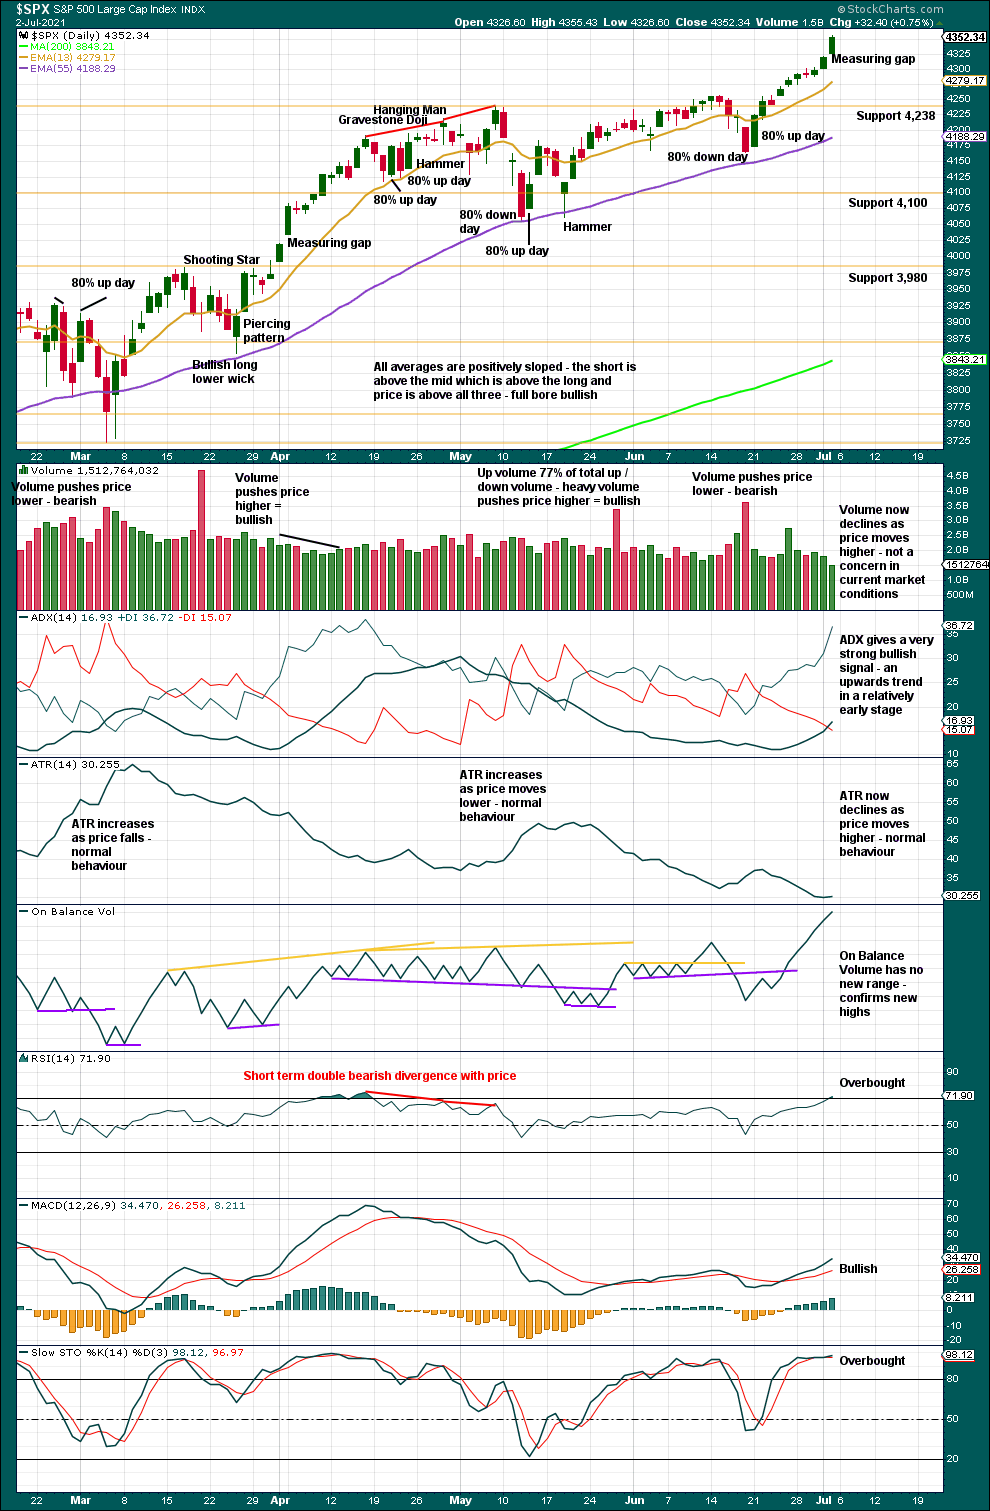
The measuring gap gives a target at 4,482.86.
ADX, On Balance Volume and MACD are all bullish. RSI is just now overbought, but it can reach deeply overbought and remain there for a long time. There is no bearish divergence between swing highs from RSI at this time.
BREADTH – AD LINE
WEEKLY CHART
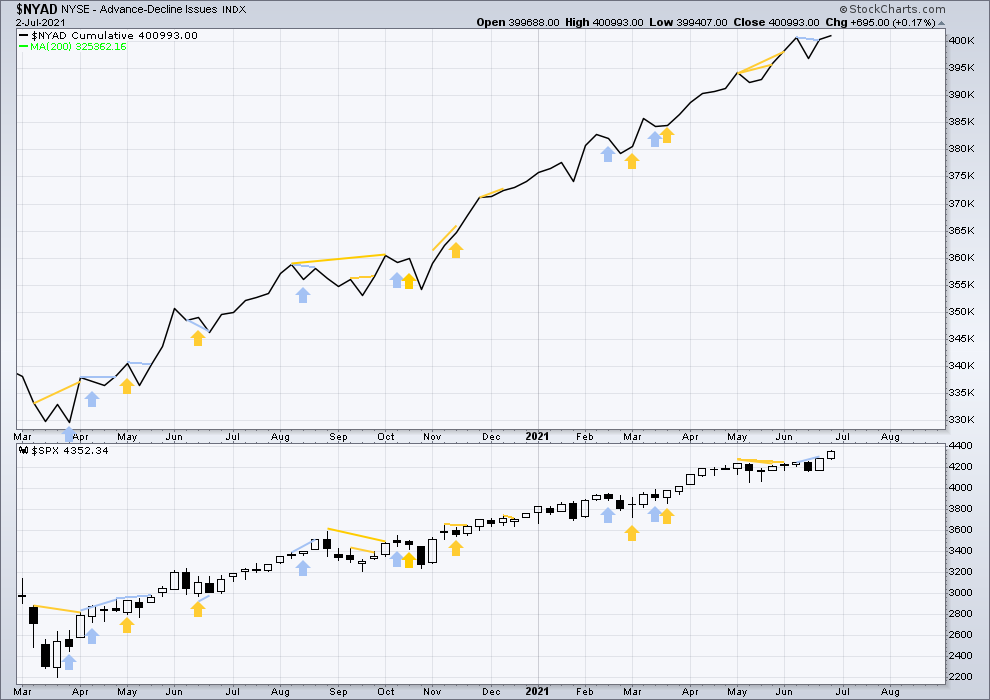
Click chart to enlarge. Chart courtesy of StockCharts.com. So that colour blind members are included, bearish signals will be noted with blue and bullish signals with yellow.
Breadth should be read as a leading indicator.
Lowry’s Operating Companies Only AD line has made a new all time high on the 8th of June. With zero bearish divergence at the last high, any pullbacks here would most likely be short term in nature. Pullbacks in a relatively healthy bull market may be used as buying opportunities.
Large caps all time high: 4,355.43 on Jul 02, 2021.
Mid caps all time high: 2,778.84 on April 29, 2021.
Small caps all time high: 1,417.45 on June 8, 2021.
This rise is led by large caps, which is a feature of an aged bull market. This fits the Elliott wave count that sees a fifth wave to end a third wave completing. This may continue for some time before a larger pullback arrives.
This week both price and the AD line have made new all time highs, negating the bearish divergence noted last week.
DAILY CHART
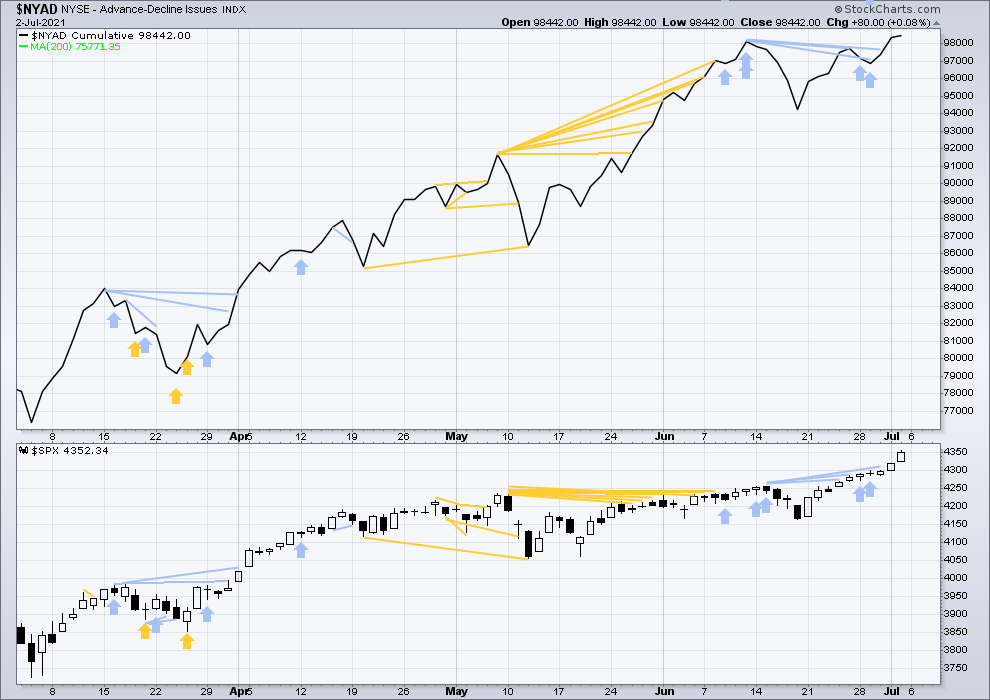
Click chart to enlarge. Chart courtesy of StockCharts.com. So that colour blind members are included, bearish signals will be noted with blue and bullish signals with yellow.
Large caps are leading. This is a feature of an aged bull market, which may fit the Elliott wave count that sees a fifth wave nearing an end. This weakness may continue for a while before a larger correction arrives.
On Friday both price and the AD line have made new all time highs. There is no short-term divergence.
Before this upwards trend ends and a larger pullback arrives, the AD line may again provide bearish signals. With no bearish signals at this time, any pullbacks which may develop here may most likely be short term in nature.
VOLATILITY – INVERTED VIX CHART
WEEKLY CHART
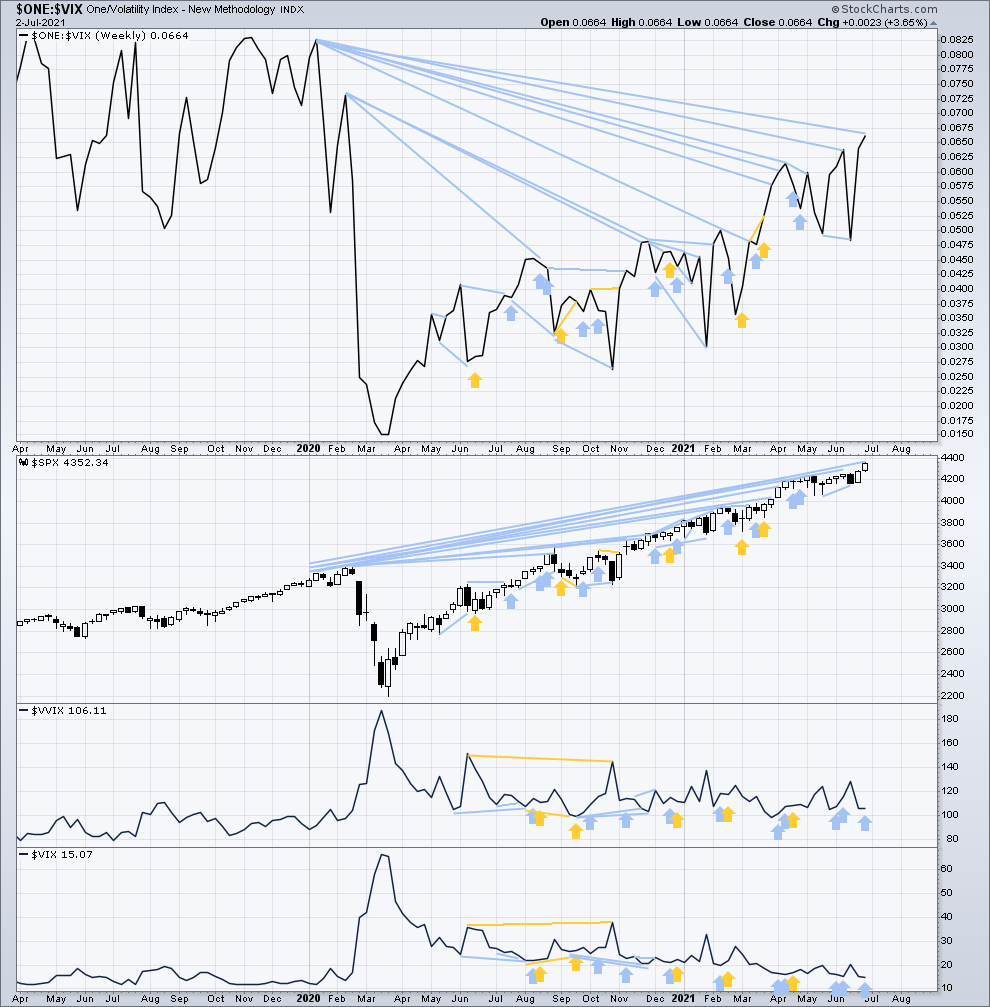
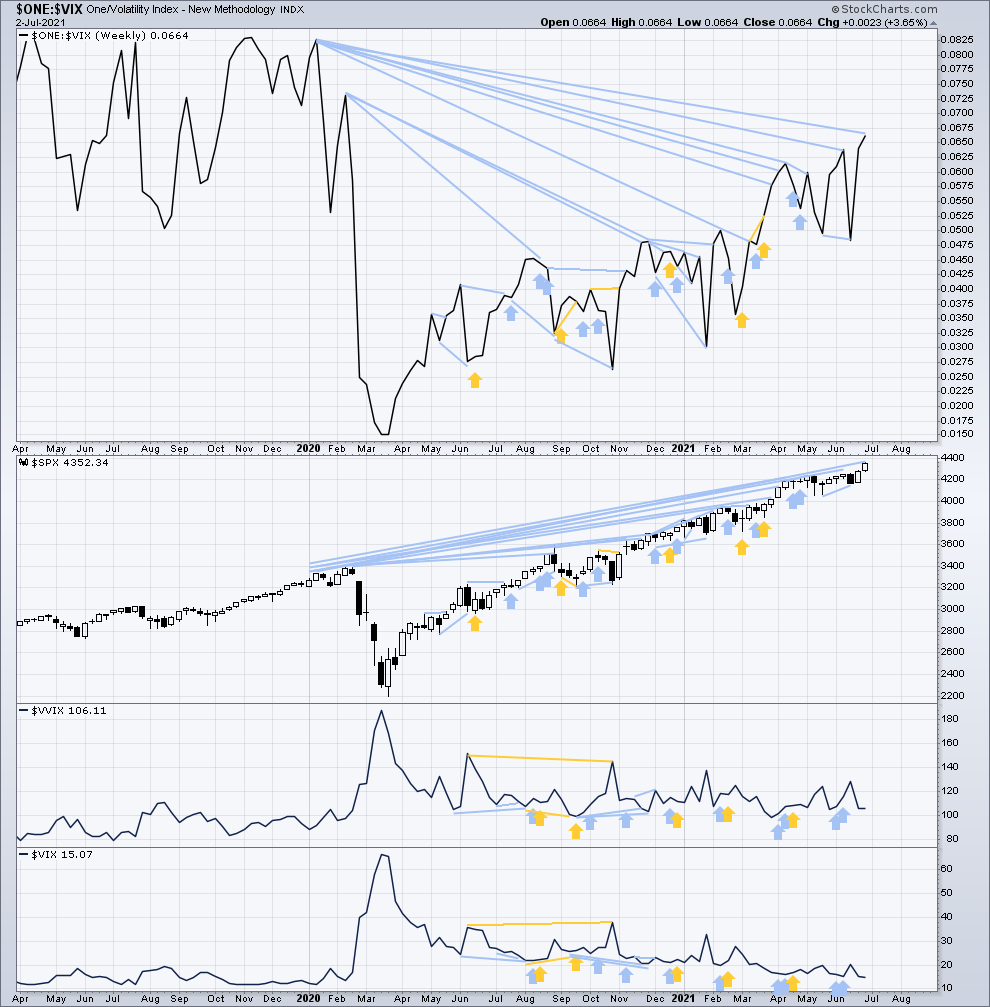
Click chart to enlarge. Chart courtesy of StockCharts.com. So that colour blind members are included, bearish signals will be noted with blue and bullish signals with yellow.
Inverted VIX remains well below all time highs. The all time high for inverted VIX was in the week beginning October 30, 2017. There is over 3 years of bearish divergence between price and inverted VIX. This bearish divergence may develop further before the bull market ends. It may be a very early indicator of an upcoming bear market, but it is not proving to be useful in timing.
This week both price and inverted VIX have moved higher. Mid-term bearish divergence remains.
Comparing VIX and VVIX at the weekly chart level:
This week VVIX has moved slightly higher while VIX has moved lower. This divergence is bearish for price, but it is weak and short term.
DAILY CHART
Click chart to enlarge. Chart courtesy of StockCharts.com. So that colour blind members are included, bearish signals will be noted with blue and bullish signals with yellow.
Both price and inverted VIX have moved higher. There is no short-term divergence.
Comparing VIX and VVIX at the daily chart level:
Both VIX and VVIX have moved lower. VIX has made a new short-term low below the 25th of June, but VVIX has not. This divergence is bearish for price for the short term, but it is reasonably weak.
DOW THEORY
Dow Theory confirms a new bull market with new highs made on a closing basis:
DJIA: 29,568.57 – closed above on 16th November 2020.
DJT: 11,623.58 – closed above on 7th October 2020.
Most recently, on 10th May 2021 both DJIA and DJT have made new all time highs. An ongoing bull market is again confirmed by Dow Theory.
Adding in the S&P and Nasdaq for an extended Dow Theory, confirmation of a bull market would require new highs made on a closing basis:
S&P500: 3,393.52 – closed above on 21st August 2020.
Nasdaq: 9,838.37 – closed above on June 8, 2020.
The following major swing lows would need to be seen on a closing basis for Dow Theory to confirm a change from bull to a bear market:
DJIA: 18,213.65
DJT: 6,481.20
Adding in the S&P and Nasdaq for an extended Dow Theory, confirmation of a new bear market would require new lows on a closing basis:
S&P500: 2,191.86
Nasdaq: 6,631.42
GOLD
Upwards movement continues to end the week as both Elliott wave counts expected.
Summary: A multi-week to multi-month bounce may have begun. A target for resistance is at 1,814 or 1,853.
Grand SuperCycle analysis and last monthly charts are here.
MAIN ELLIOTT WAVE COUNT
WEEKLY CHART
Click chart to enlarge.
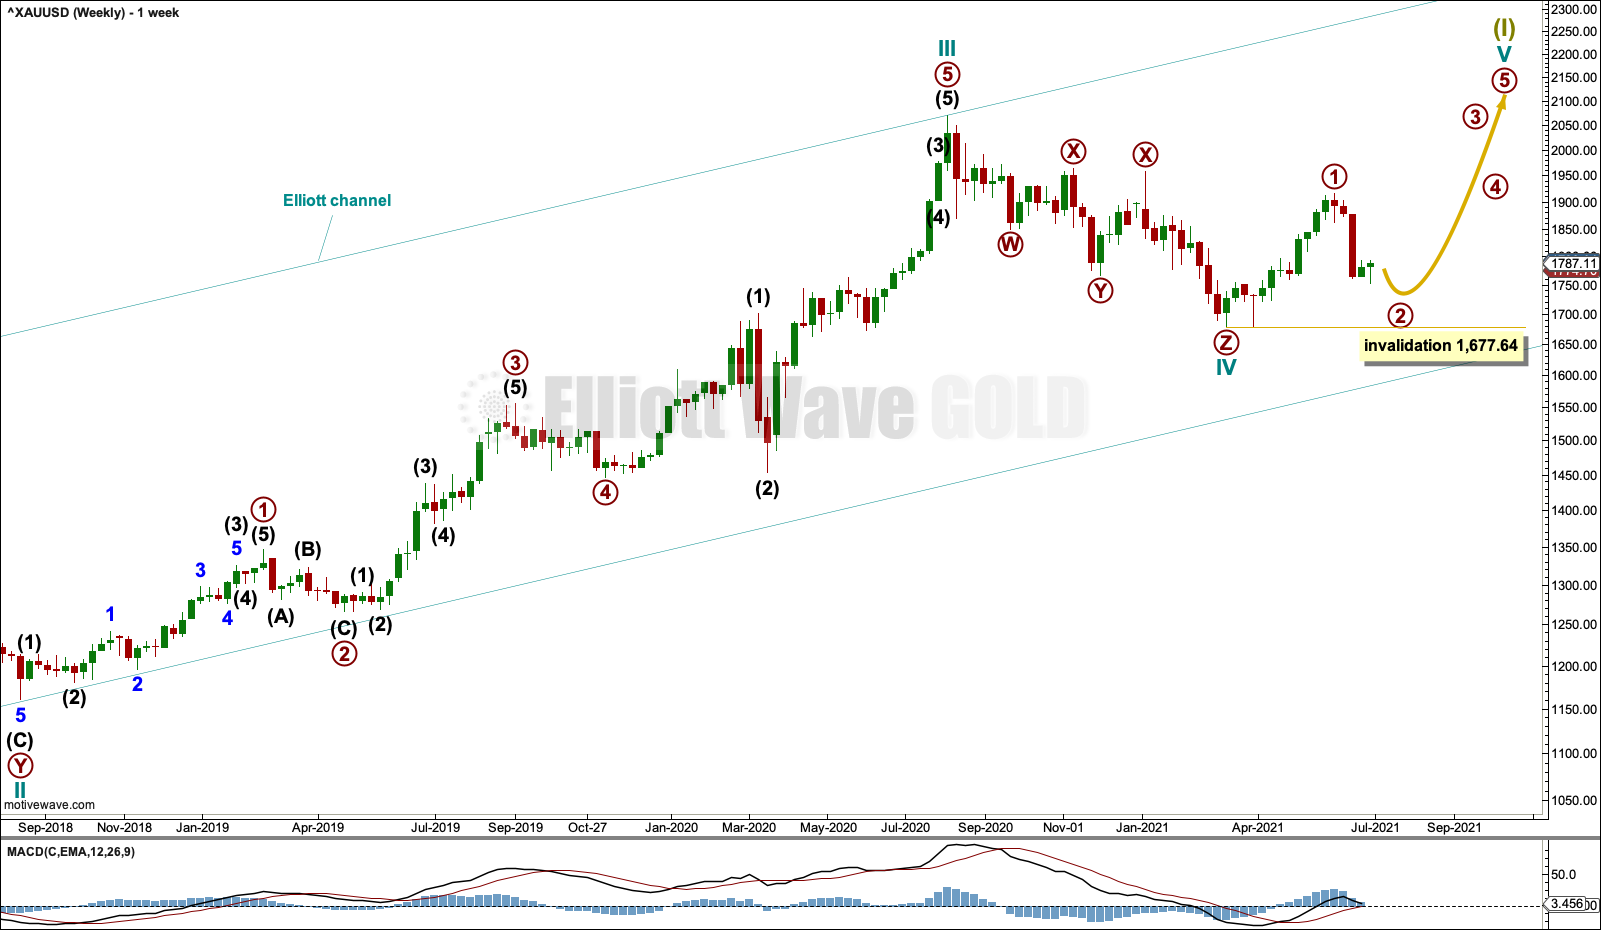
This wave count sees the the bear market complete at the last major low for Gold on 3 December 2015.
If Gold is in a new bull market, then it should begin with a five wave structure upwards on the weekly chart.
Cycle wave I fits as a five wave impulse with reasonably proportionate corrections for primary waves 2 and 4.
Cycle wave II fits as a double flat. However, within the first flat correction labelled primary wave W, this wave count needs to ignore what looks like an obvious triangle from July to September 2016 (this can be seen labelled as a triangle on the second weekly chart on prior analysis here). This movement must be labelled as a series of overlapping first and second waves. Ignoring this triangle reduces the probability of this wave count in Elliott wave terms.
Cycle wave IV may be a complete triple zigzag. Triple zigzags are not rare structures, but they are not common. The probability of this wave count is further reduced in Elliott wave terms. This is one reason why an alternate is still considered.
Cycle wave V may have begun. Within cycle wave V: Primary wave 1 may be over at the last high, and primary wave 2 may not move beyond the start of primary wave 1 below 1,677.64.
DAILY CHART
Click chart to enlarge.
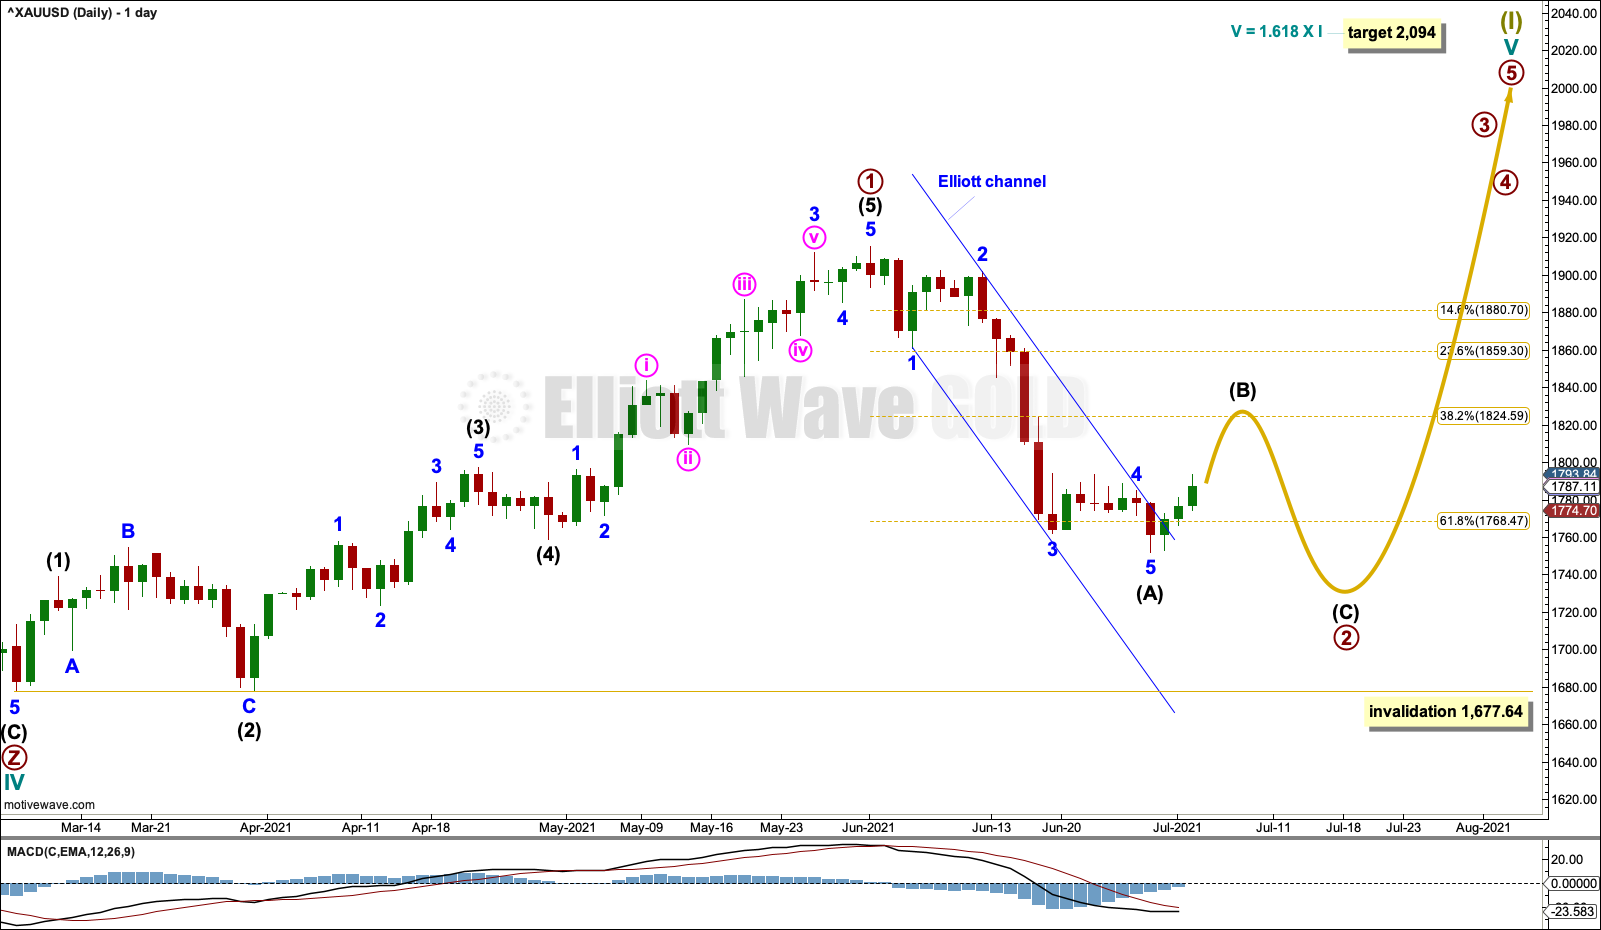
A target is calculated for cycle wave V. If this target is wrong for this wave count, then it may be too low. As price approaches the target, if the structure is incomplete, then a higher target may be calculated.
Primary wave 1 within cycle wave V may be complete.
Primary wave 2 may be an incomplete zigzag. Within primary wave 2: Intermediate wave (A) may be complete, and intermediate wave (B) may unfold over a few weeks. Thereafter, intermediate wave (C) may continue lower and should make a new low below the end of intermediate wave (A) to avoid a truncation. When the end of intermediate wave (B) and the start of intermediate wave (C) is known, then the Fibonacci ratio between intermediate waves (A) and (C) may be used to calculate a target for intermediate wave (C).
Draw an Elliott channel about intermediate wave (A). This channel is now breached by upwards movement, indicating intermediate wave (B) should have arrived.
Primary wave 2 may not move beyond the start of primary wave 1 below 1,677.64.
ALTERNATE ELLIOTT WAVE COUNT
WEEKLY CHART
Click chart to enlarge.
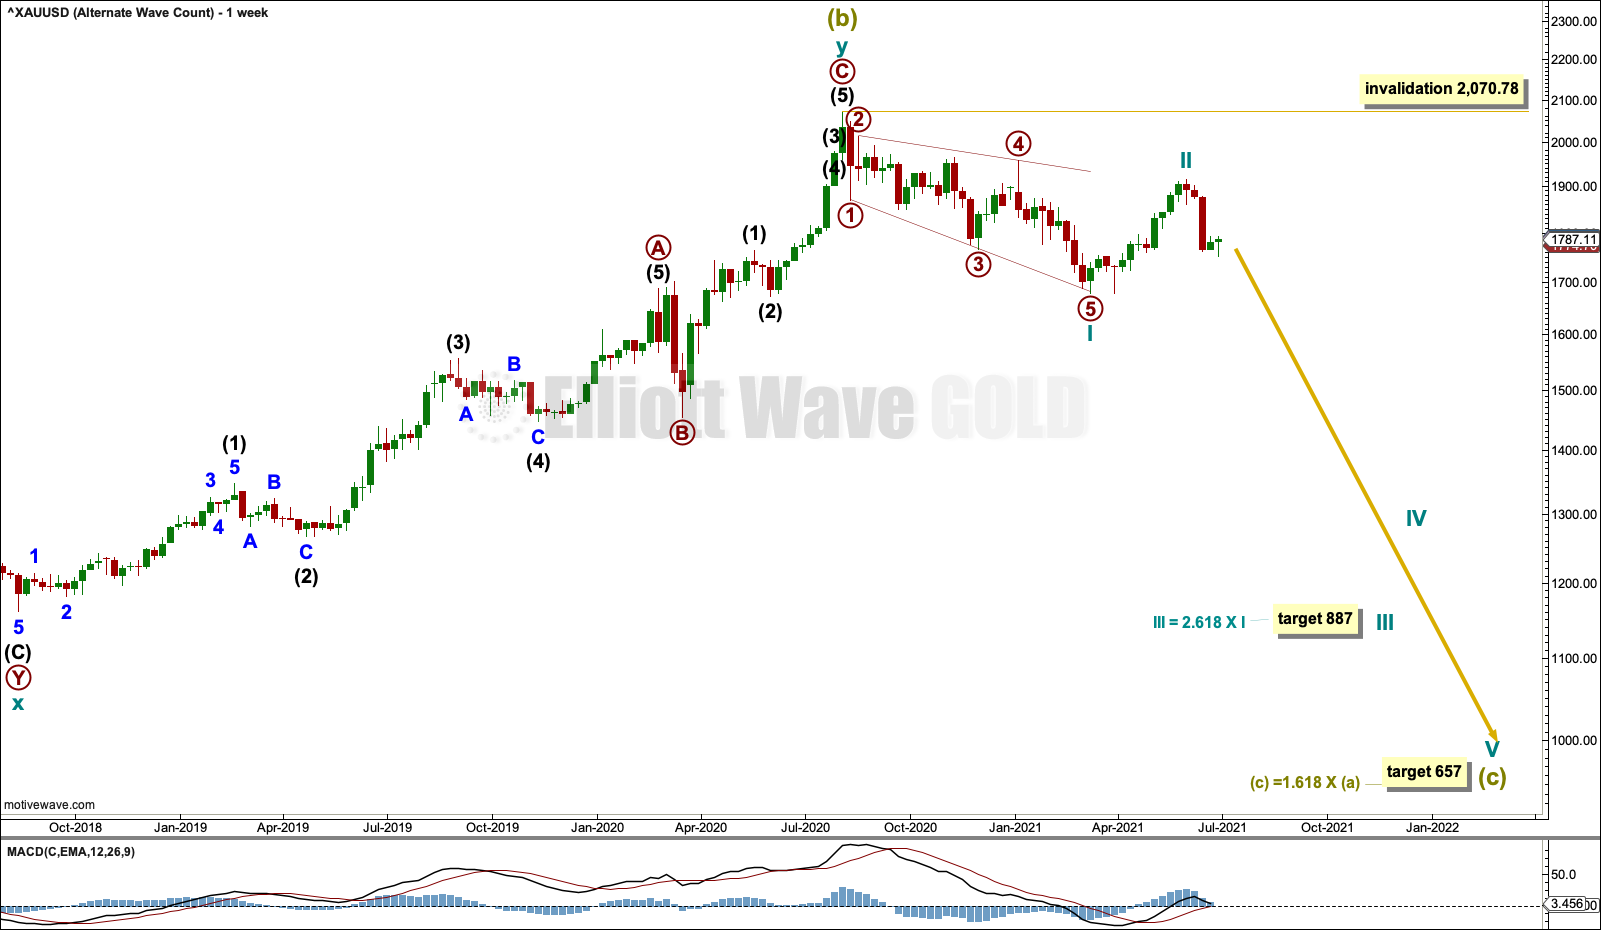
The bigger picture for this alternate Elliott wave count sees Gold as within a bear market, in a three steps back pattern that is labelled Grand Super Cycle wave IV on monthly charts. Grand Super Cycle wave IV may be subdividing as an expanded flat pattern.
Super Cycle wave (b) within Grand Super Cycle wave IV may be a complete double zigzag. This wave count expects Super Cycle wave (c) to move price below the end of Super Cycle wave (a) at 1,046.27 to avoid a truncation and a very rare running flat. The target calculated expects a common Fibonacci ratio for Super Cycle wave (c).
Super Cycle wave (c) may have begun with a leading expanding diagonal for cycle wave I. Leading expanding diagonals in first wave positions are uncommon, so the probability of this wave count is reduced. However, it has a good fit and must be considered.
Second wave corrections to follow leading diagonals in first wave positions are usually very deep. Cycle wave II is deep and the structure may be complete; so far it is following a common pattern. If it continues higher, then cycle wave II may not move beyond the start of cycle wave I above 2,070.78.
DAILY CHART
Click chart to enlarge.
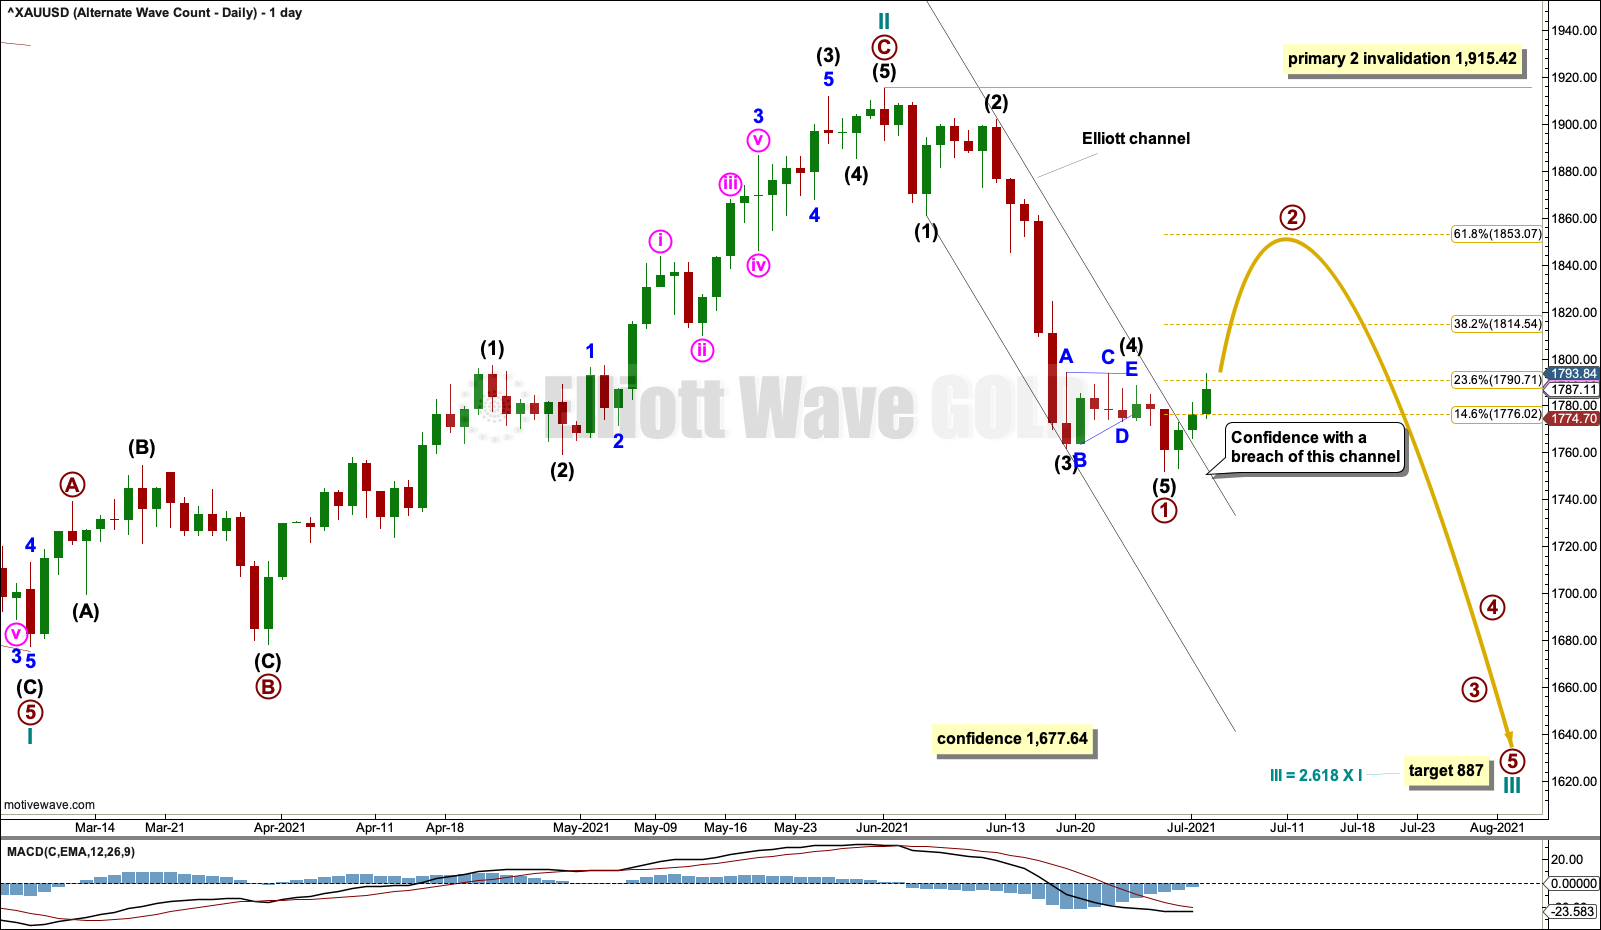
A target is calculated for cycle wave III.
Primary wave 1 within cycle wave III may be complete.
Draw an Elliott channel about primary wave 1. The channel is now breached providing some confidence that primary wave 1 should be over and primary wave 2 may now be underway.
Primary wave 2 may last weeks to months. Targets for resistance are the 0.382 Fibonacci ratio at 1,814.54 and the 0.618 Fibonacci ratio at 1,853.07.
Primary wave 2 may not move beyond the start of primary wave 1 above 1,915.42.
TECHNICAL ANALYSIS
WEEKLY CHART
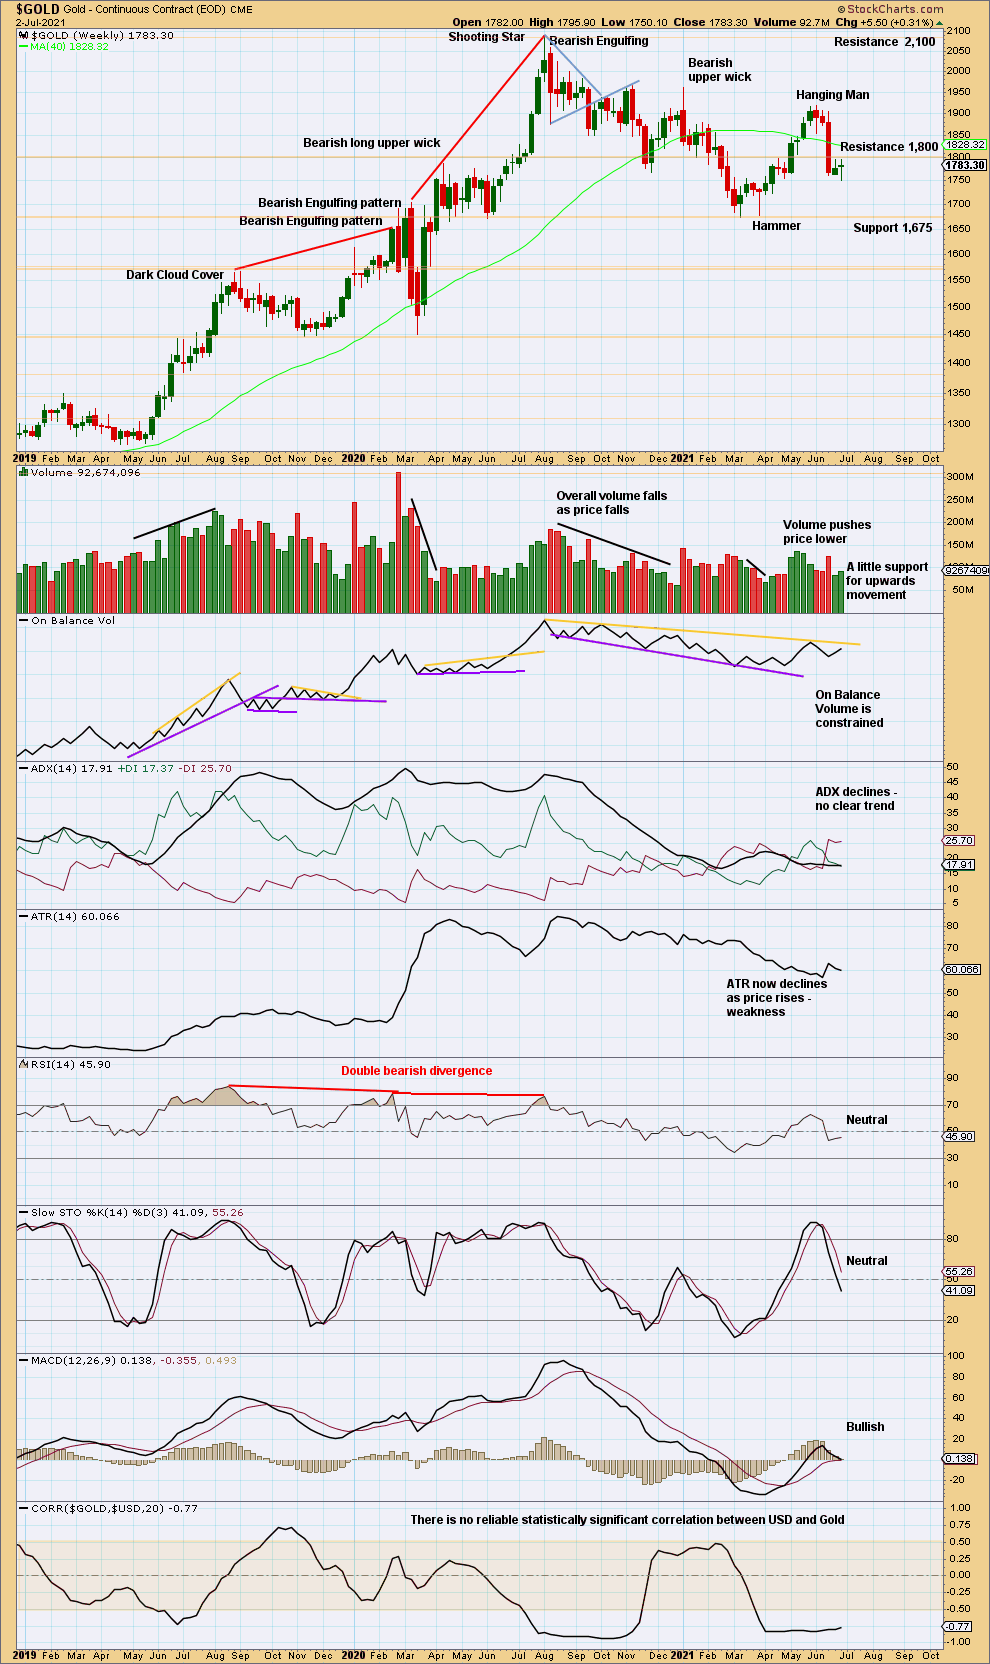
Click chart to enlarge. Chart courtesy of StockCharts.com.
A little support for upwards movement from volume this week suggests more upwards movement next week.
DAILY CHART
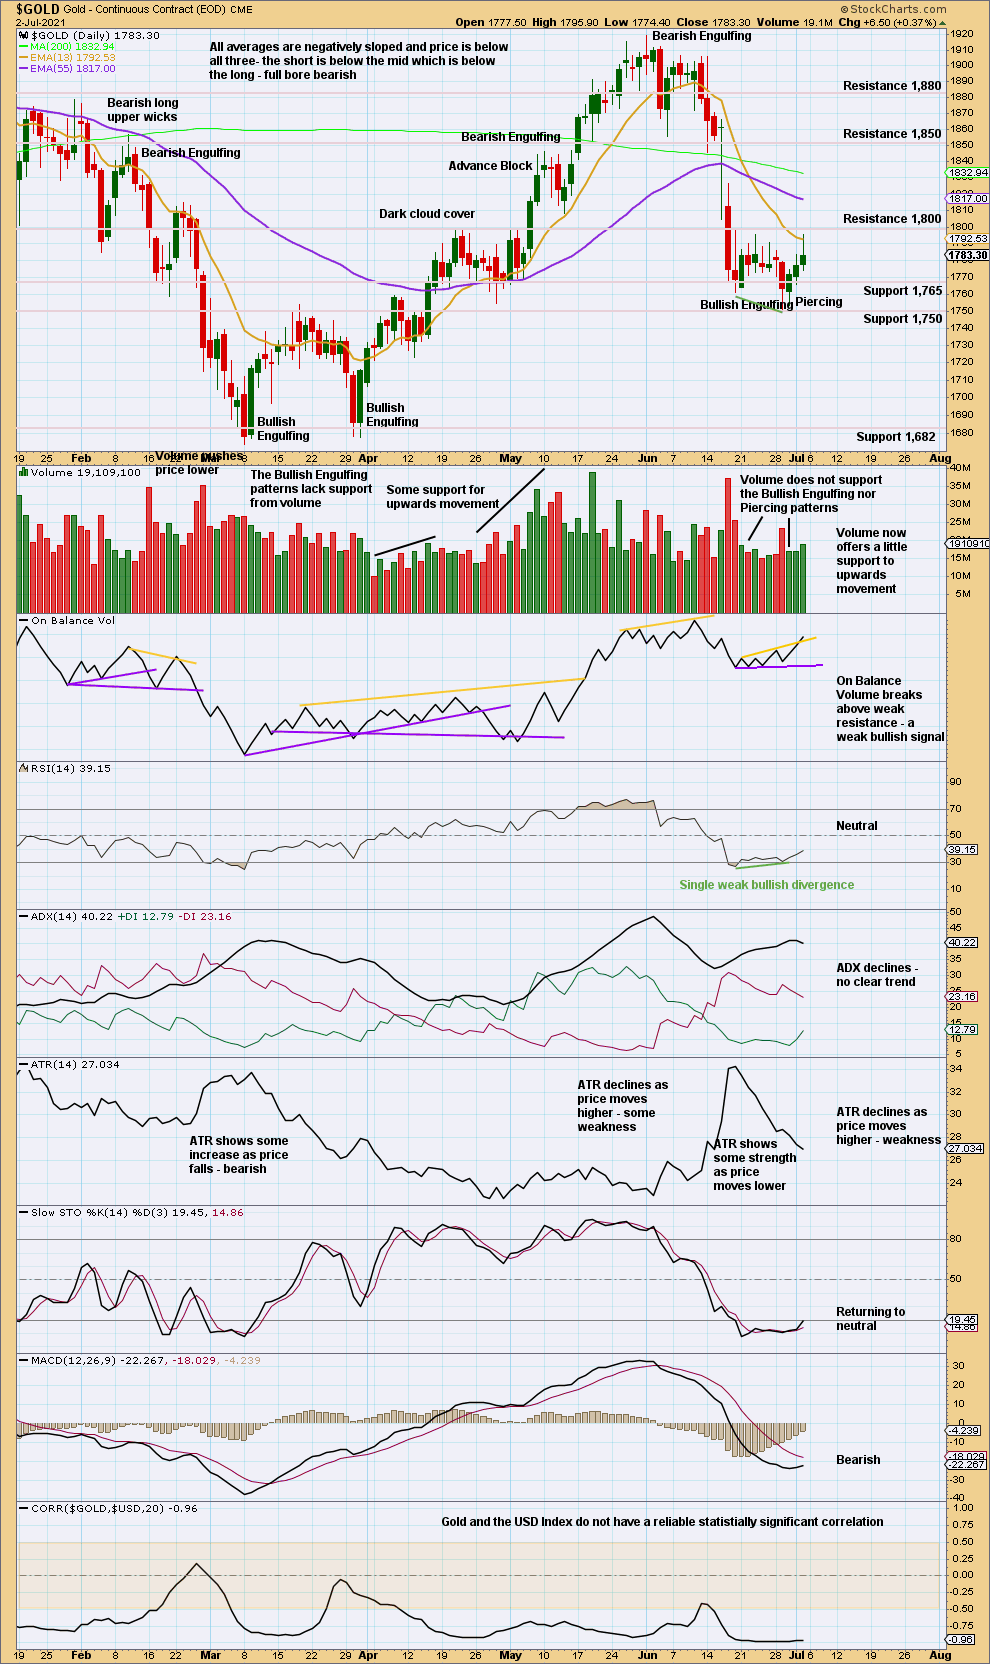
Click chart to enlarge. Chart courtesy of StockCharts.com.
Price has bounced up off support about 1,750.
After the prior downwards trend reached extreme and RSI exhibited bullish divergence, some upwards or sideways movement may continue here to relieve extreme conditions. Look for resistance as identified on the chart; if Stochastics reaches overbought when price reaches resistance, then expect an upwards swing may complete there or shortly after.
GDX WEEKLY CHART
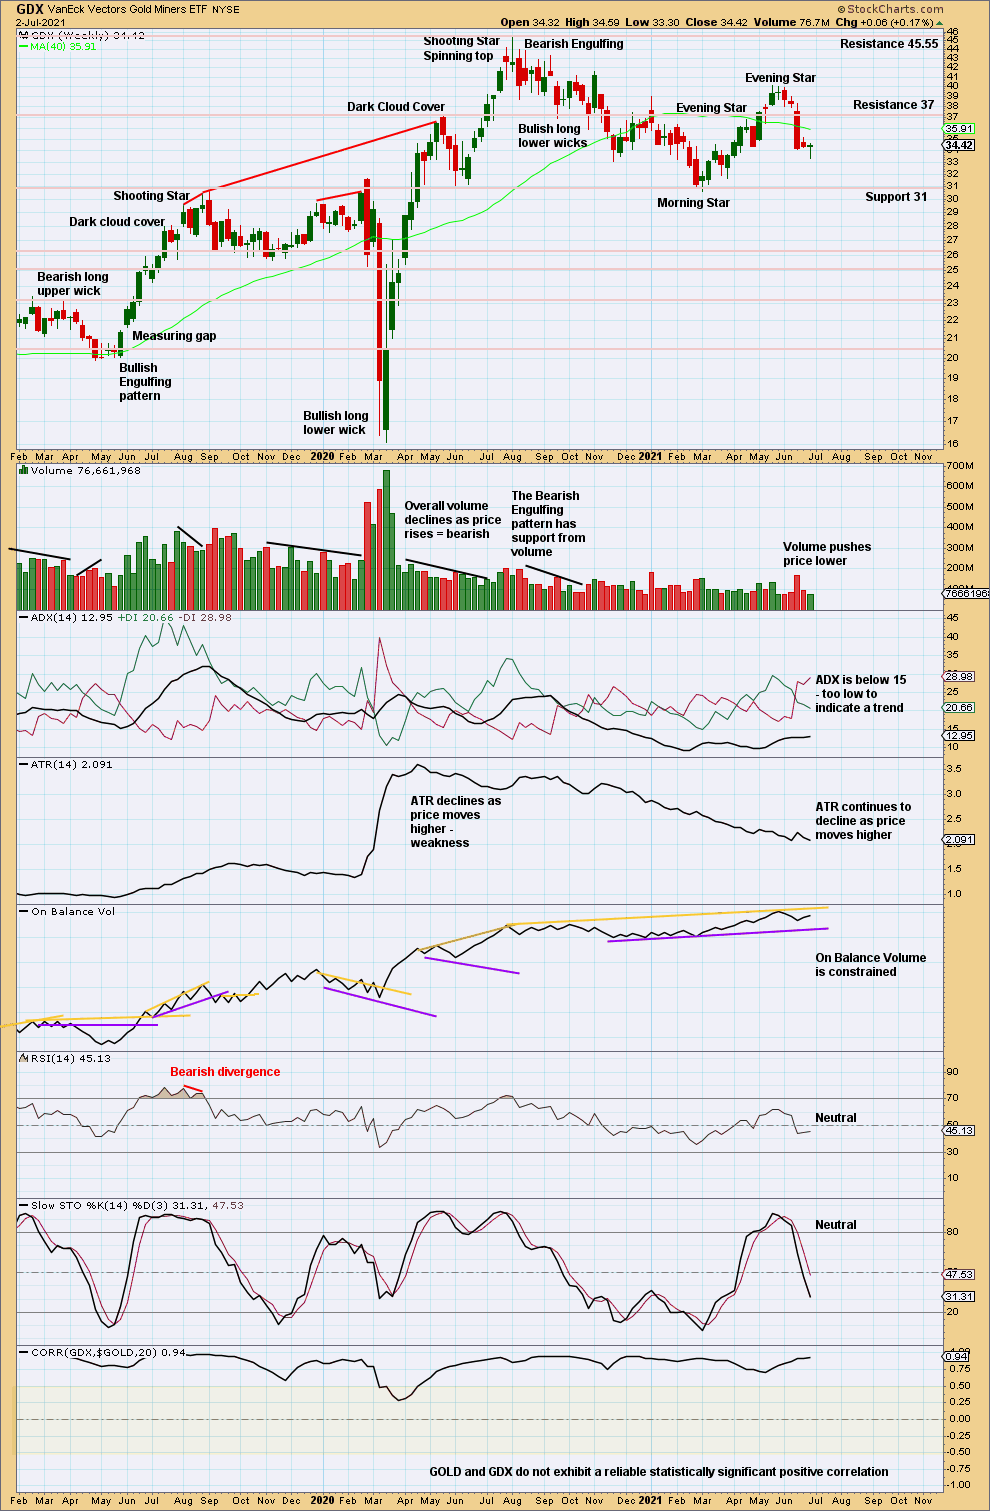
Click chart to enlarge. Chart courtesy of StockCharts.com.
A long legged doji this week may be a pause within an ongoing downwards trend, or it may be part of a bullish reversal. The next weekly candlestick will determine if a reversal pattern is forming here.
GDX DAILY CHART
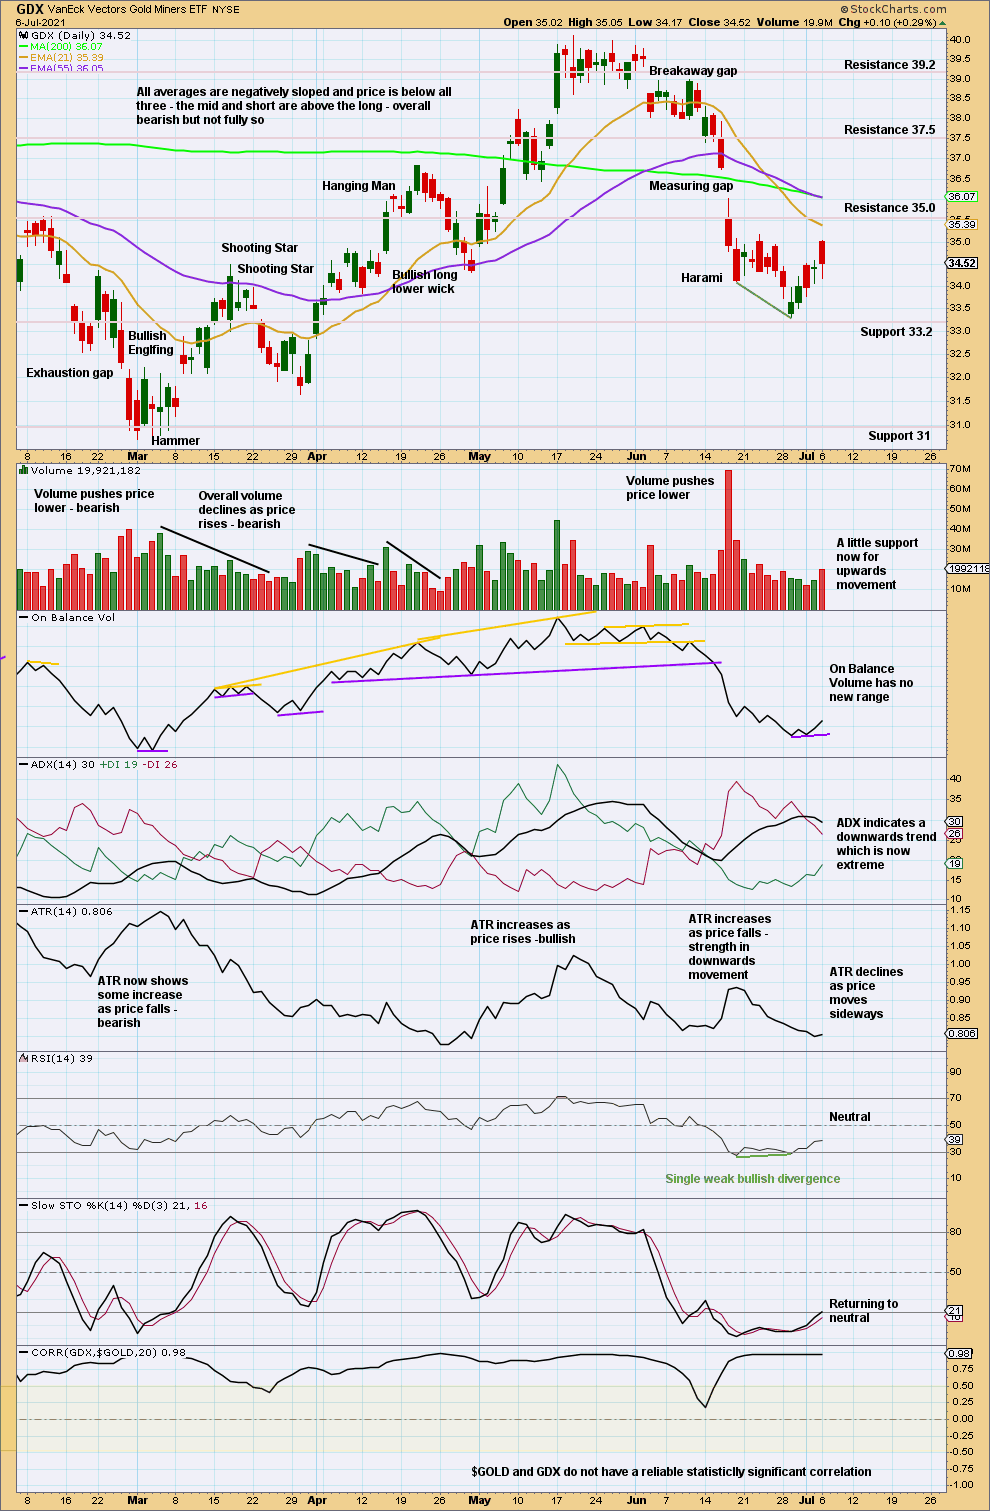
Click chart to enlarge. Chart courtesy of StockCharts.com.
After the downwards trend reached extreme and RSI reached oversold then exhibited bullish divergence, a bounce or consolidation may now continue to relieve extreme conditions. Look for price to continue higher now towards next resistance; if it reaches resistance and Stochastics reaches overbought, then an upwards swing may end there or shortly after.
US OIL
Upwards movement continues towards targets as expected.
Summary: The Elliott wave count expects upwards movement to continue to a short-term target at 76.91, with a longer term target at 87.90.
Oil may have found a major sustainable low in April 2020.
ELLIOTT WAVE COUNT
MONTHLY CHART
Click chart to enlarge.
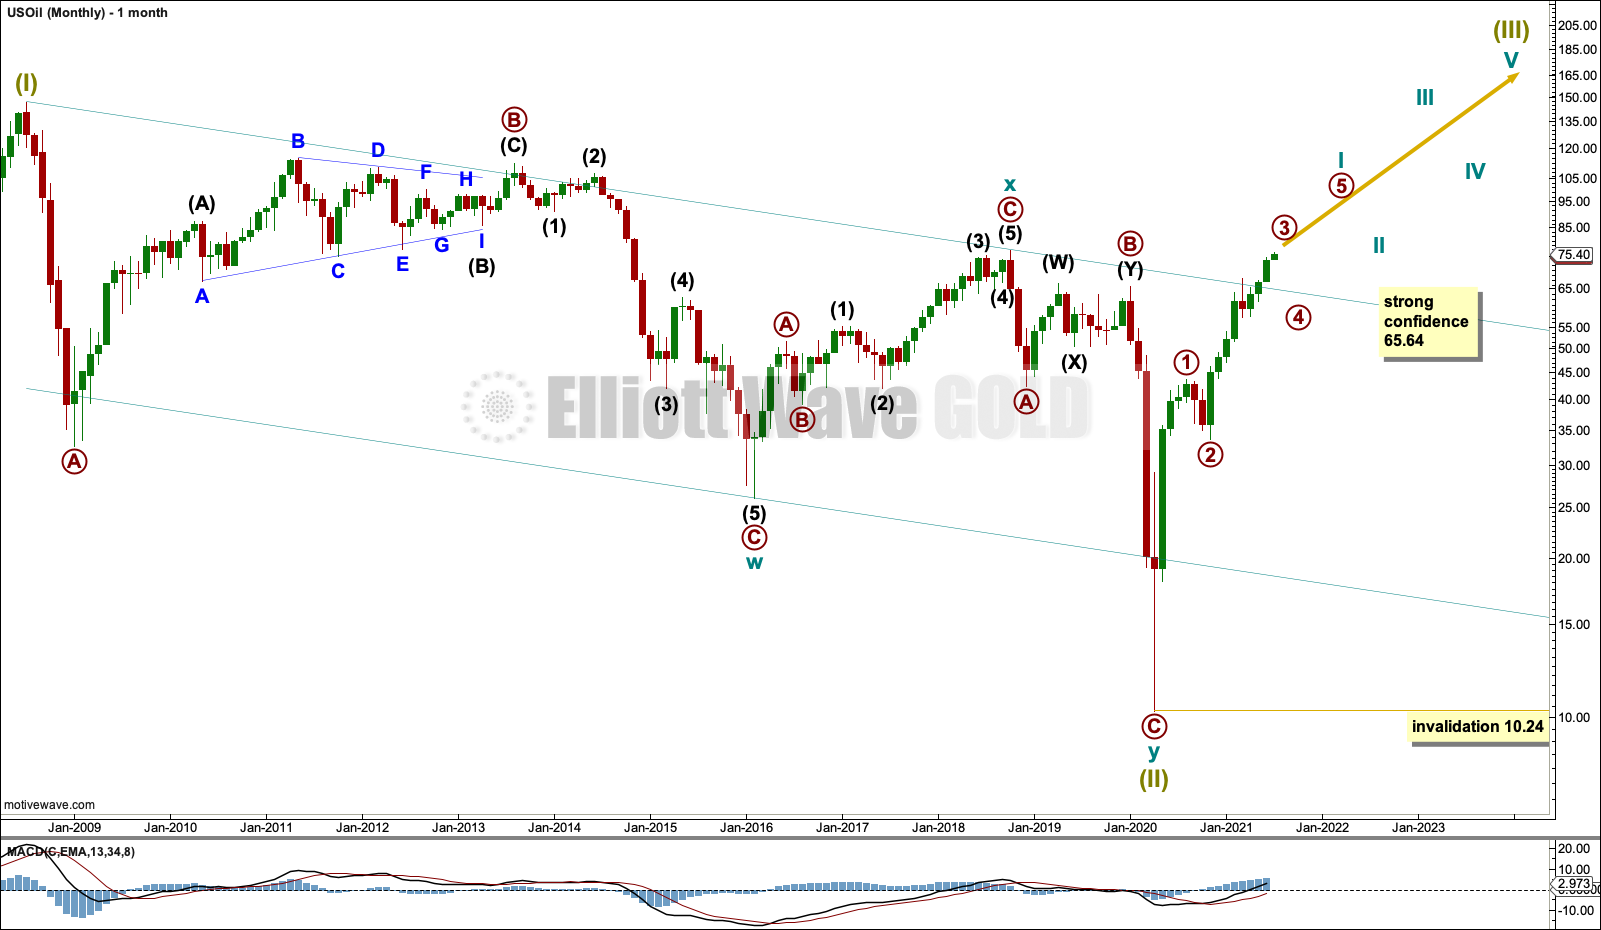
The basic Elliott wave structure is five steps forward and three steps back. This Elliott wave count expects that US Oil has completed a three steps back pattern, which began in July 2008. The Elliott wave count expects that the bear market for US Oil may now be over.
Following Super Cycle wave (II), which was a correction (three steps back), Super Cycle wave (III), which may have begun, should be five steps up when complete. Super Cycle wave (III) may last a generation and must make a new high above the end of Super Cycle wave (I) at 146.73.
A channel is drawn about Super Cycle wave (II): draw the first trend line from the start of cycle wave w to the end of cycle wave x, then place a parallel copy on the end of cycle wave w. This trend line is breached to the downside, which is a typical look for the end of a movement for a commodity.
The upper edge of the channel may provide resistance. Price is reacting down from the upper edge of this channel.
Super Cycle wave (III) may only subdivide as a five wave impulse. New trends for Oil usually start out very slowly with short first waves and deep time consuming second wave corrections. However, while this is a common tendency, it is not always seen and may not have been seen in this instance. The first reasonably sized pullback may be over already.
WEEKLY CHART
Click chart to enlarge.
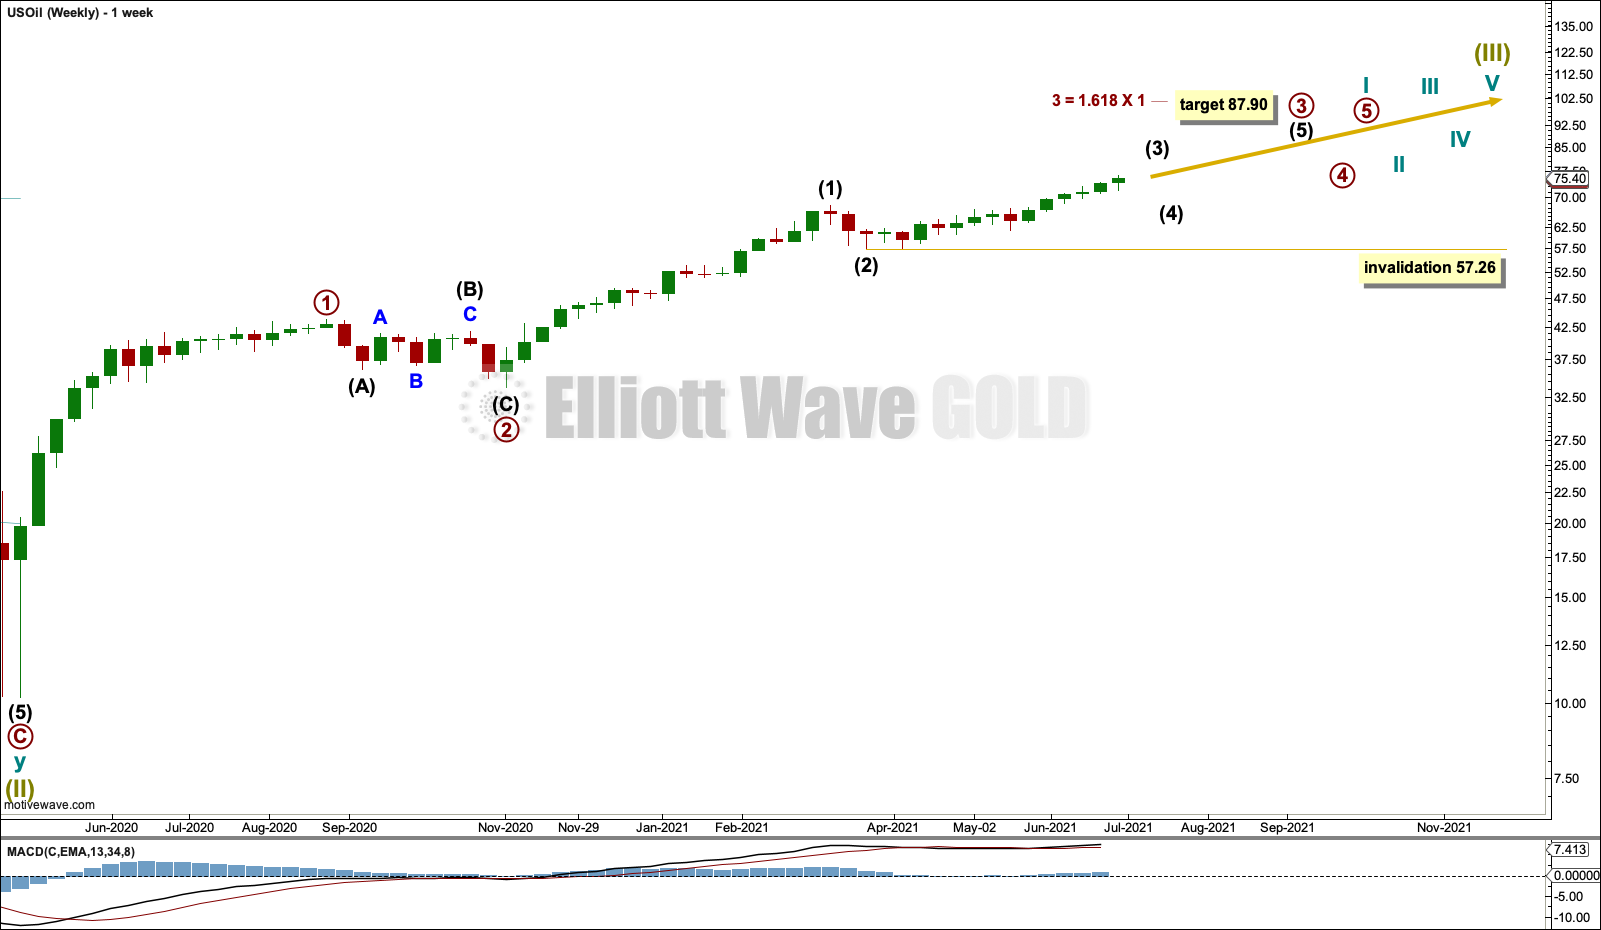
Super Cycle wave (III) must subdivide as an impulse.
Cycle wave I within Super Cycle wave (III) may be incomplete.
Within cycle wave I: Primary waves 1 and 2 may be complete, and primary wave 3, which may only subdivide as an impulse, may be underway.
Within primary wave 3: Intermediate waves (1) and (2) may be complete. No second wave correction within intermediate wave (3) may move beyond its start below 57.26.
DAILY CHART
Click chart to enlarge.
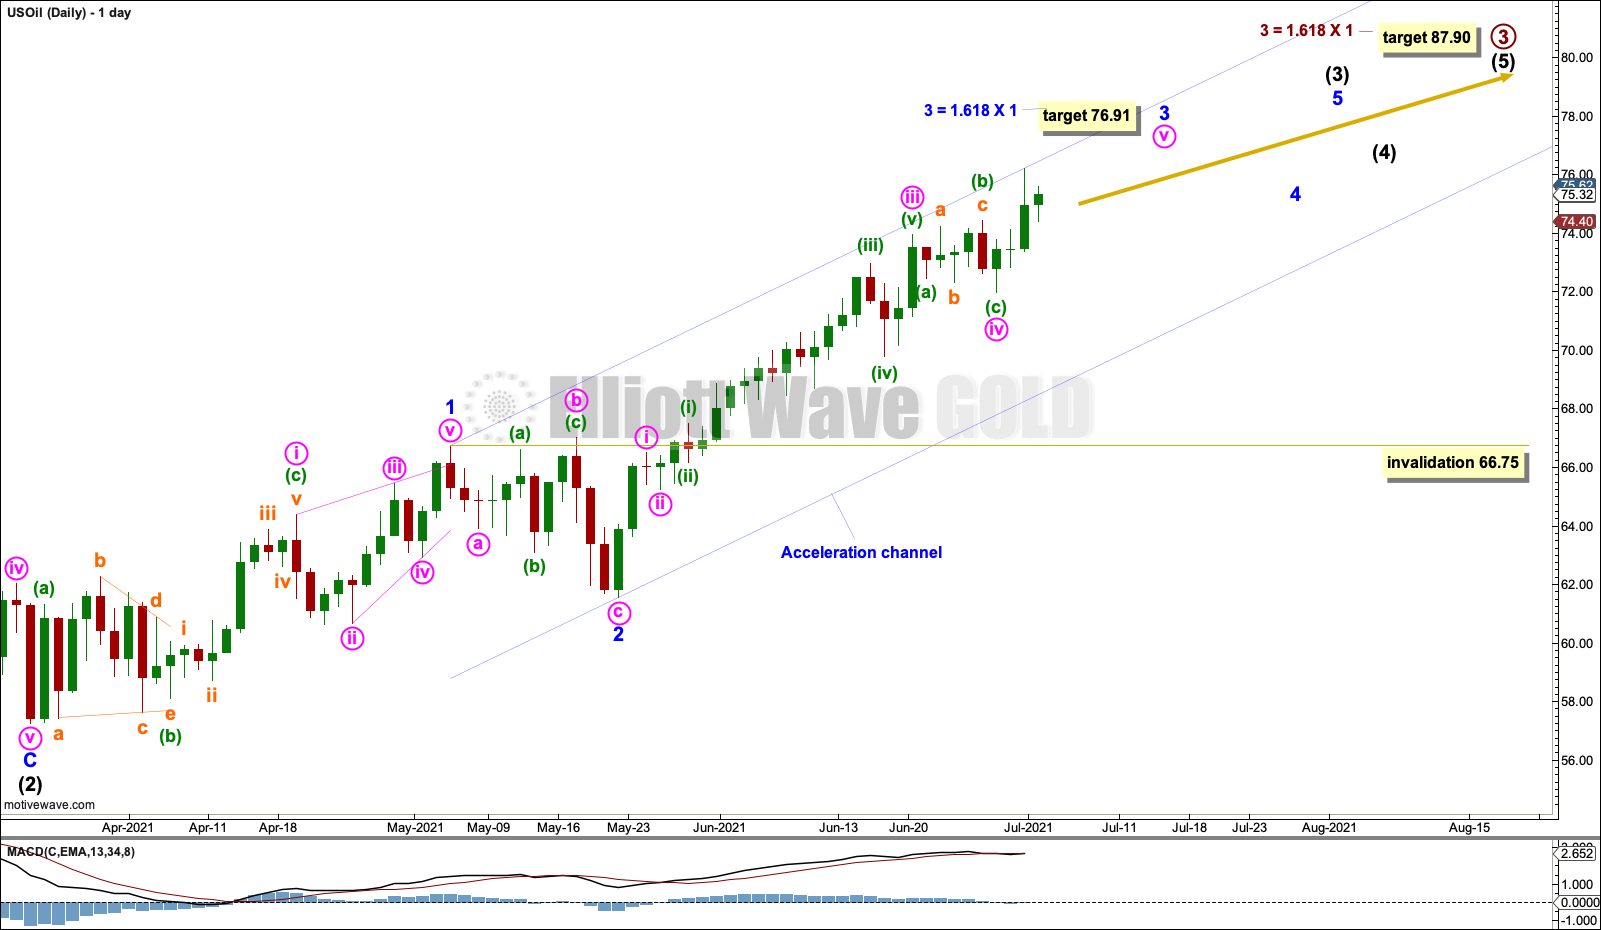
If intermediate wave (3) has begun, then minor wave 1 within it may be a complete leading contracting diagonal. Following a leading diagonal in a first wave position, the second wave correction is usually very deep. Minor wave 2 is a 0.55 depth of minor wave 1.
When a first wave subdivides as a leading diagonal, then the third wave is almost always extended. The target expects this common scenario.
A target is calculated for minor wave 3 that expects it to exhibit a common Fibonacci ratio to minor wave 1. Minor wave 4 may not move into minor wave 1 price territory below 66.75.
Draw an acceleration channel about intermediate wave (3). Draw the first trend line from the end of minor wave 1 to the last high, then place a parallel copy on the end of minor wave 2. Keep redrawing the channel as price continues higher. When minor wave 3 may be over, then this channel would be drawn using Elliott’s first technique and may show were minor wave 4 may find support.
ALTERNATE DAILY CHART
Click chart to enlarge.
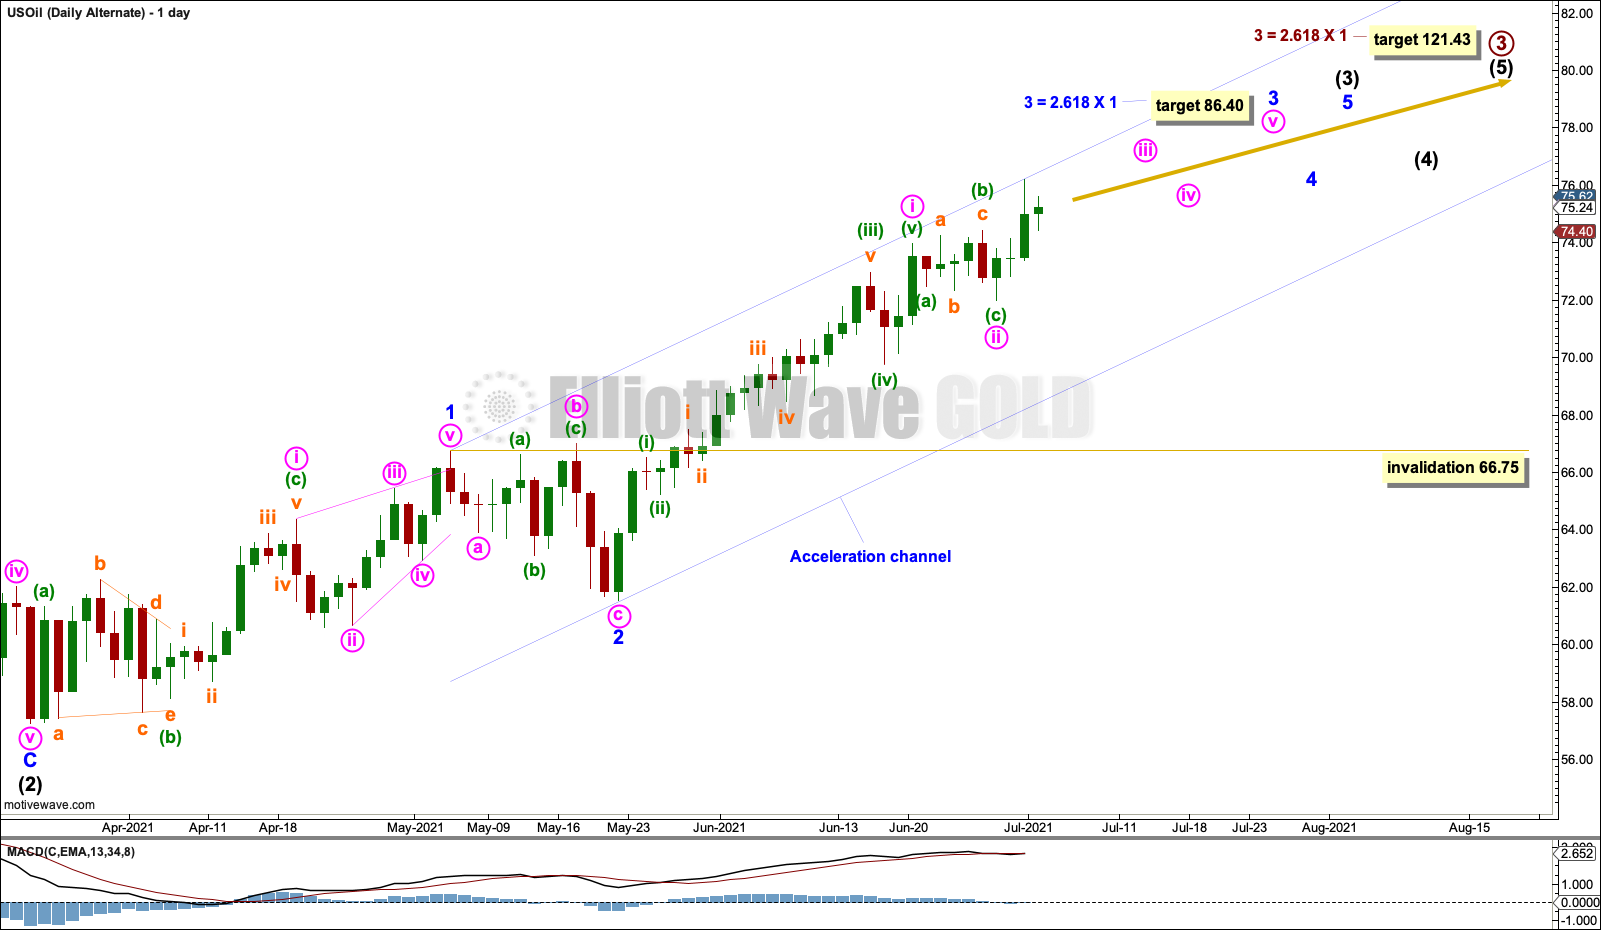
This alternate daily chart is the same as the main daily chart up to the low labelled minor wave 2,. Thereafter, it sees subdivisions within minor wave 3 differently.
Minor wave 3 may be a longer extension. Targets for this alternate use the Fibonacci ratio 2.618.
Only minute wave i within minor wave 3 may be complete.
This wave count is very bullish. It expects a third wave at minor, intermediate and primary degree may have just begun. A strong increase in upwards momentum may be expected if this wave count is correct.
Minor wave 4 may not move into minor wave 1 price territory below 66.75.
TECHNICAL ANALYSIS
WEEKLY CHART
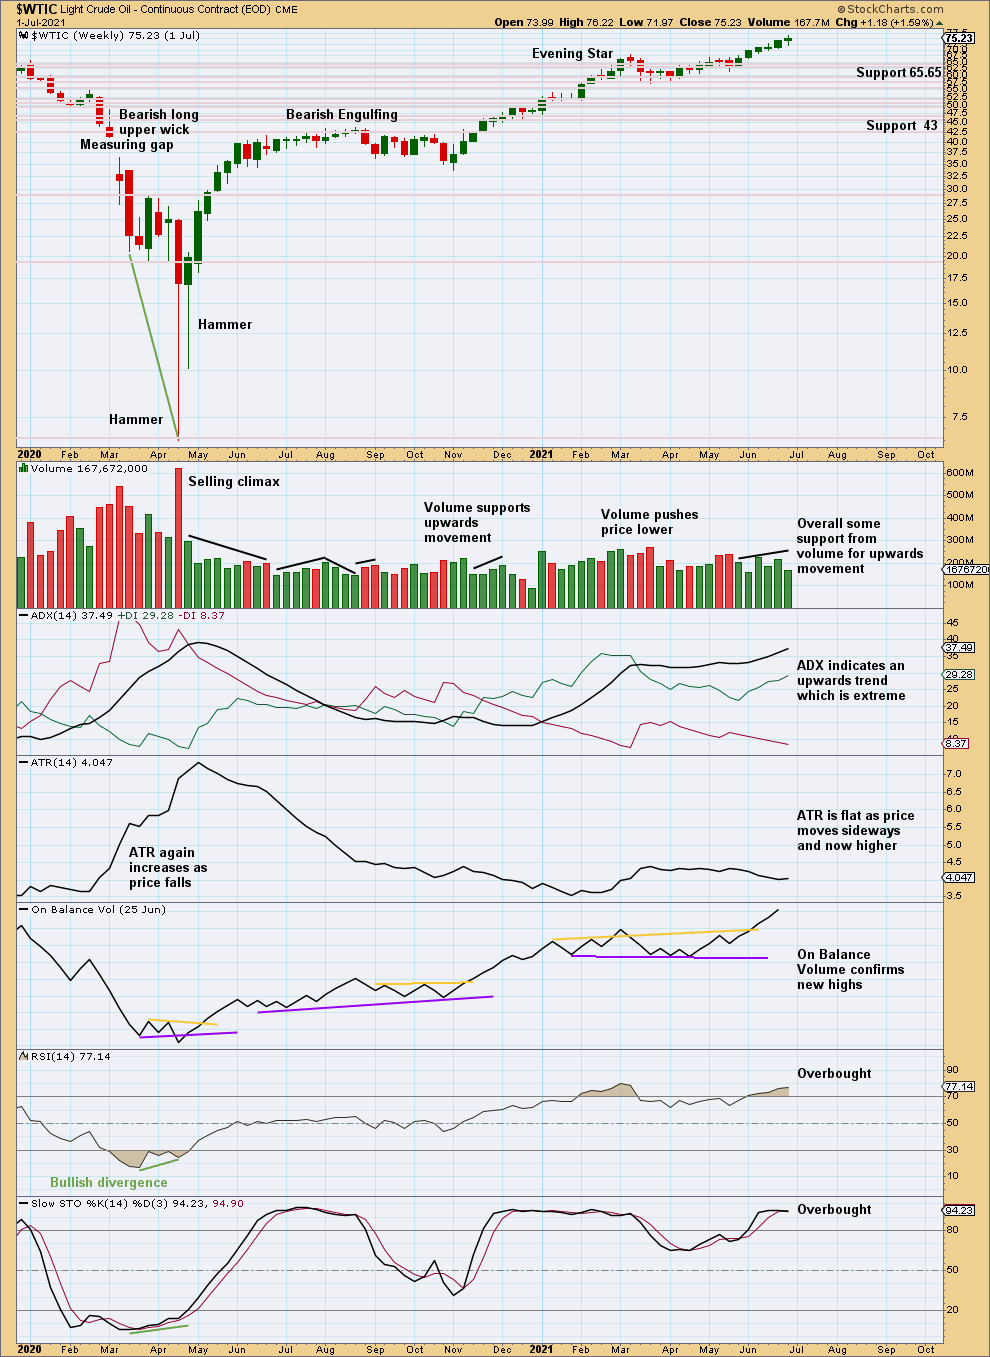
Click chart to enlarge. Chart courtesy of StockCharts.com.
This market can sustain extreme trends for a reasonable period of time. Despite weak bearish divergence between price and RSI, price continues higher. Divergence is weakening even further this week.
DAILY CHART
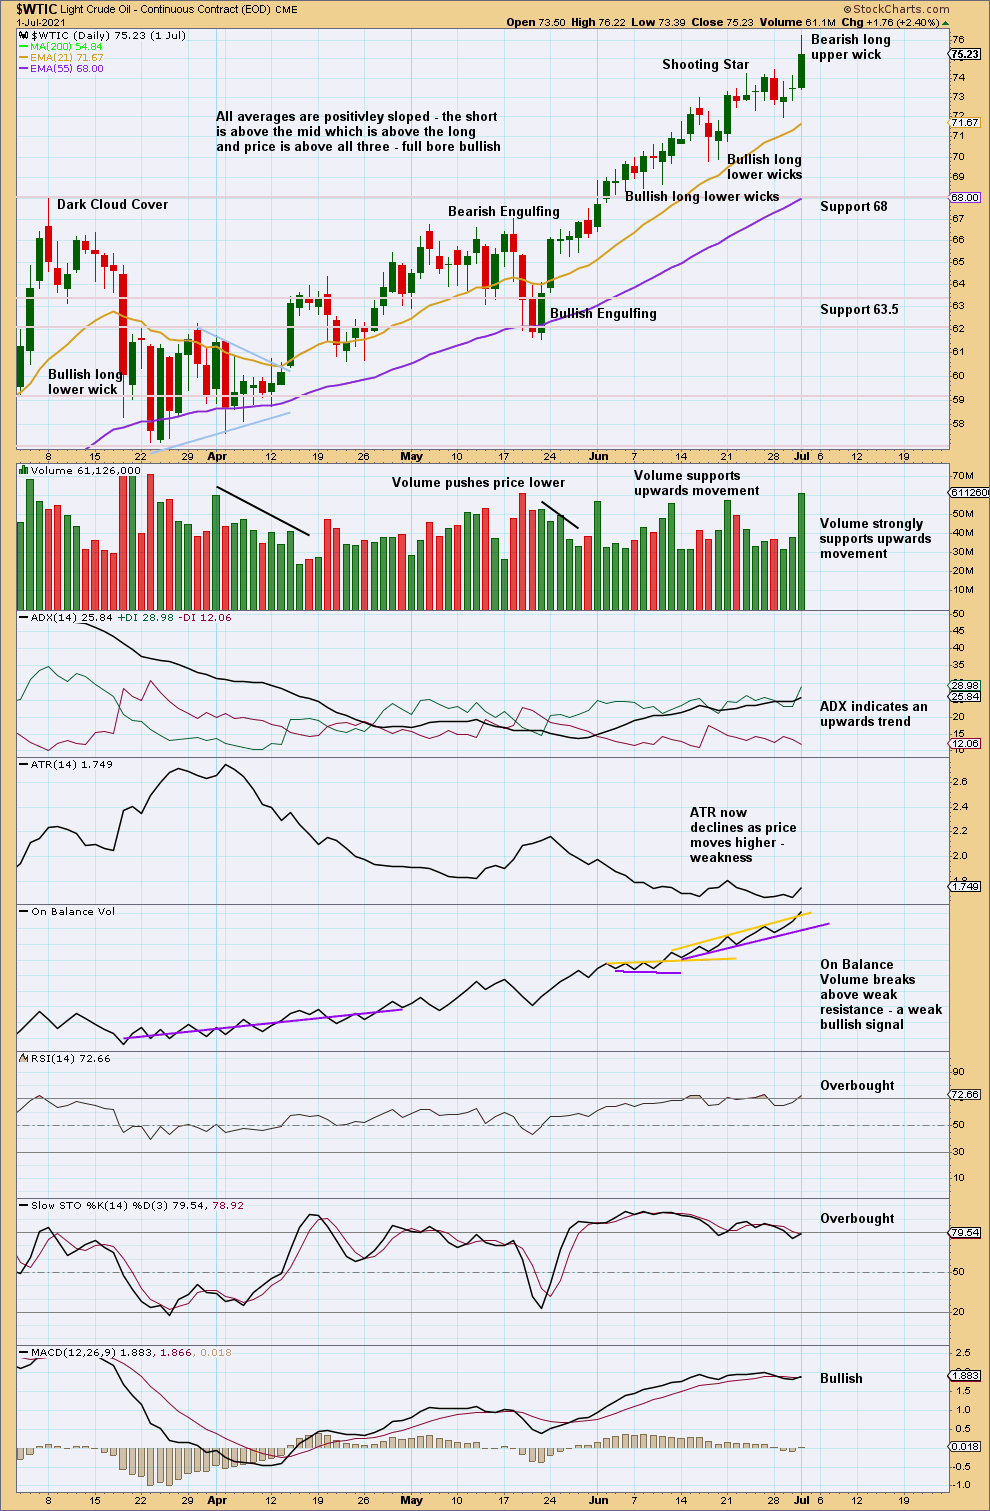
Click chart to enlarge. Chart courtesy of StockCharts.com.
There is an upwards trend that is not extreme, but RSI is again overbought; RSI can move more deeply overbought before the trend ends.
The bearish long upper wick on the last completed candlestick is bearish for the short term only. This is not a reversal pattern.
—
Always practice good risk management as the most important aspect of trading. Always trade with stops and invest only 1-5% of equity on any one trade. Failure to manage risk is the most common mistake new traders make.
—