
Lara’s Weekly: Elliott Wave and Technical Analysis of S&P500 and Gold and US Oil | Charts – July 16, 2021

S&P 500
Three short-term scenarios were given yesterday. The first was invalidated with a new low below 4,340.70, indicating the second scenario should be followed, which expected downwards movement to find support about 4,329.22. The low for Friday was slightly below this at 4,322.53.
Summary: There is now a cluster of bearish signals from the AD line and short-term weak bearish divergence between price and RSI. Three Elliott wave counts are considered in order of probability:
1 – A minor degree fourth wave may continue lower and / or sideways for another three to six weeks. Support may be found about 4,235.
2 – An intermediate degree fourth wave may continue lower for about four to eight weeks. Support may be found about 3,941.
3 – A bear market may begin with little warning. It may last about two to a few months and may find support about 3,033, but it may end below this point. Final invalidation is at 2,191.86.
Reasons for decisions on probability are explained carefully in the analysis below.
The biggest picture, Grand Super Cycle analysis, is here.
Last monthly charts are here. Video is here.
MAIN ELLIOTT WAVE COUNT
WEEKLY CHART
Click chart to enlarge.
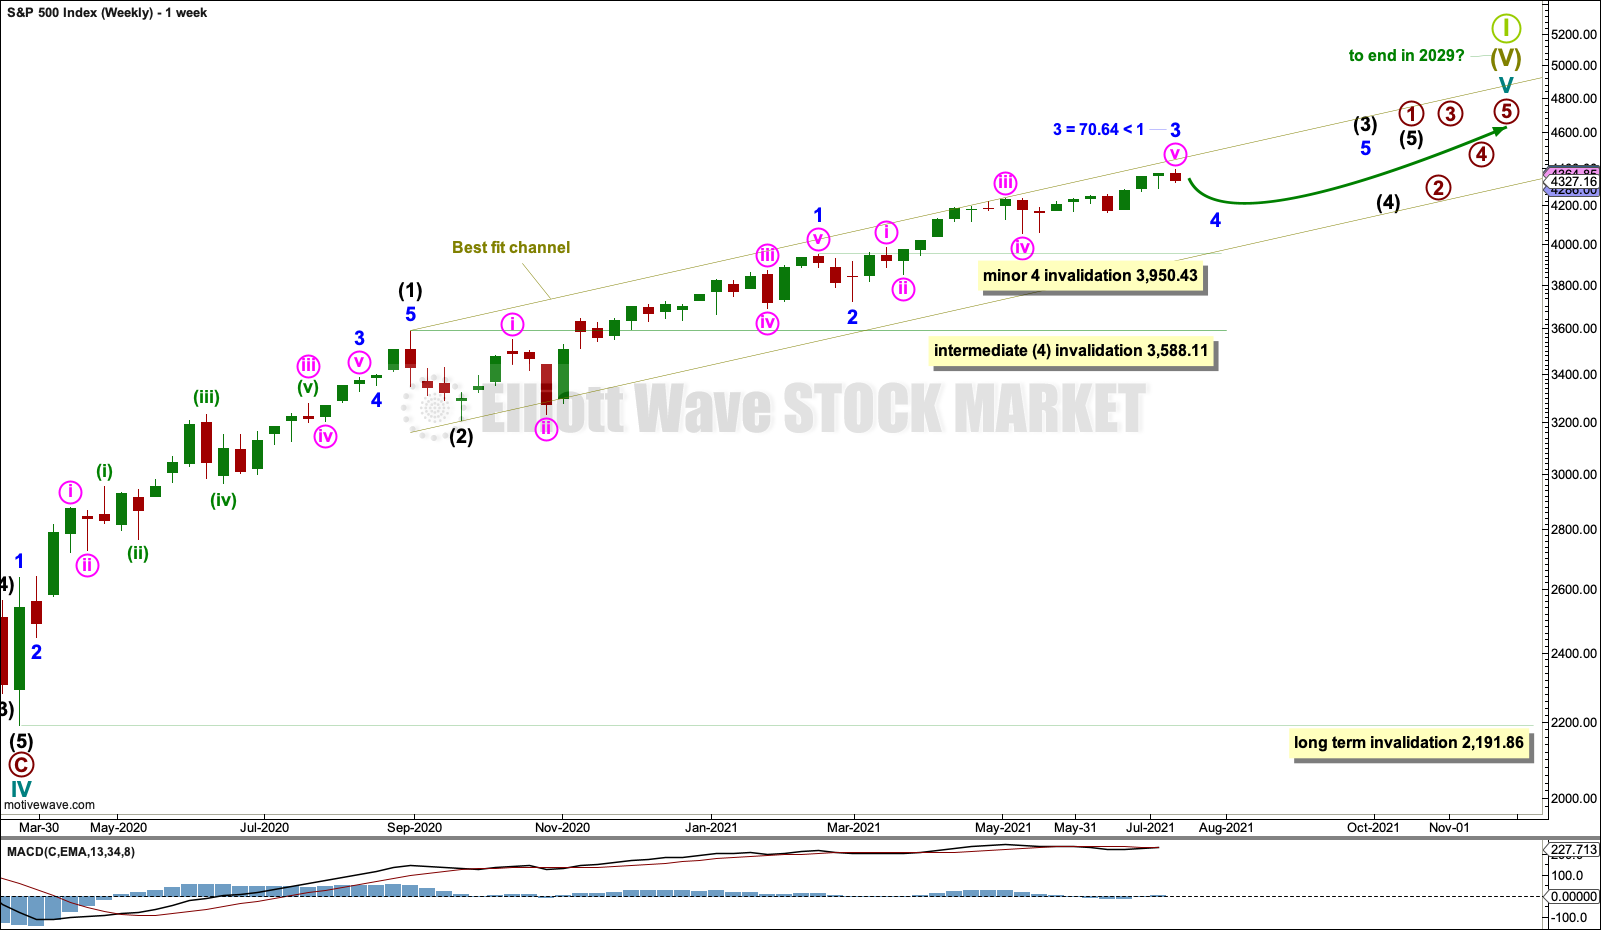
Cycle wave V may last from one to several years. So far it is in its sixteenth month.
This wave count may allow time for the AD line to diverge from price as price makes final highs before the end of the bull market. The AD line most commonly diverges a minimum of 4 months prior to the end of a bull market. A longer divergence is positively correlated with a deeper bear market. A shorter divergence is positively correlated with a more shallow bear market. There is zero divergence at this stage.
A longer divergence between price and the AD line would be expected towards the end of Grand Super Cycle wave I.
It is possible that cycle wave V may continue until 2029, if the 2020s mirror the 1920s. Either March or October 2029 may be likely months for the bull market to end.
Cycle wave V would most likely subdivide as an impulse. But if overlapping develops, then an ending diagonal should be considered. This chart considers the more common impulse.
There is already a Fibonacci ratio between cycle waves I and III within Super Cycle wave (V). The S&P500 often exhibits a Fibonacci ratio between two of its actionary waves but rarely between all three; it is less likely that cycle wave V would exhibit a Fibonacci ratio. The target for Super Cycle wave (V) to end would best be calculated at primary degree, but that cannot be done until all of primary waves 1, 2, 3 and 4 are complete.
Primary wave 1 within cycle wave V may be incomplete. This gives a very bullish wave count, expecting a long duration for cycle wave V which has not yet passed its middle strongest portion.
Within primary wave 1: Intermediate waves (1) and (2) may be complete, and intermediate wave (3) may now be approaching an end.
Intermediate wave (4) may not move into intermediate wave (1) price territory below 3,588.11.
Within intermediate wave (3), minor waves 1, 2 and 3 may be complete. Minor wave 3 may be shorter than minor wave 1 by 70.64 points. This limits minor wave 5 to no longer than equality in length with minor wave 3. Minor wave 4 may have just begun; it may not move into minor wave 1 price territory below 3,950.43.
A best fit channel is drawn about cycle wave V. Draw the first trend line from the end of intermediate wave (1) to the end of minute wave iii within minor wave 3, then place a parallel copy on the end of intermediate wave (2). The channel may need to be redrawn as price continues higher. The channel may show where price may find resistance and support along the way up.
DAILY CHART
Click chart to enlarge.
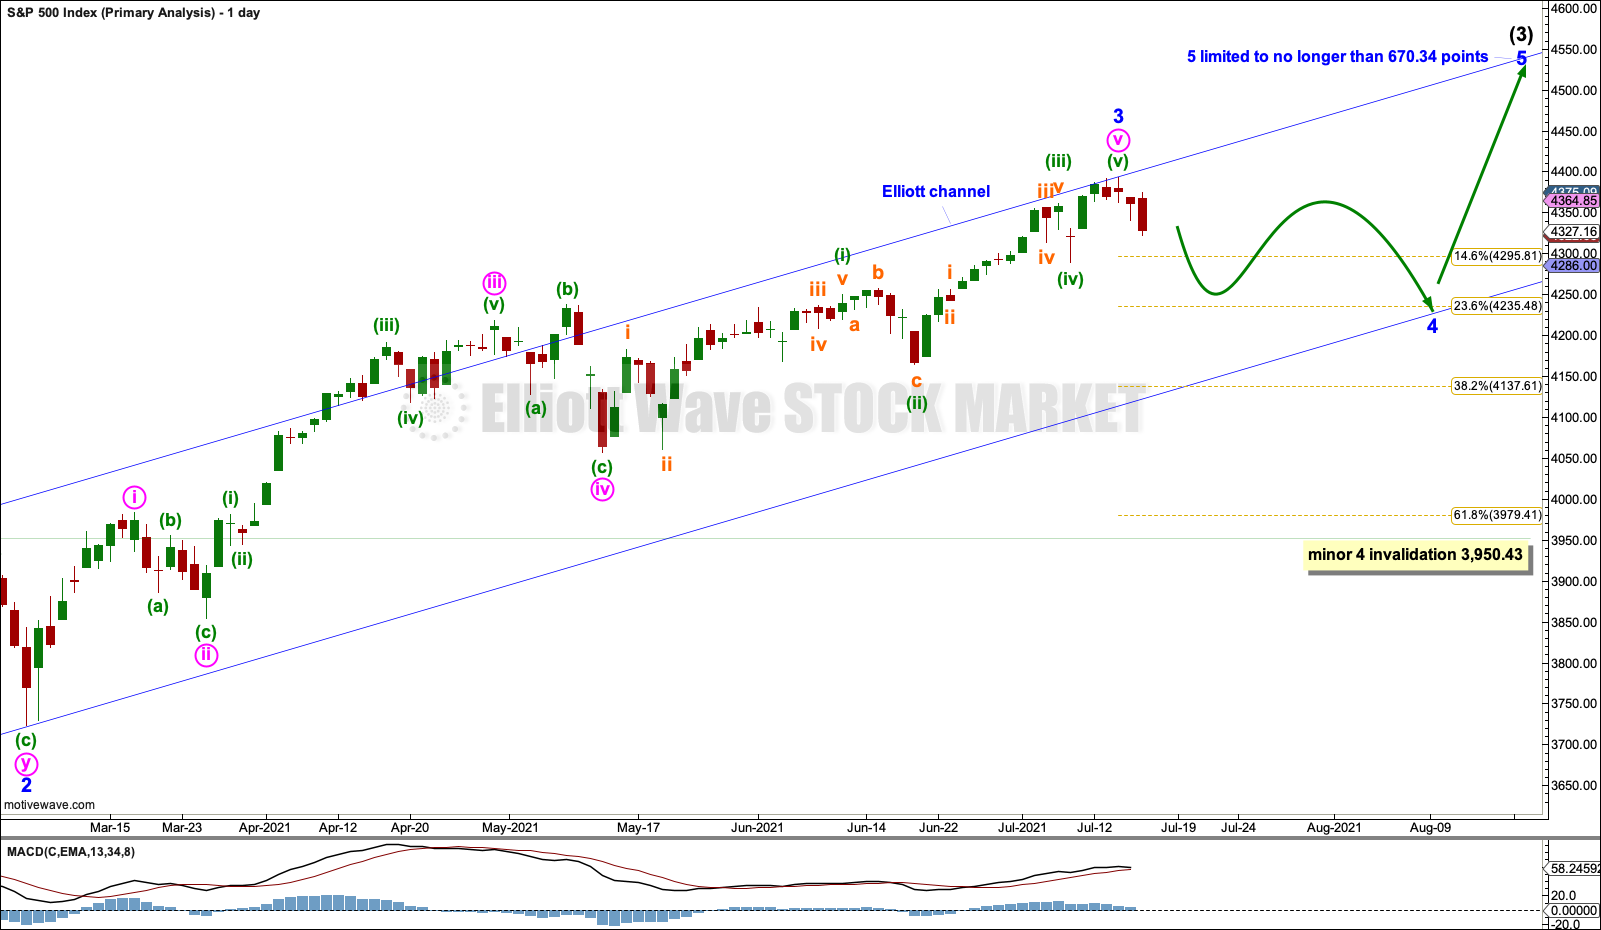
A cluster of bearish signals from the AD line suggests more downwards movement ahead. This may be minor wave 4.
Minor wave 2 subdivided as a double zigzag and lasted 12 sessions. Minor wave 4 may last about 3 to 6 weeks and may most likely subdivide as a flat, triangle or combination, which are often longer lasting than zigzags. Flats, triangles or combinations are choppy sideways movements with swings from resistance to support and back again. Price does not move in a straight line during these swings, so it will not be possible to know which of several Elliott wave structures minor wave 4 has subdivided as until it may be over.
Draw an Elliott channel. Draw the first trend line from the ends of minor waves 1 to 3, then place a parallel copy on the end of minor wave 2. Minor wave 4 may find support about the lower edge of this channel; it may end about support at the 0.236 Fibonacci ratio at 4,235.48.
Minor wave 4 may not move into minor wave 1 price territory below 3,950.43.
ALTERNATE WEEKLY CHART
Click chart to enlarge.
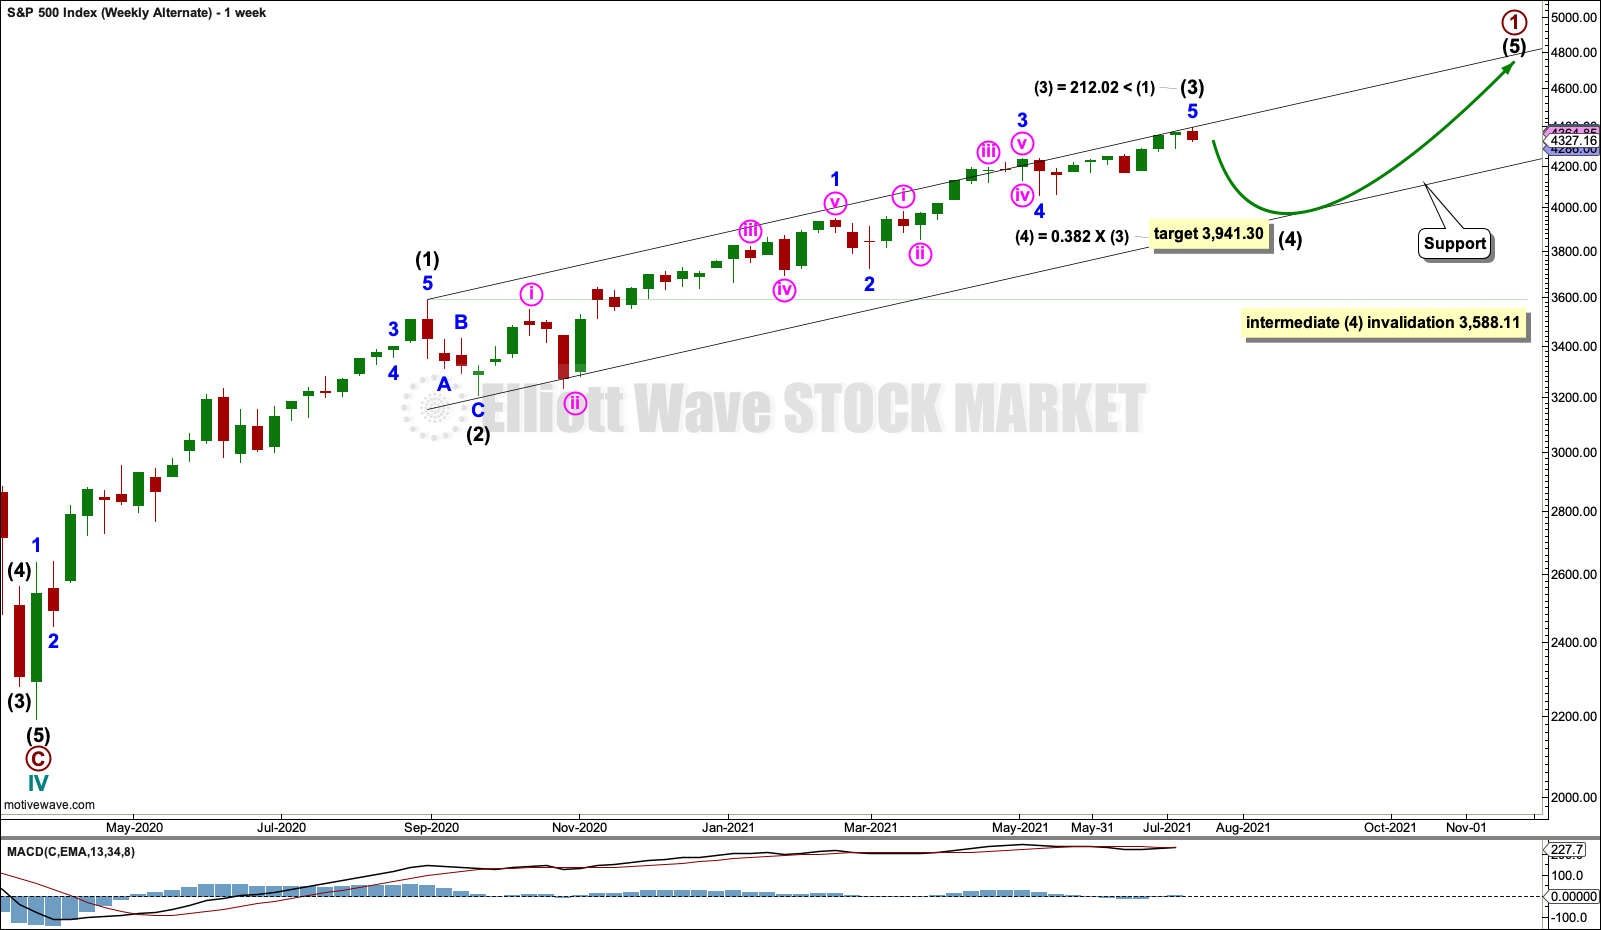
Considering the now well developed cluster of bearish signals from the AD line, it is time to consider a deeper or longer lasting correction may have arrived.
If intermediate wave (3) is over at the last high, then it would be shorter than intermediate wave (1) by 212.02 points. This market has a strong tendency for its third waves to extend, so this alternate must be judged to have a low probability for this reason.
At the last all time high, there was only 7 days of bearish divergence between price and the AD line, suggesting any pullbacks or consolidations developing here may more likely be short term in nature. But this does not support this alternate wave count (nor does it support the very bearish second alternate wave count below).
Intermediate wave (2) lasted 3 weeks, subdivided as a single zigzag, and was a shallow 0.27 correction of intermediate wave (1). Intermediate wave (4) may last 4 or more weeks and may be a slightly deeper sideways consolidation. Intermediate wave (4) may most likely subdivide as a flat, triangle or combination.
Intermediate wave (4) may not move into intermediate wave (1) price territory below 3,588.11.
SECOND ALTERNATE WEEKLY CHART
Click chart to enlarge.
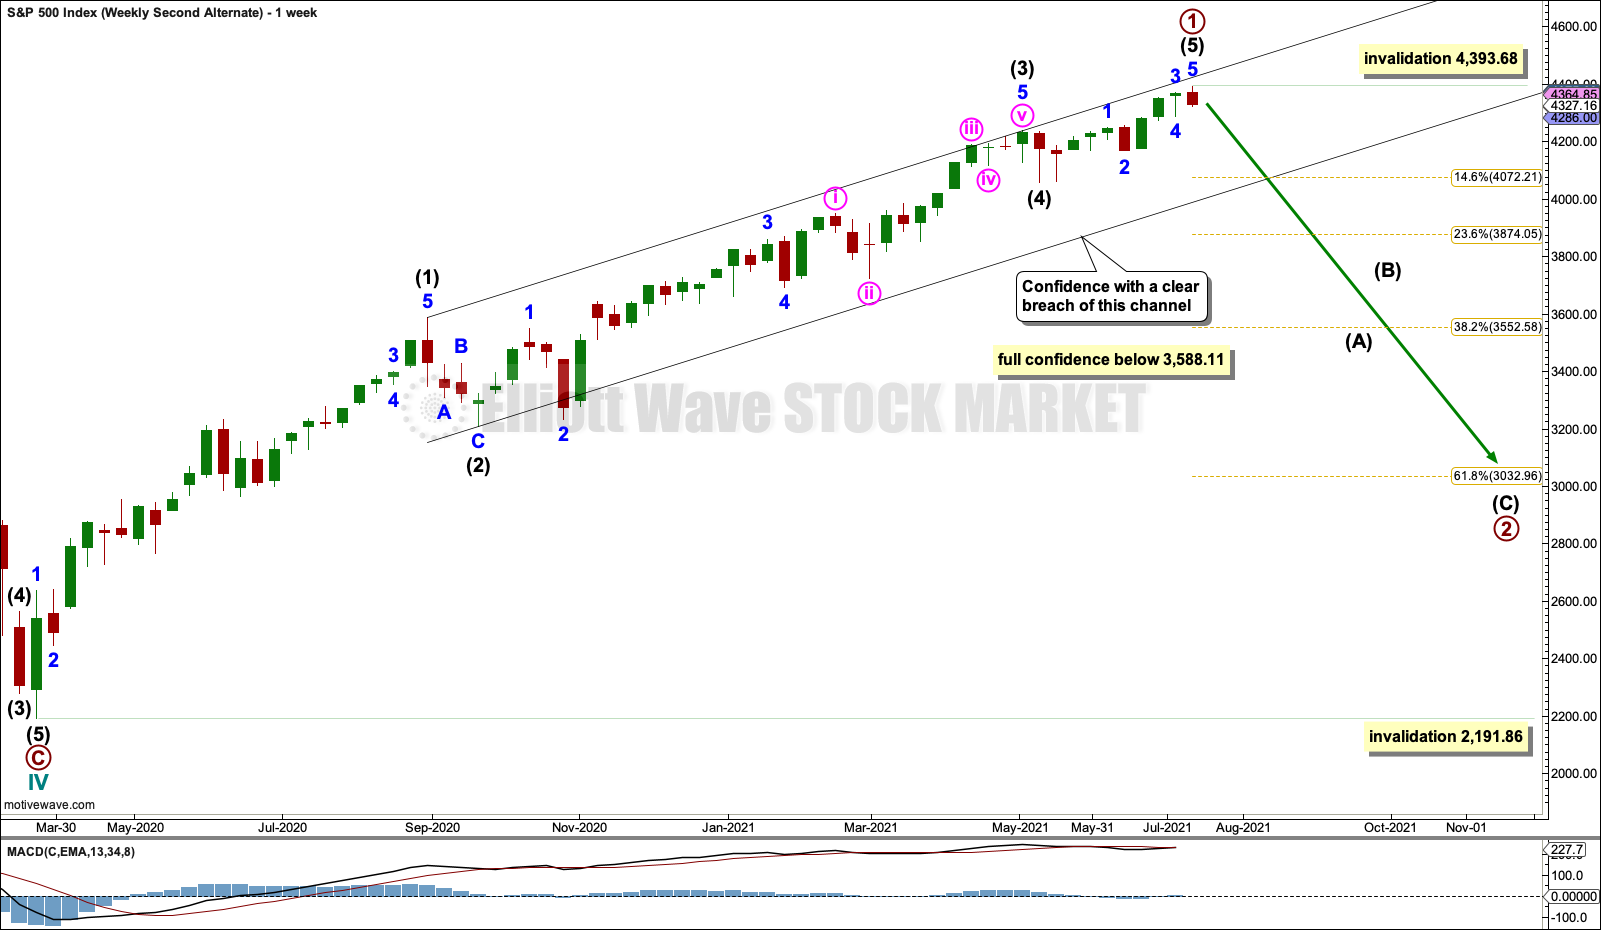
In just under 100 years there have been only three bear markets that occurred after there was no bearish divergence between price and the AD line: in 1946, 1976 and the last bear market of February to March 2020. It is possible that in current market conditions another bear market may begin here, with little warning. If it does it, then should be labelled primary wave 2.
If the trend channel about primary wave 1 is breached at the daily chart level with a full daily candlestick of downwards movement (not sideways), then this bearish alternate wave count may be considered. A preferred target for primary wave 2 would be the 0.618 Fibonacci ratio of primary wave 1 at 3,032.96, but it may be deeper than this. Primary wave 2 may last about two months, or it may possibly be longer lasting. Within primary wave 2, there should be a dead cat bounce for intermediate wave (B).
Primary wave 2 may not move beyond the start of primary wave 1 below 2,191.86.
TECHNICAL ANALYSIS
WEEKLY CHART
Click chart to enlarge. Chart courtesy of StockCharts.com.
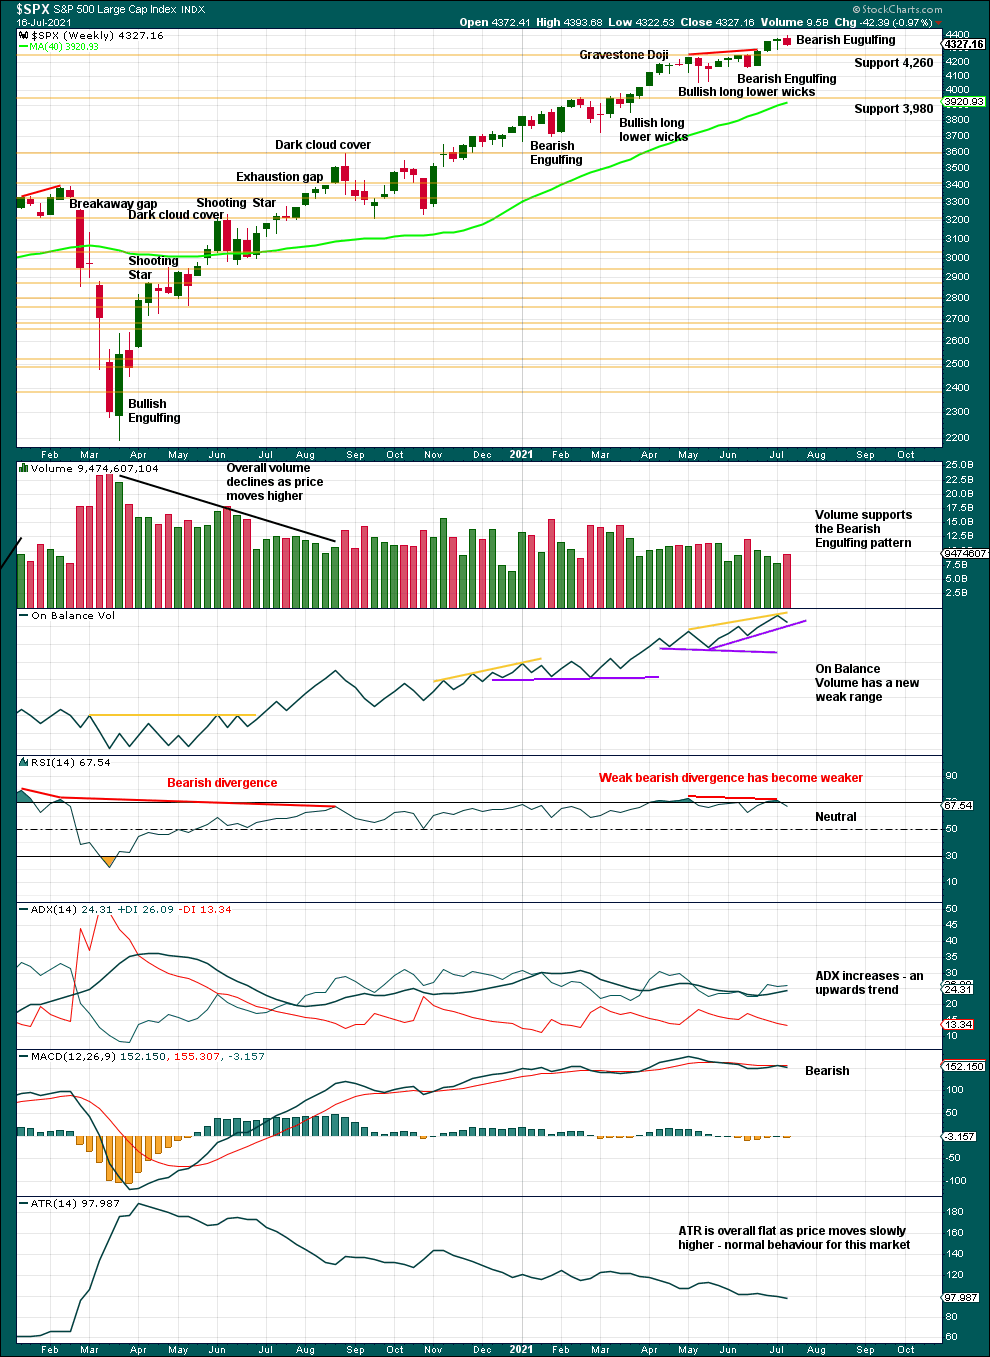
Another Bearish Engulfing candlestick pattern has support from volume. There are two prior examples of Bearish Engulfing patterns on this chart that were not followed by any further downwards movement.
There is short-term bearish divergence between price and RSI, but it is weak. This suggests a pullback or consolidation here may more likely be shallow and short term in nature. This supports the main Elliott wave count.
DAILY CHART
Click chart to enlarge. Chart courtesy of StockCharts.com.
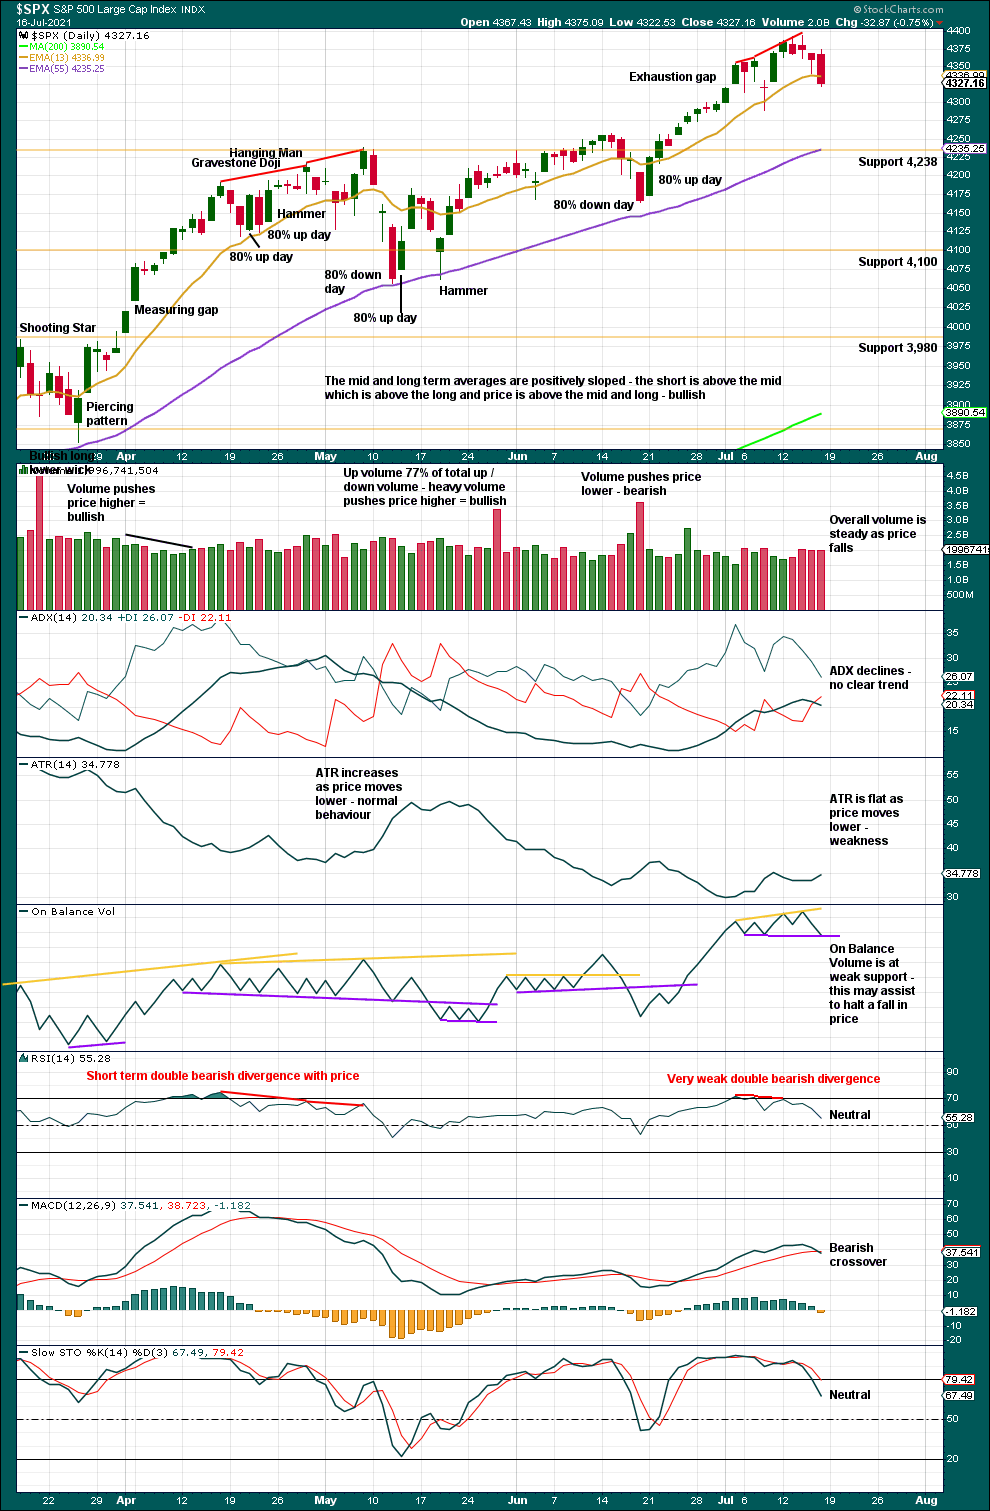
ADX again indicates no clear trend.
Double bearish divergence between price and RSI is very weak and short term. Weaker divergence, which is short term, suggests a more shallow and short-term pullback or consolidation. This supports the main Elliott wave count.
BREADTH – AD LINE
WEEKLY CHART
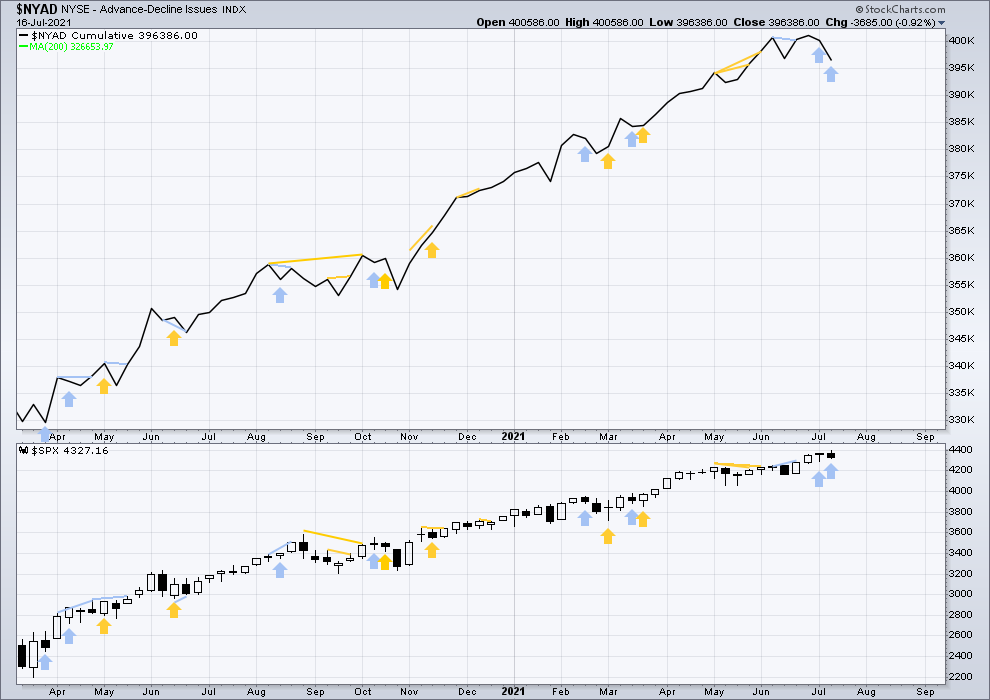
Click chart to enlarge. Chart courtesy of StockCharts.com. So that colour blind members are included, bearish signals will be noted with blue and bullish signals with yellow.
Breadth should be read as a leading indicator.
Lowry’s Operating Companies Only AD line has made a new all time high on the 8th of June. There is now over one and a half months of bearish divergence between the OCO AD line and price. This supports the first alternate Elliott wave count but not necessarily the second alternate Elliott wave count.
Large caps all time high: 4,393.68 on Jul 14, 2021.
Mid caps all time high: 2,780.08 on May 10, 2021.
Small caps all time high: 1,417.45 on June 8, 2021.
With just over 2 months of weakness in small and mid caps, some pullback or consolidation may result sooner. The Elliott wave count and supporting technical analysis suggest it may have begun.
This week price has moved higher, but the AD line has moved lower. At this week’s new all time high for price, there is now just two weeks of short-term bearish divergence.
DAILY CHART
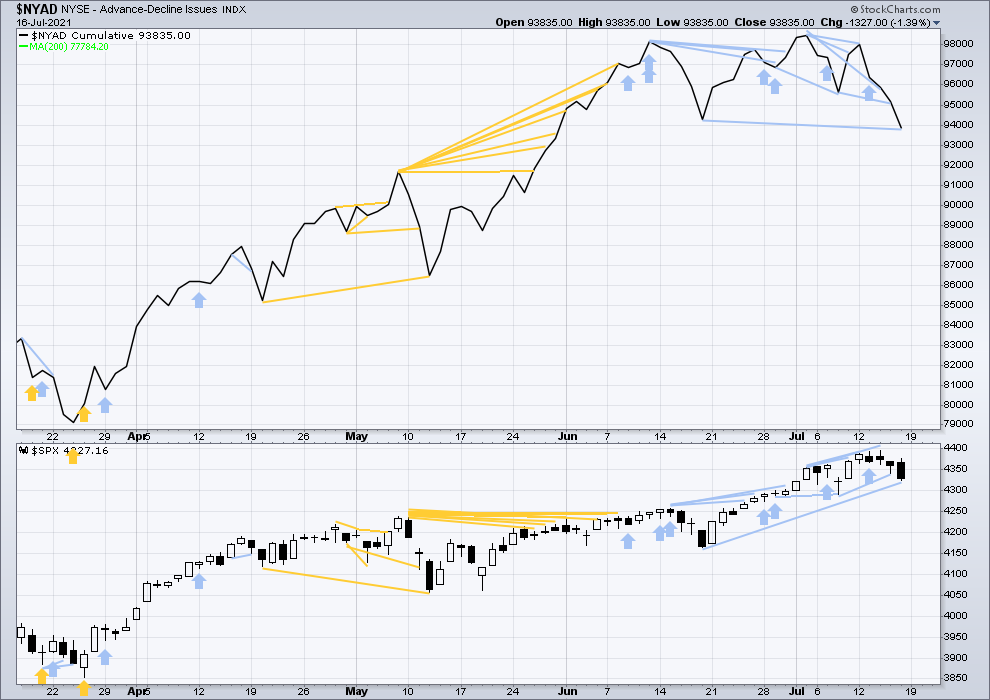
Click chart to enlarge. Chart courtesy of StockCharts.com. So that colour blind members are included, bearish signals will be noted with blue and bullish signals with yellow.
Today both price and the AD line have moved lower. The AD line has made a new low below the prior swing low of the 18th of June, but price has not. This divergence is bearish and supports either the main or first alternate Elliott wave count.
The last all time high for the AD line occurred just seven days ago. With only one week of bearish divergence, probability favours a short-term pullback or consolidation and not a fully fledged bear market. This suggests the main Elliott wave count may be preferred.
VOLATILITY – INVERTED VIX CHART
WEEKLY CHART
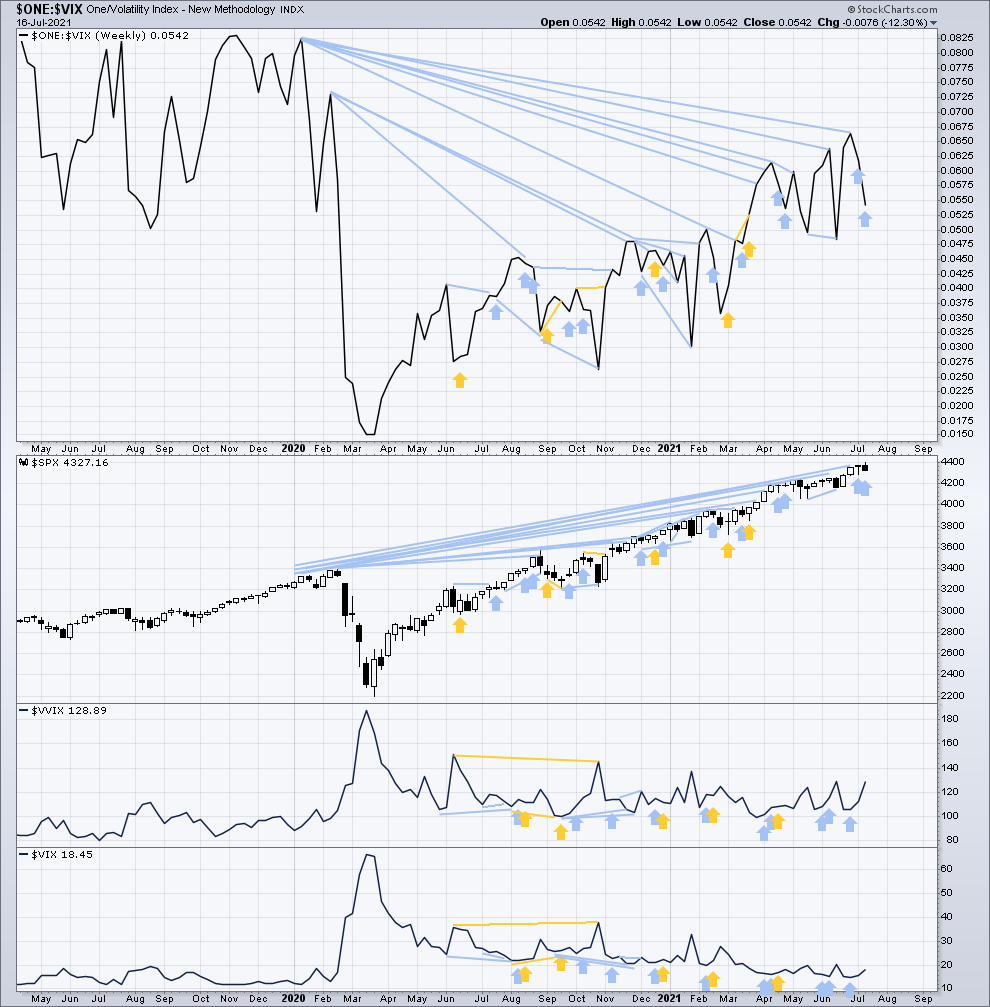
Click chart to enlarge. Chart courtesy of StockCharts.com. So that colour blind members are included, bearish signals will be noted with blue and bullish signals with yellow.
Inverted VIX remains well below all time highs. The all time high for inverted VIX was in the week beginning October 30, 2017. There is over 3 years of bearish divergence between price and inverted VIX. This bearish divergence may develop further before the bull market ends. It may be a very early indicator of an upcoming bear market, but it is not proving to be useful in timing. It may support the second alternate Elliott wave count.
Price for the second week in a row has moved higher, but inverted VIX has moved lower. Long-term and mid-term bearish divergence remains.
Comparing VIX and VVIX at the weekly chart level:
This week both VIX and VVIX have moved higher. There is no new short-term divergence.
DAILY CHART
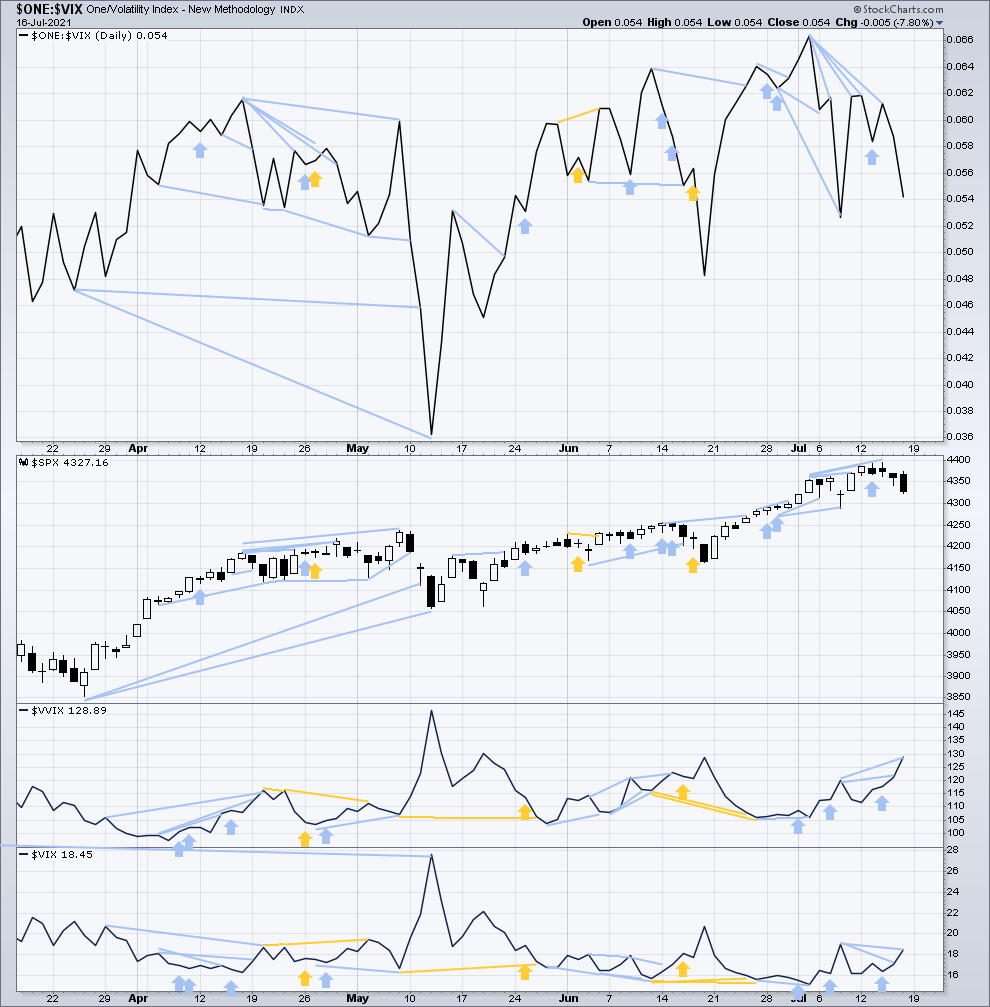
Click chart to enlarge. Chart courtesy of StockCharts.com. So that colour blind members are included, bearish signals will be noted with blue and bullish signals with yellow.
Both price and inverted VIX have moved lower. Neither have made new short-term swing lows. This supports the main Elliott wave count.
A cluster of short-term bearish divergence remains and supports the main Elliott wave count.
Comparing VIX and VVIX at the daily chart level:
Both VIX and VVIX have moved higher today. VVIX has made another new short-term high above the prior swing high of the 8th of July, but VIX has not. Volatility of VIX is elevated. This supports the main Elliott wave count.
On 2nd July VIX made a new short-term low below the 25th of June, but VVIX did not. This divergence is bearish for price for the short term, but it is reasonably weak.
DOW THEORY
Dow Theory confirms a new bull market with new highs made on a closing basis:
DJIA: 29,568.57 – closed above on 16th November 2020.
DJT: 11,623.58 – closed above on 7th October 2020.
Most recently, on 10th May 2021 both DJIA and DJT have made new all time highs. An ongoing bull market is again confirmed by Dow Theory.
Adding in the S&P and Nasdaq for an extended Dow Theory, confirmation of a bull market would require new highs made on a closing basis:
S&P500: 3,393.52 – closed above on 21st August 2020.
Nasdaq: 9,838.37 – closed above on June 8, 2020.
The following major swing lows would need to be seen on a closing basis for Dow Theory to confirm a change from bull to a bear market:
DJIA: 18,213.65
DJT: 6,481.20
Adding in the S&P and Nasdaq for an extended Dow Theory, confirmation of a new bear market would require new lows on a closing basis:
S&P500: 2,191.86
Nasdaq: 6,631.42
GOLD
Downwards movement breached the short-term Elliott wave invalidation point, indicating the bounce may be over.
The Elliott wave channel may now be used for confidence in the Elliott wave count.
Summary: The bounce may be over. The main wave count now has a target for a downwards wave at 1,732 and an invalidation point at 1,677.64. The alternate wave count now has a target for a primary degree third wave down at 1,569 and a confidence point at 1,677.64.
Confidence in these targets may only be had once the upwards sloping channel on the daily charts is breached by at least one full daily candlestick below and not touching the lower trend line. While price remains within the channel, there is risk this bounce may not be over; if the bounce continues, then a target may be at 1,853.
Grand SuperCycle analysis and last monthly charts are here.
MAIN ELLIOTT WAVE COUNT
WEEKLY CHART
Click chart to enlarge.
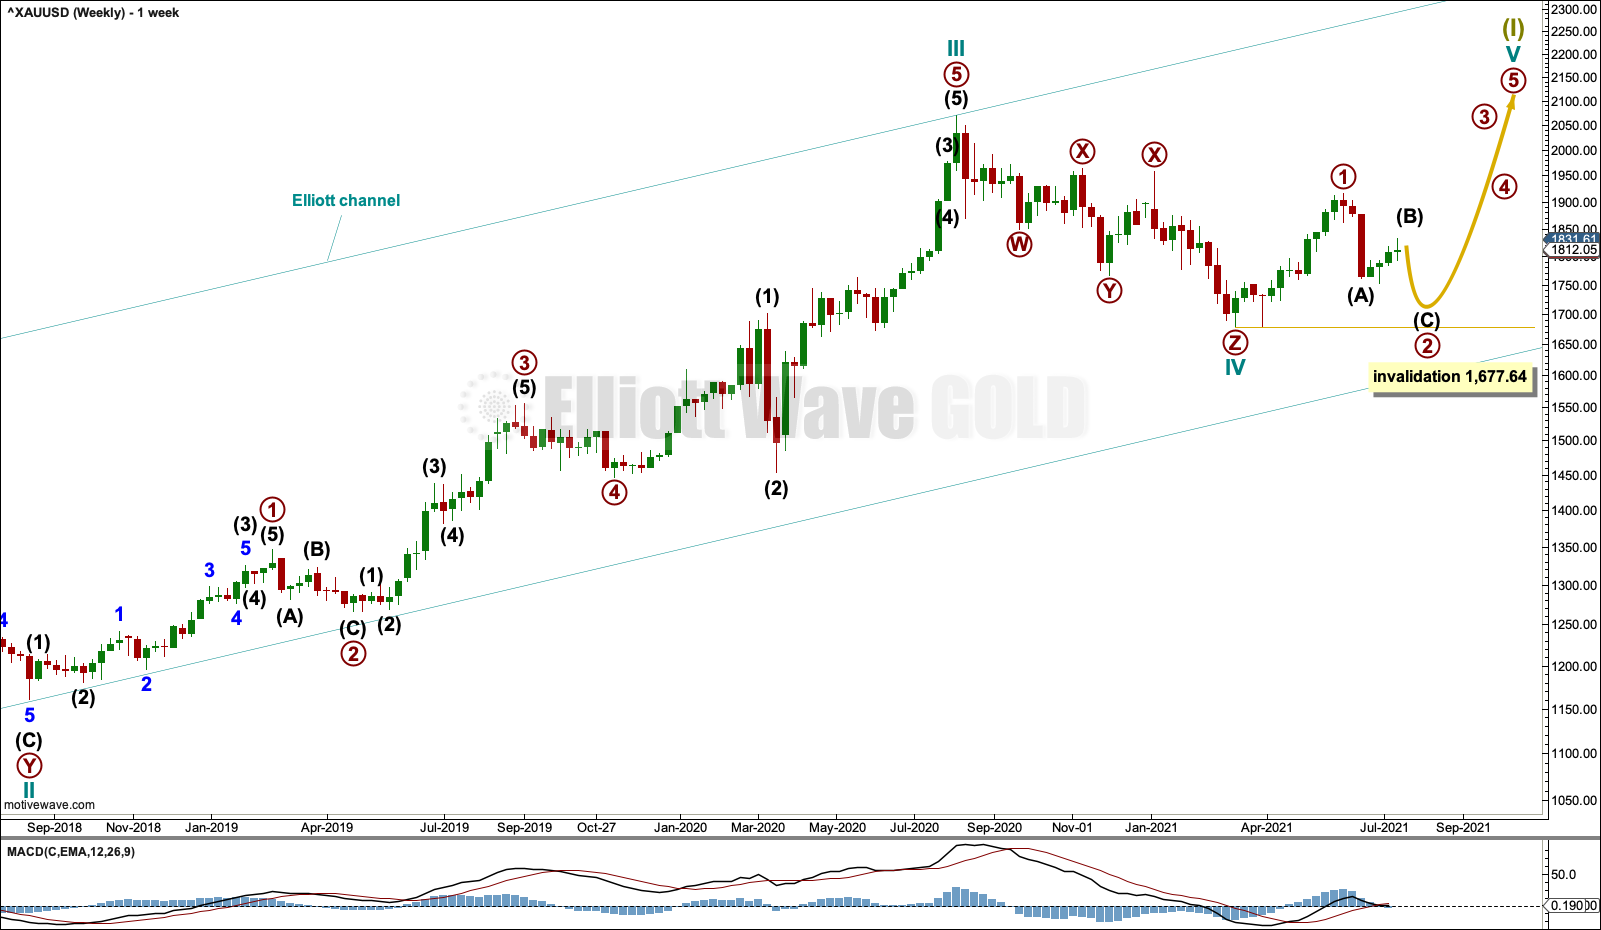
This wave count sees the the bear market complete at the last major low for Gold on 3 December 2015.
If Gold is in a new bull market, then it should begin with a five wave structure upwards on the weekly chart.
Cycle wave I fits as a five wave impulse with reasonably proportionate corrections for primary waves 2 and 4.
Cycle wave II fits as a double flat. However, within the first flat correction labelled primary wave W, this wave count needs to ignore what looks like an obvious triangle from July to September 2016 (this can be seen labelled as a triangle on the second weekly chart on prior analysis here). This movement must be labelled as a series of overlapping first and second waves. Ignoring this triangle reduces the probability of this wave count in Elliott wave terms.
Double flats are fairly rare structures. The probability of this wave count is further reduced.
Cycle wave IV may be a complete triple zigzag. Triple zigzags are not rare structures, but they are not common. The probability of this wave count is further reduced in Elliott wave terms. This is one reason why an alternate is still considered.
Cycle wave V may have begun. Within cycle wave V: Primary wave 1 may be over at the last high, and primary wave 2 may not move beyond the start of primary wave 1 below 1,677.64.
DAILY CHART
Click chart to enlarge.
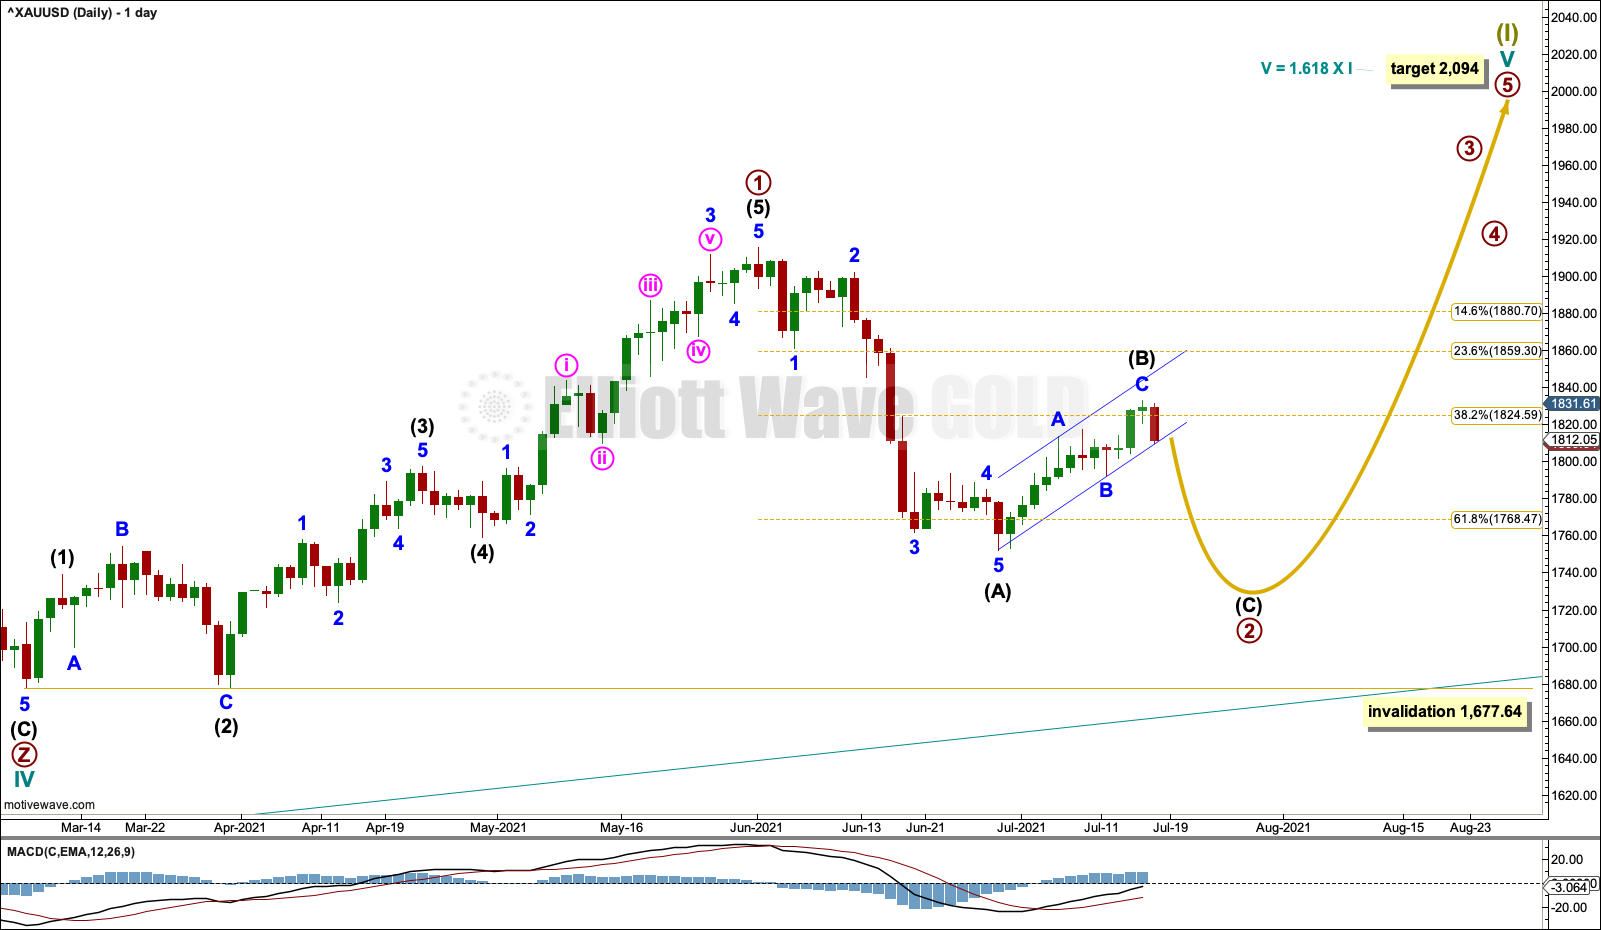
A target is calculated for cycle wave V. If this target is wrong for this wave count, then it may be too low. As price approaches the target, if the structure is incomplete, then a higher target may be calculated.
Primary wave 1 within cycle wave V may be complete.
Primary wave 2 may be an incomplete zigzag. Intermediate waves (A) and (B) within primary wave 2 may now both be complete. A target is calculated for intermediate wave (C). Intermediate wave (C) should at least make a new low below the end of intermediate wave (A) to avoid a truncation. When the channel about intermediate wave (B) is breached by downwards movement, then that shall provide confidence that intermediate wave (B) is over.
Primary wave 2 may not move beyond the start of primary wave 1 below 1,677.64.
ALTERNATE ELLIOTT WAVE COUNT
WEEKLY CHART
Click chart to enlarge.
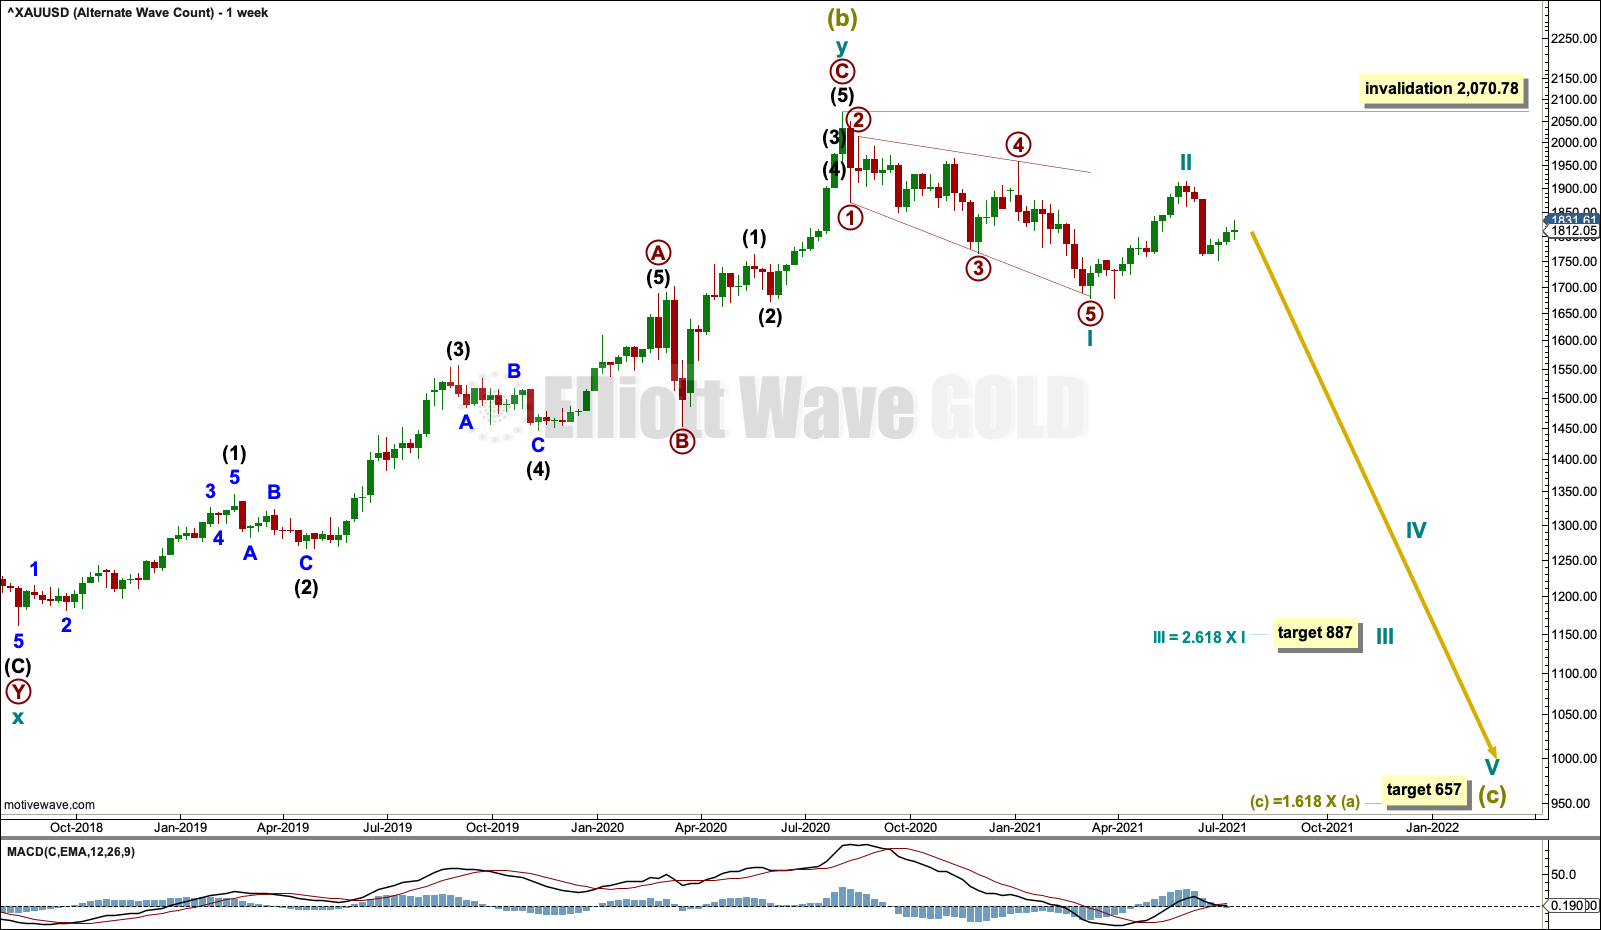
The bigger picture for this alternate Elliott wave count sees Gold as within a bear market, in a three steps back pattern that is labelled Grand Super Cycle wave IV on monthly charts. Grand Super Cycle wave IV may be subdividing as an expanded flat pattern.
Super Cycle wave (b) within Grand Super Cycle wave IV may be a complete double zigzag. This wave count expects Super Cycle wave (c) to move price below the end of Super Cycle wave (a) at 1,046.27 to avoid a truncation and a very rare running flat. The target calculated expects a common Fibonacci ratio for Super Cycle wave (c).
Super Cycle wave (c) may have begun with a leading expanding diagonal for cycle wave I. Leading expanding diagonals in first wave positions are uncommon, so the probability of this wave count is reduced. However, it has a good fit and must be considered.
Second wave corrections to follow leading diagonals in first wave positions are usually very deep. Cycle wave II is deep and the structure may be complete; so far it is following a common pattern. If it continues higher, then cycle wave II may not move beyond the start of cycle wave I above 2,070.78.
DAILY CHART
Click chart to enlarge.
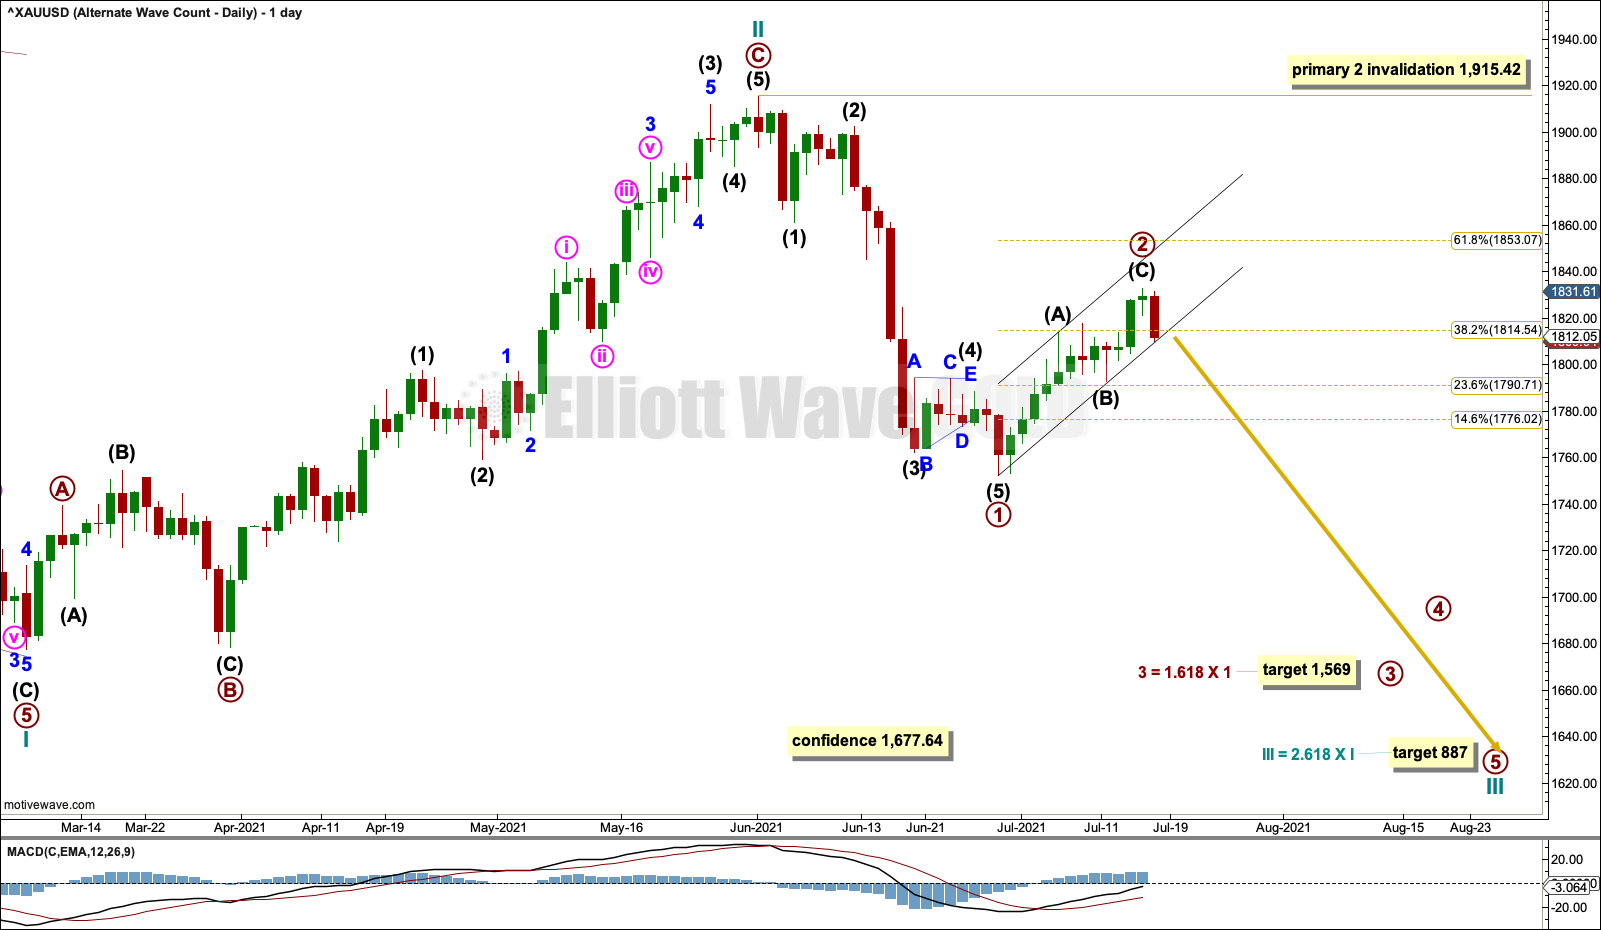
A target is calculated for cycle wave III.
Primary wave 1 within cycle wave III may be complete.
Primary wave 2 may now also be complete as a zigzag. However, it is possible that primary wave 2 may move higher as a double zigzag. If it does continue higher, then the target would be at the 0.618 Fibonacci ratio of primary wave 1 at 1,853.
Primary wave 2 may not move beyond the start of primary wave 1 above 1,915.42.
Draw a channel about primary wave 2. When this channel is breached by downwards movement, it may then provide confidence primary wave 2 as complete and primary wave 3 as just begun.
TECHNICAL ANALYSIS
WEEKLY CHART
Click chart to enlarge. Chart courtesy of StockCharts.com.
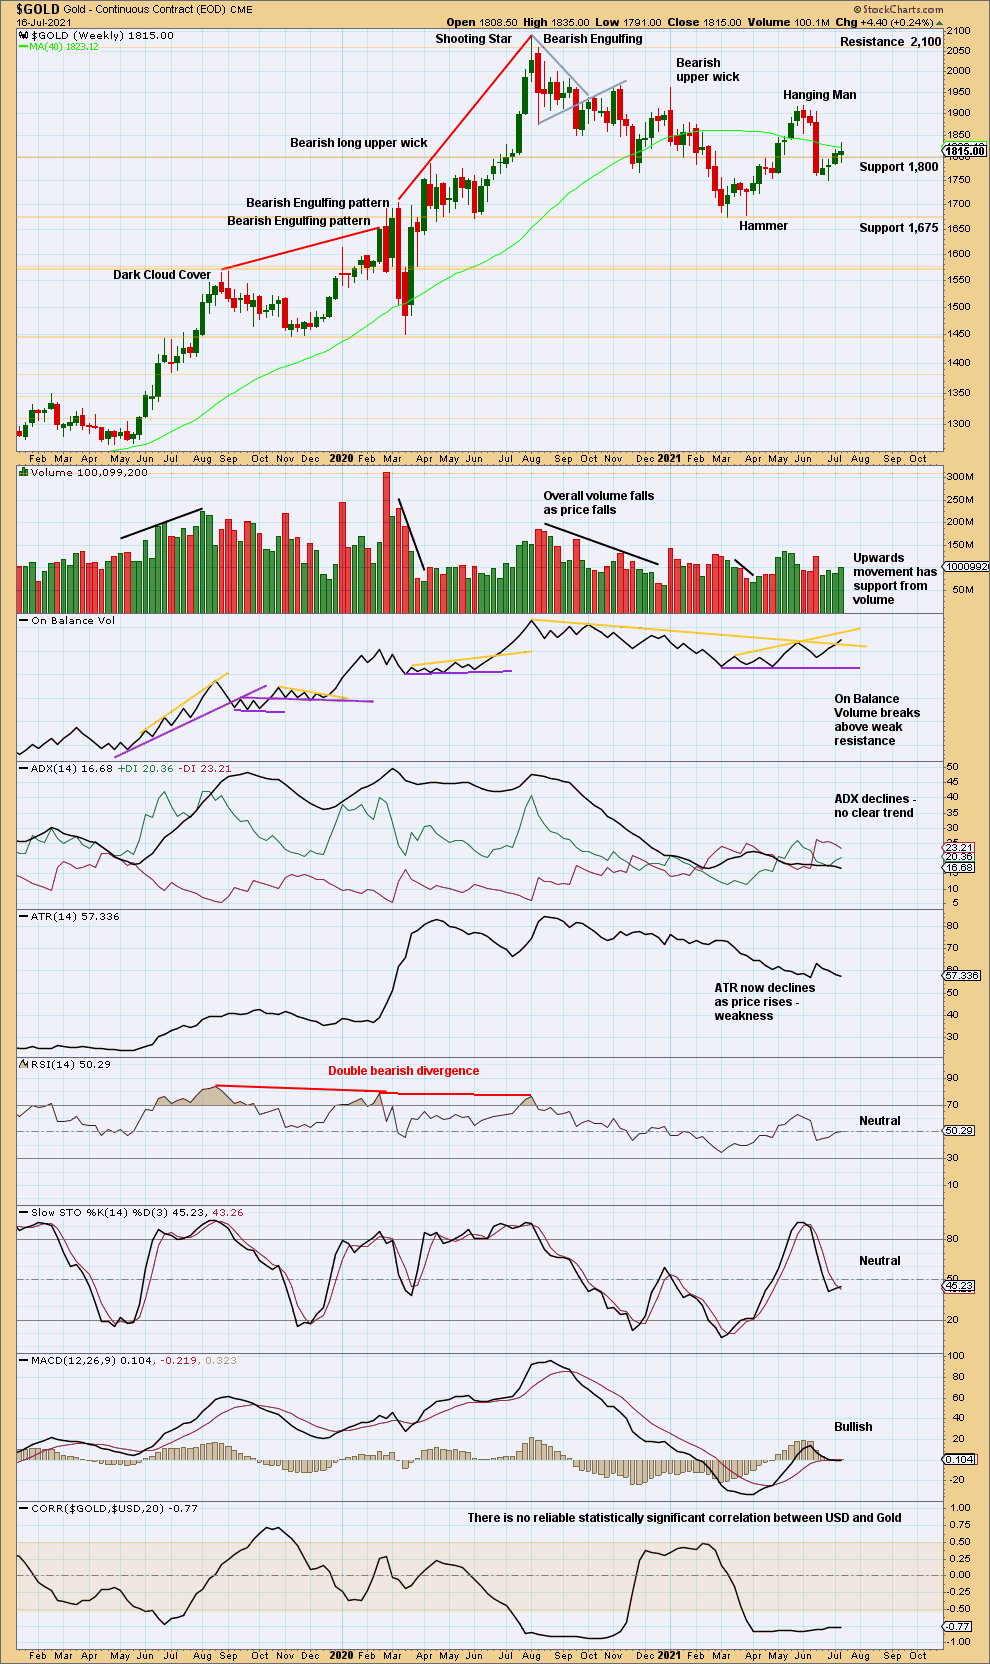
Range of the last four green weekly candlesticks is small. Volume has provided some support though and price has closed above prior resistance at 1,800. On Balance Volume gives a bullish signal.
It is possible that this bounce may continue a little further.
DAILY CHART
Click chart to enlarge. Chart courtesy of StockCharts.com.
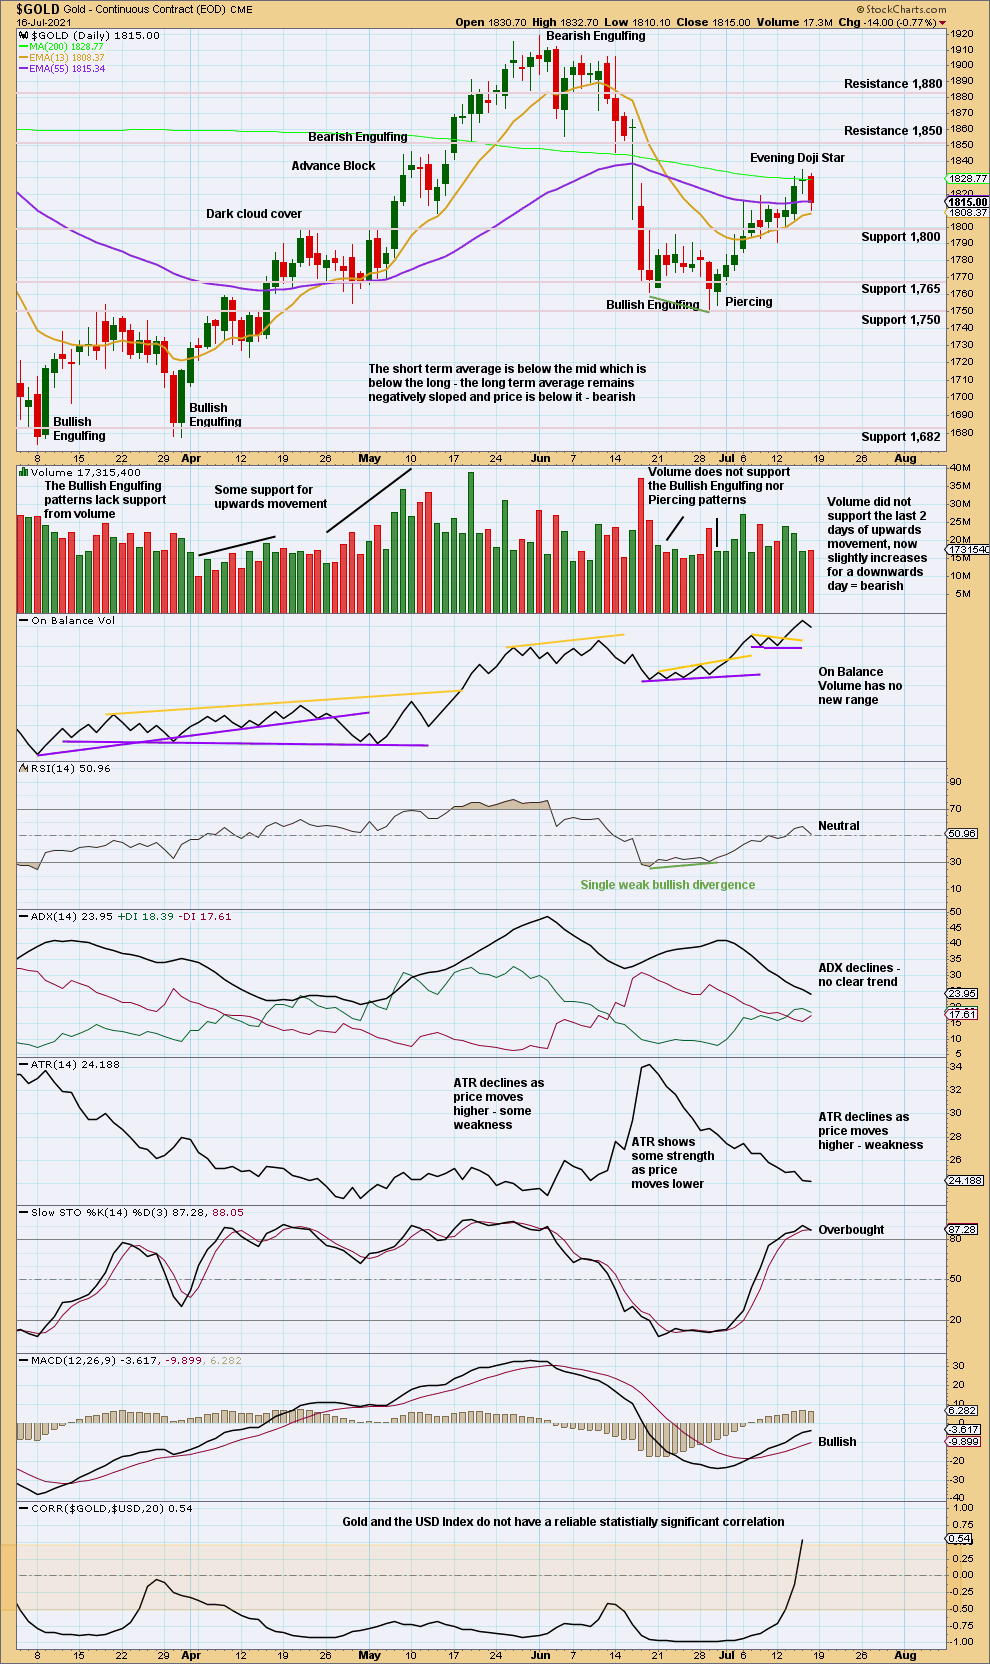
Stochastsics is overbought, ADX indicates no clear trend, and now there is a bearish candlestick pattern at the high. The bounce may be over.
GDX WEEKLY CHART
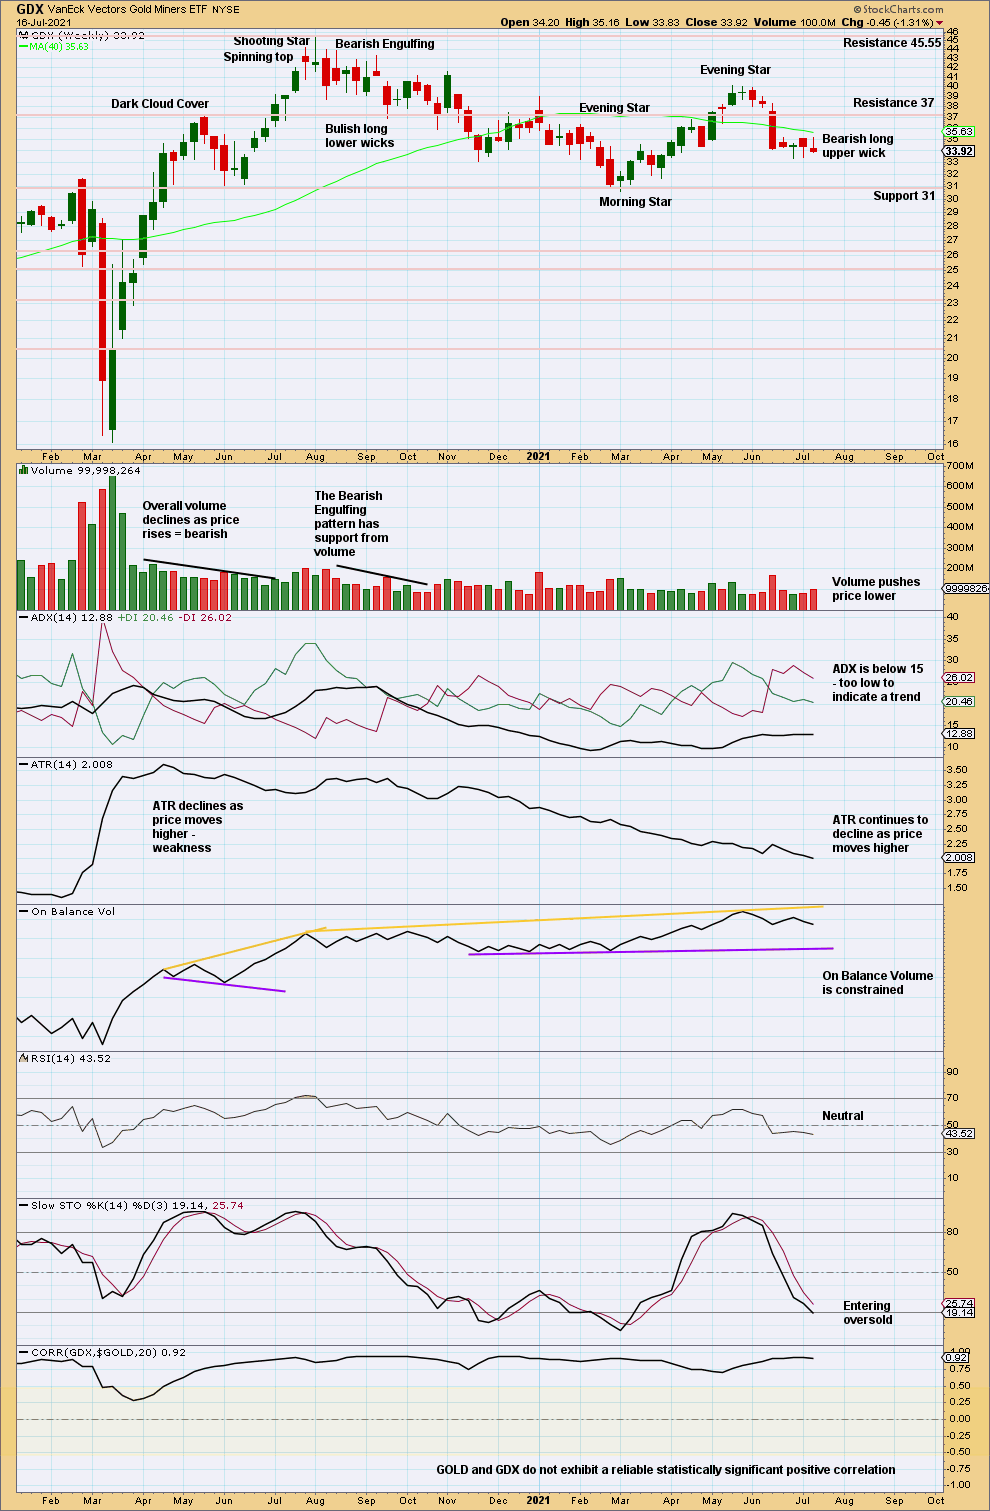
Click chart to enlarge. Chart courtesy of StockCharts.com.
An increase in volume for a downwards week and a bearish long upper wick suggest more downwards movement next week.
GDX DAILY CHART
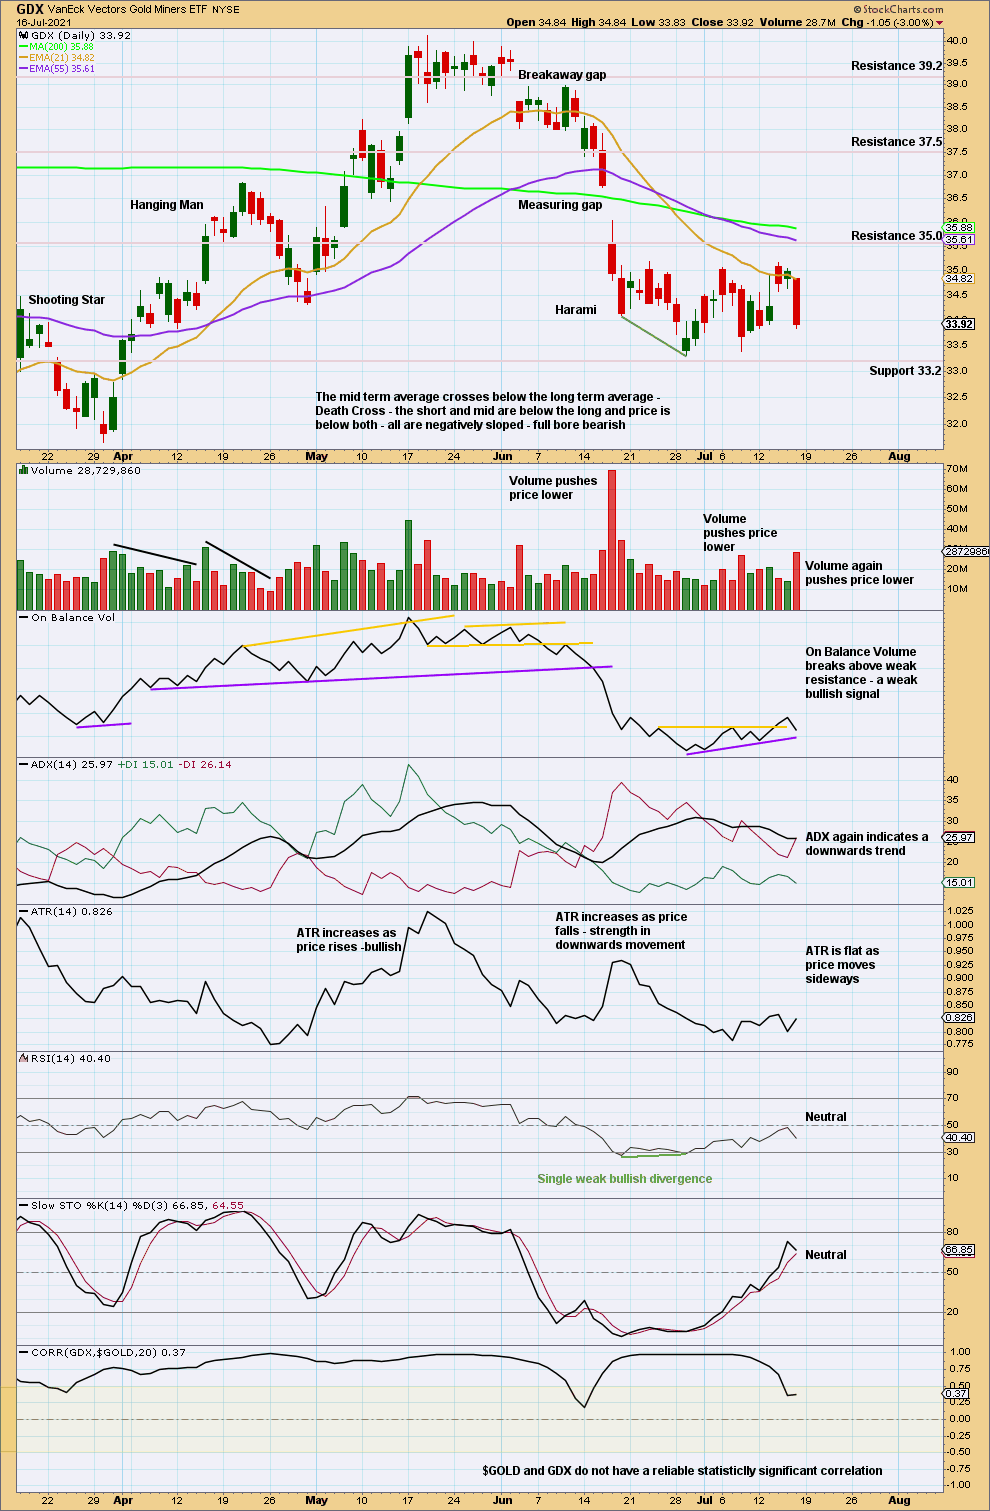
Click chart to enlarge. Chart courtesy of StockCharts.com.
Price is consolidating with resistance about 35 and support about 33.3. A breakout is required before confidence in the next direction may be had. Friday’s strong downwards session suggests a downwards breakout may come soon.
US OIL
Friday’s session has reached the lower edge of the Elliott channel on the daily chart.
Summary: The main Elliott wave count expects upwards movement to resume to the next target at 110.61 to 112.79.
Oil may have found a major sustainable low in April 2020.
ELLIOTT WAVE COUNT
MONTHLY CHART
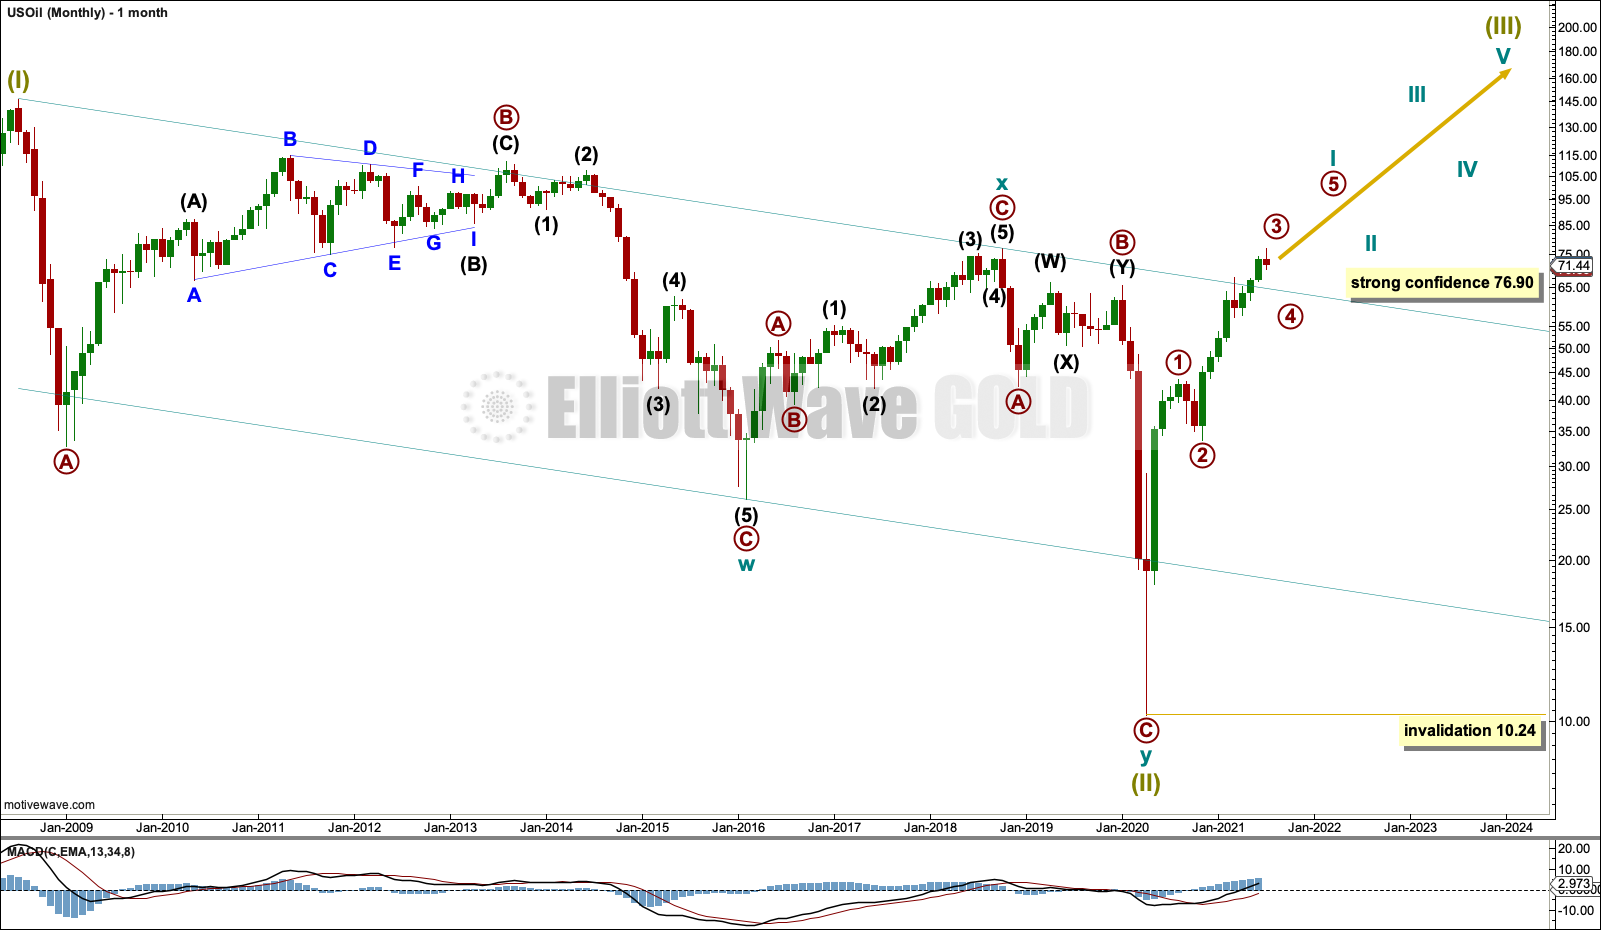
Click chart to enlarge.
The basic Elliott wave structure is five steps forward and three steps back. This Elliott wave count expects that US Oil has completed a three steps back pattern, which began in July 2008. The Elliott wave count expects that the bear market for US Oil may now be over.
Following Super Cycle wave (II), which was a correction (three steps back), Super Cycle wave (III), which may have begun, should be five steps up when complete. Super Cycle wave (III) may last a generation and must make a new high above the end of Super Cycle wave (I) at 146.73.
A channel is drawn about Super Cycle wave (II): draw the first trend line from the start of cycle wave w to the end of cycle wave x, then place a parallel copy on the end of cycle wave w. This trend line is breached to the downside, which is a typical look for the end of a movement for a commodity.
The upper edge of the channel has now been breached by upwards movement. This trend line may now provide support for any deeper pullbacks along the way up.
A new high above the high at 76.90 from October 2018 has been made. This is a significant new high and was expected from this wave count. Further confidence in a bull market for Oil may be had.
Super Cycle wave (III) may only subdivide as a five wave impulse. New trends for Oil usually start out very slowly with short first waves and deep time consuming second wave corrections. However, while this is a common tendency, it is not always seen and may not have been seen in this instance. The first reasonably sized pullback may be over already.
WEEKLY CHART
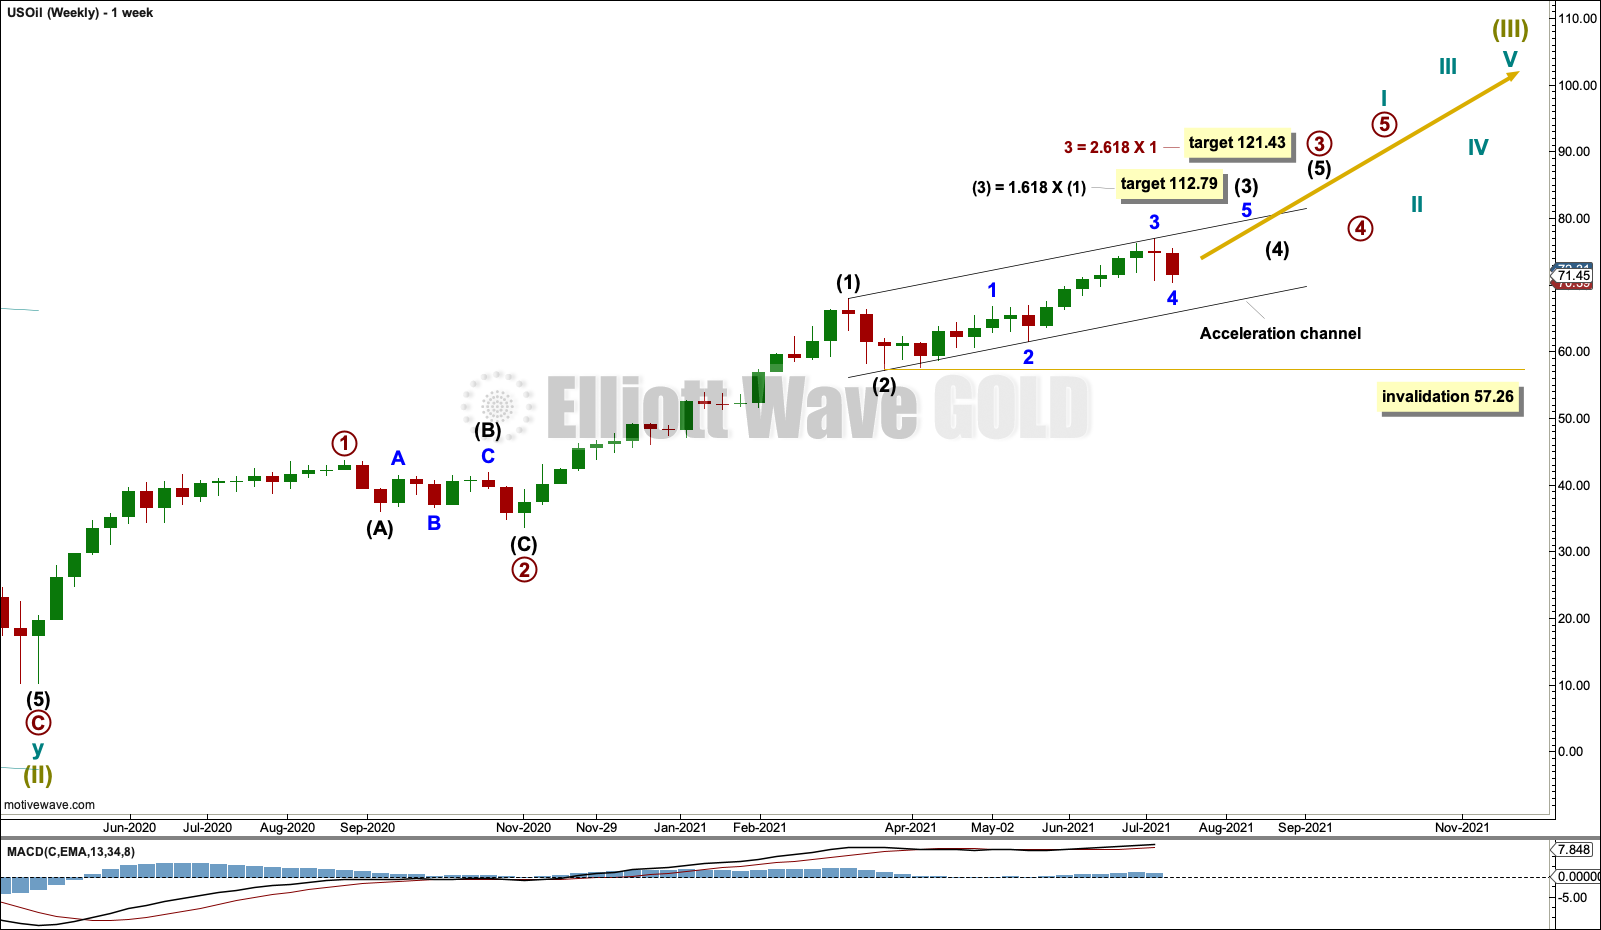
Click chart to enlarge.
Super Cycle wave (III) must subdivide as an impulse.
Cycle wave I within Super Cycle wave (III) may be incomplete.
Within cycle wave I: Primary waves 1 and 2 may be complete, and primary wave 3 may only subdivide as an impulse.
Within primary wave 3: Intermediate waves (1) and (2) may be complete, and no second wave correction within intermediate wave (3) may move beyond its start below 57.26.
DAILY CHART
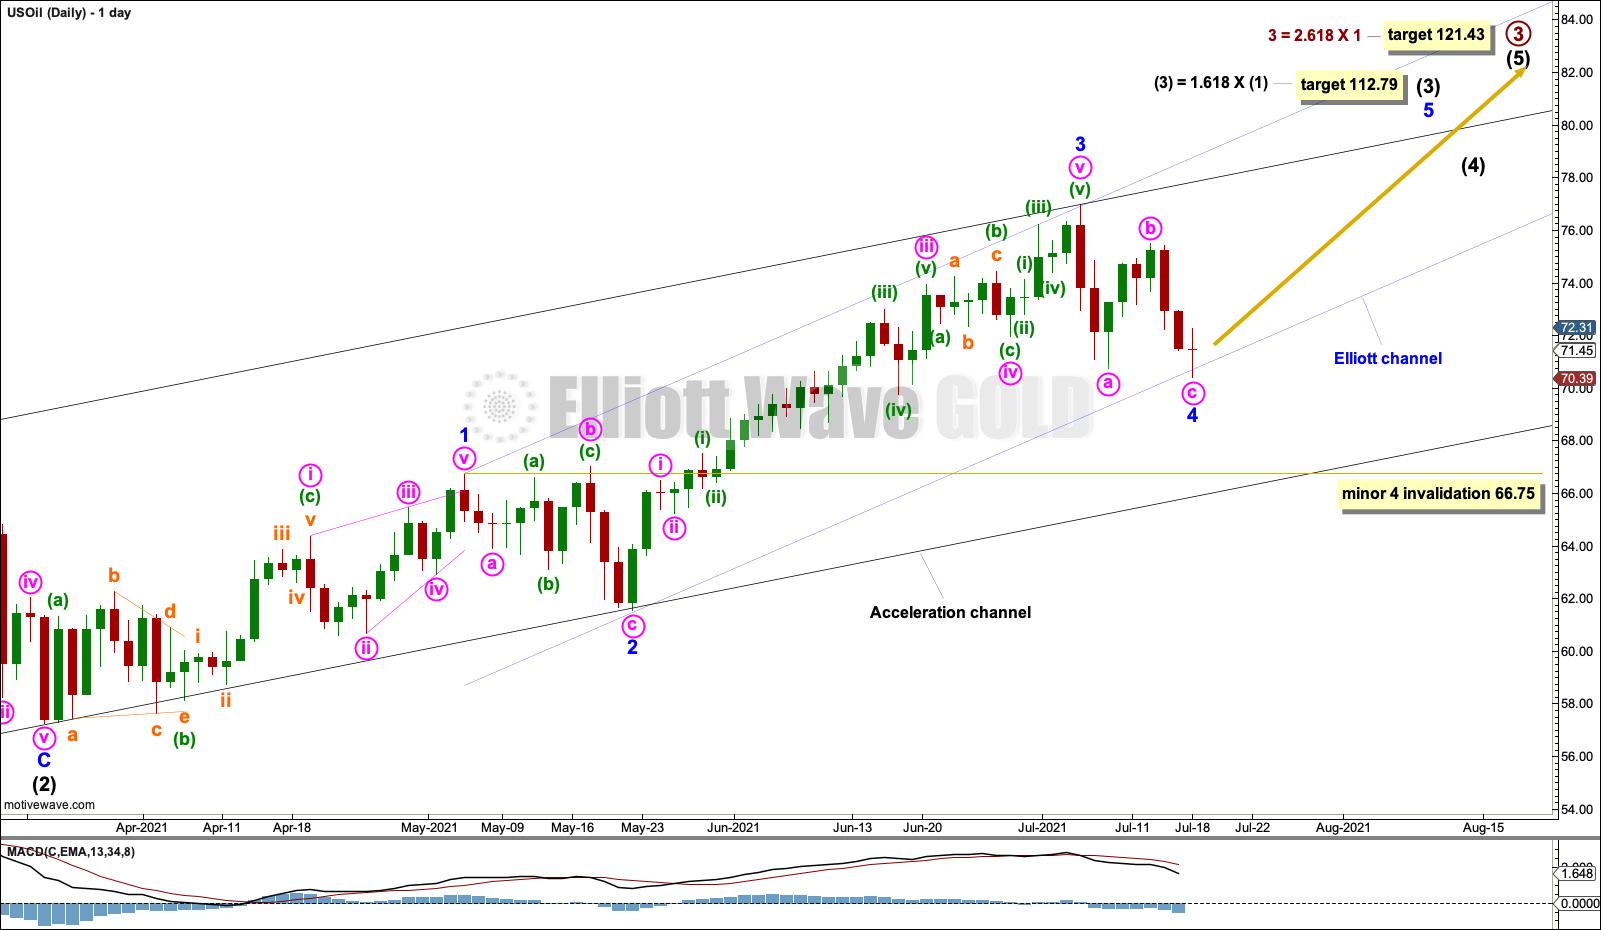
Click chart to enlarge.
Within intermediate wave (3), minor wave 1 may be a complete leading contracting diagonal. Following a leading diagonal in a first wave position, the second wave correction is usually very deep. Minor wave 2 is a 0.55 depth of minor wave 1.
When a first wave subdivides as a leading diagonal, then the third wave is almost always extended. If minor wave 3 was over at the last high, then it is very close to 1.618 the length of minor wave 1. The size of downwards movement this week looks like minor wave 4.
Draw an Elliott channel about intermediate wave (3). Draw the first trend line from the ends of minor waves 1 to 3, then place a parallel copy on the end of minor wave 2. When drawn on an arithmetic scale, this trend channel shows where price found support during Friday’s session.
A target zone is calculated at two degrees for intermediate wave (3) to end.
Minor wave 4 may not move into minor wave 1 price territory below 66.75.
ALTERNATE DAILY CHART
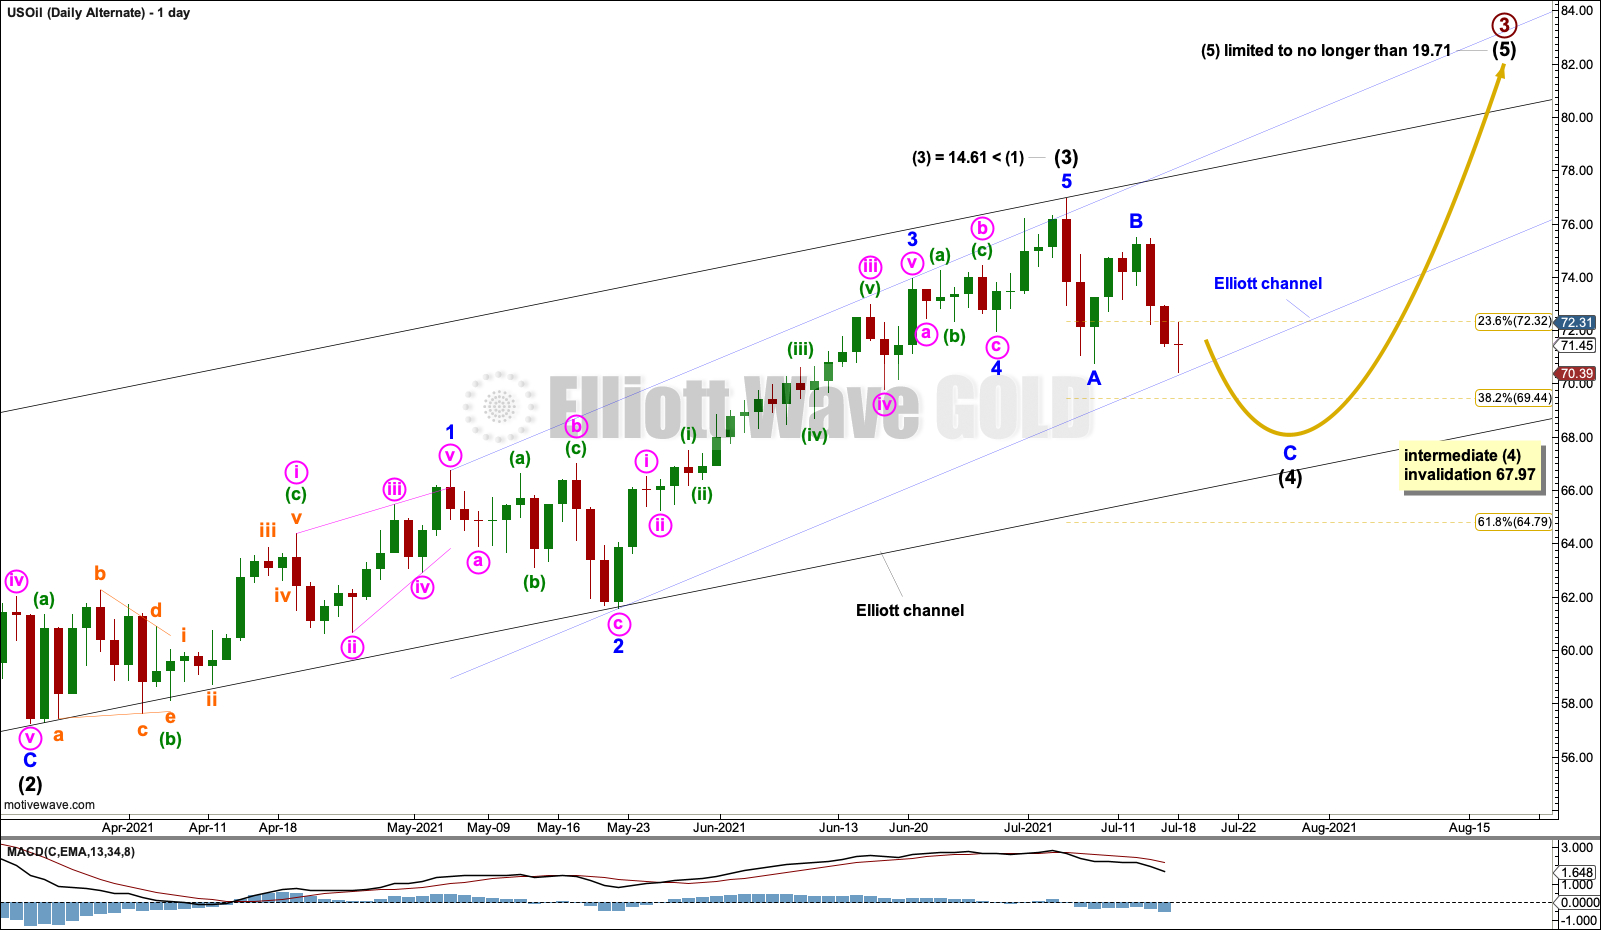
Click chart to enlarge.
If the degree of labelling within intermediate wave (3) is moved up one and it is slightly relabelled, then it is possible to see intermediate wave (3) over at the last high and the current pullback as intermediate wave (4).
Intermediate wave (4) may continue for a few more sessions. Intermediate wave (2) lasted 11 sessions and subdivided as a zigzag. So far intermediate wave (4) has lasted 8 sessions, but it may continue for a little longer to have better proportion to intermediate wave (2).
Intermediate wave (4) may subdivide as any corrective structure. So far it is labelled as a zigzag, but this labelling may need to change.
Intermediate wave (4) may not move into intermediate wave (1) price territory below 67.97.
For this wave count, intermediate wave (3) is significantly shorter than intermediate wave (1). Third waves are commonly longer than their counterpart first waves. This alternate wave count has a very low probability.
TECHNICAL ANALYSIS
WEEKLY CHART
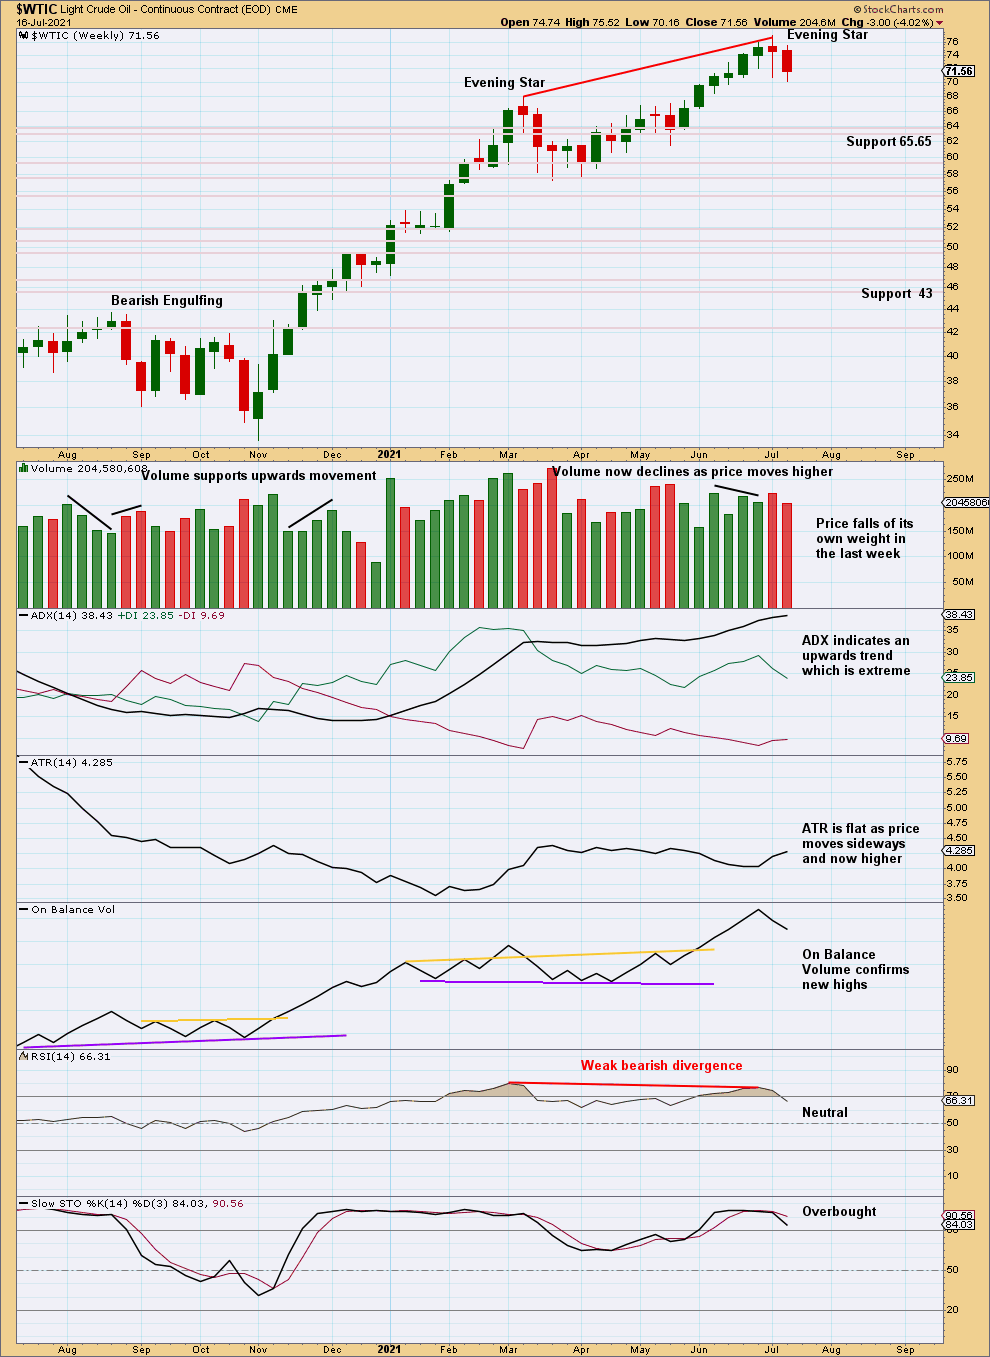
Click chart to enlarge. Chart courtesy of StockCharts.com.
This market can sustain extreme trends for a reasonable period of time.
Bearish divergence between price and RSI at the last two swing highs is weak. This may not be an indication of a major trend change.
DAILY CHART
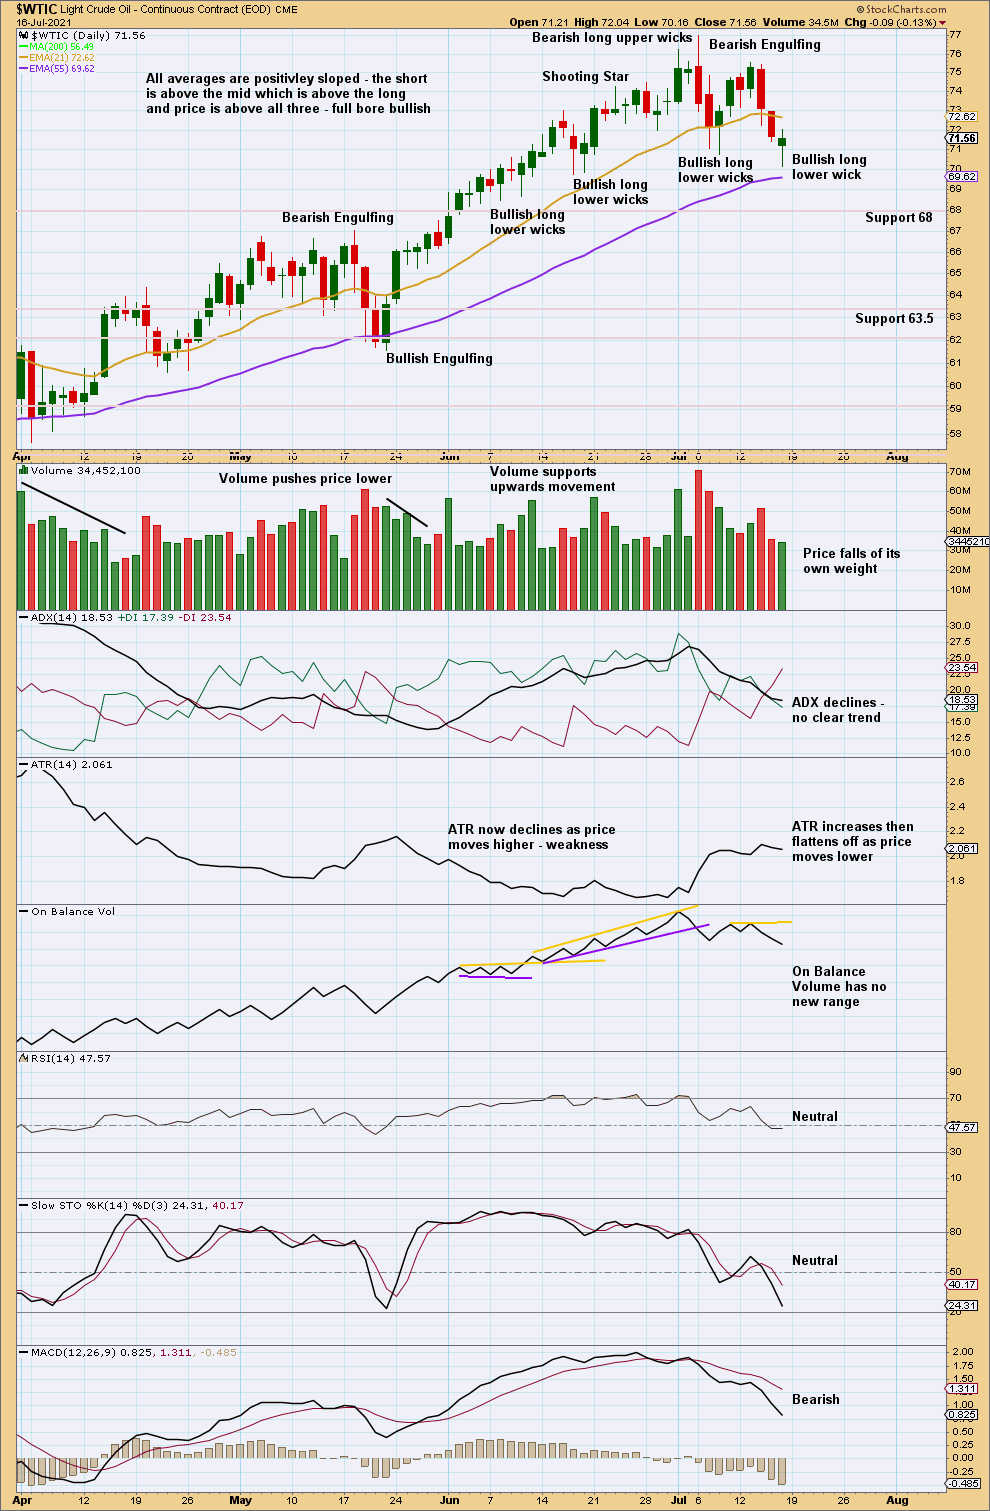
Click chart to enlarge. Chart courtesy of StockCharts.com.
A Bearish Engulfing candlestick pattern comes while the trend was not extreme and there was no clear bearish divergence between price and RSI. In these circumstances a larger trend change may not be the most likely result and may only indicate another short-term pullback.
This week the pullback has continued lower. It may be over here, or it may continue lower until Stochastics reaches oversold and price reaches support about 68.
—
Always practice good risk management as the most important aspect of trading. Always trade with stops and invest only 1-5% of equity on any one trade. Failure to manage risk is the most common mistake new traders make.
—