
Lara’s Weekly: Elliott Wave and Technical Analysis of S&P500 and Gold and US Oil | Charts – July 30, 2021

S&P 500
At the weekly chart level, the same three Elliott wave counts this week remain valid.
The main Elliott wave count remains the same and now has a short-term target.
Summary: There is a reasonably strong cluster of bearish signals from the AD line and short-term weak triple bearish divergence between price and RSI. Closure of the last gap with a new low below 4,369.87 would add confidence that a high is in place. Four Elliott wave counts are considered in order of probability:
1 – A minor degree fourth wave may continue lower and / or sideways for another two to five weeks. Support may be found about the lower edge of the Elliott channel on the main daily chart.
2 – The pullback is over and the upwards trend resumes to the next target at 4,922 (first alternate).
3 – An intermediate degree fourth wave on the weekly chart may move suddenly lower to find support about the lower edge of the Elliott channel, which sits about 3,956 (second alternate).
4 – A primary degree second wave may begin. It may meet the technical definition of a bear market in that it may correct to 20% or more of market value at its eventual low. Also, it may find support about 3,044 and may not make a new low below 2,191.86 (third alternate).
The biggest picture, Grand Super Cycle analysis, is here.
Last monthly charts are here. Video is here.
MAIN ELLIOTT WAVE COUNT
WEEKLY CHART
Click chart to enlarge.
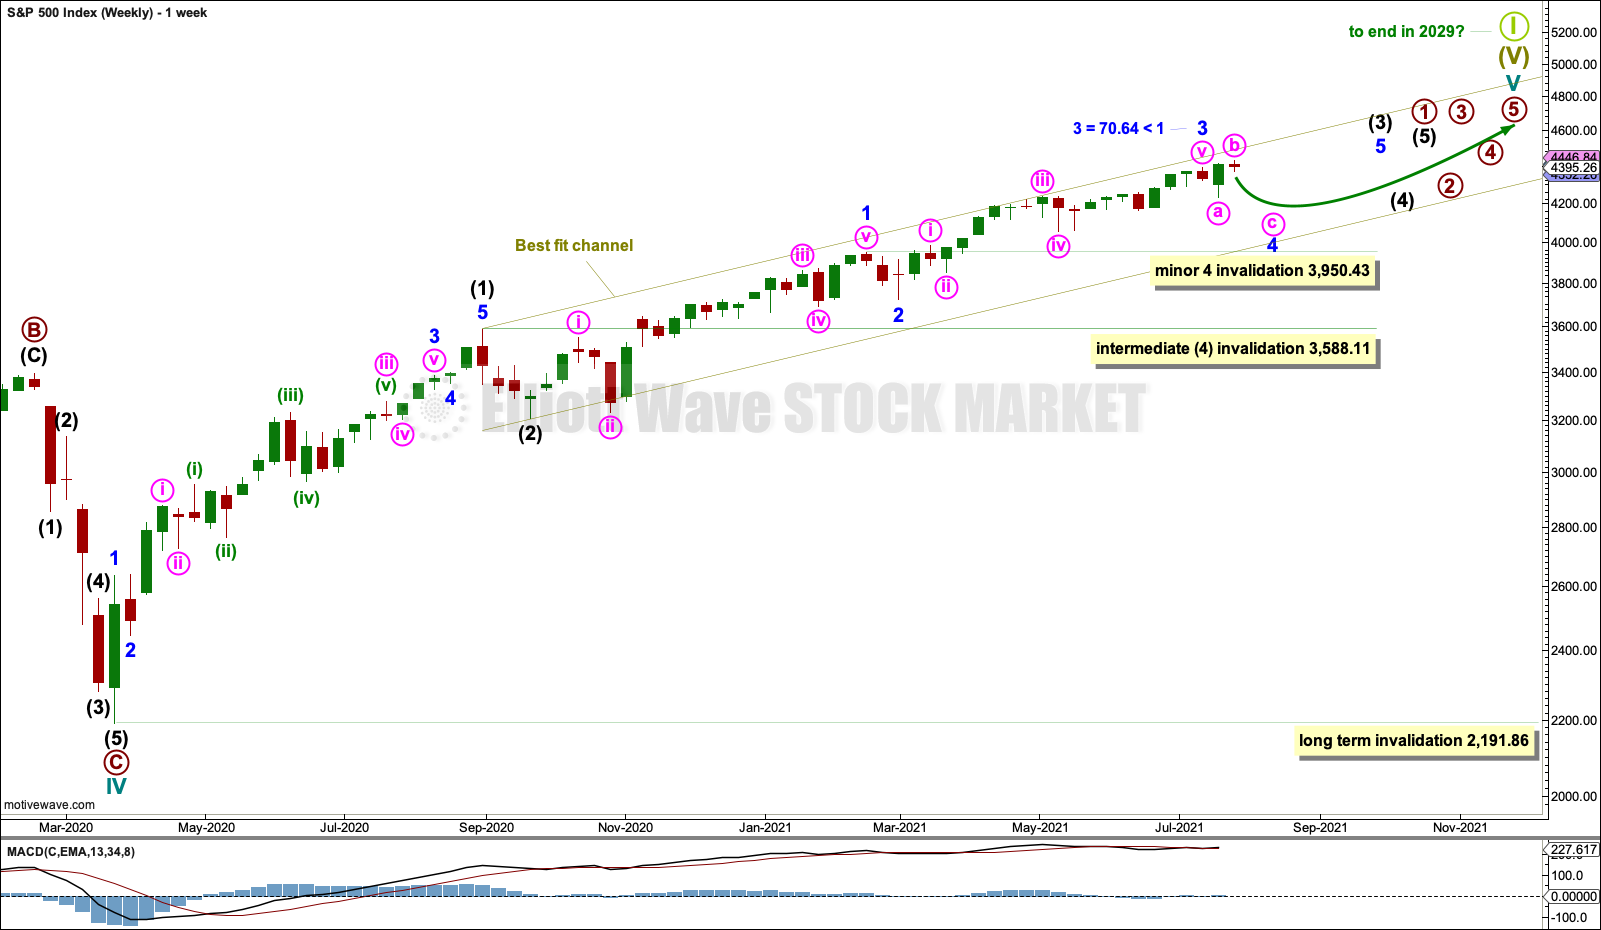
Cycle wave V may last from one to several years. So far it is in its sixteenth month.
This wave count may allow time for the AD line to diverge from price as price makes final highs before the end of the bull market. The AD line most commonly diverges a minimum of 4 months prior to the end of a bull market. A longer divergence is positively correlated with a deeper bear market. A shorter divergence is positively correlated with a more shallow bear market. There is now only eighteen days of divergence.
A longer divergence between price and the AD line would be expected towards the end of Grand Super Cycle wave I.
It is possible that cycle wave V may continue until 2029, if the 2020s mirror the 1920s. Either March or October 2029 may be likely months for the bull market to end.
Cycle wave V would most likely subdivide as an impulse. But if overlapping develops, then an ending diagonal should be considered. This chart considers the more common impulse.
There is already a Fibonacci ratio between cycle waves I and III within Super Cycle wave (V). The S&P500 often exhibits a Fibonacci ratio between two of its actionary waves but rarely between all three; it is less likely that cycle wave V would exhibit a Fibonacci ratio. The target for Super Cycle wave (V) to end would best be calculated at primary degree, but that cannot be done until all of primary waves 1, 2, 3 and 4 are complete.
Primary wave 1 within cycle wave V may be incomplete. This gives a very bullish wave count, expecting a long duration for cycle wave V which has not yet passed its middle strongest portion.
Within primary wave 1: Intermediate waves (1) and (2) may be complete, and intermediate wave (3) may now be approaching an end.
Intermediate wave (4) may not move into intermediate wave (1) price territory below 3,588.11.
Within intermediate wave (3), minor waves 1, 2 and 3 may be complete. Minor wave 3 may be shorter than minor wave 1 by 70.64 points. This limits minor wave 5 to no longer than equality in length with minor wave 3. Minor wave 4 may not move into minor wave 1 price territory below 3,950.43.
A best fit channel is drawn about cycle wave V. Draw the first trend line from the end of intermediate wave (1) to the end of minute wave iii within minor wave 3, then place a parallel copy on the end of intermediate wave (2). The channel may need to be redrawn as price continues higher. The channel may show where price may find resistance and support along the way up.
DAILY CHART
Click chart to enlarge.
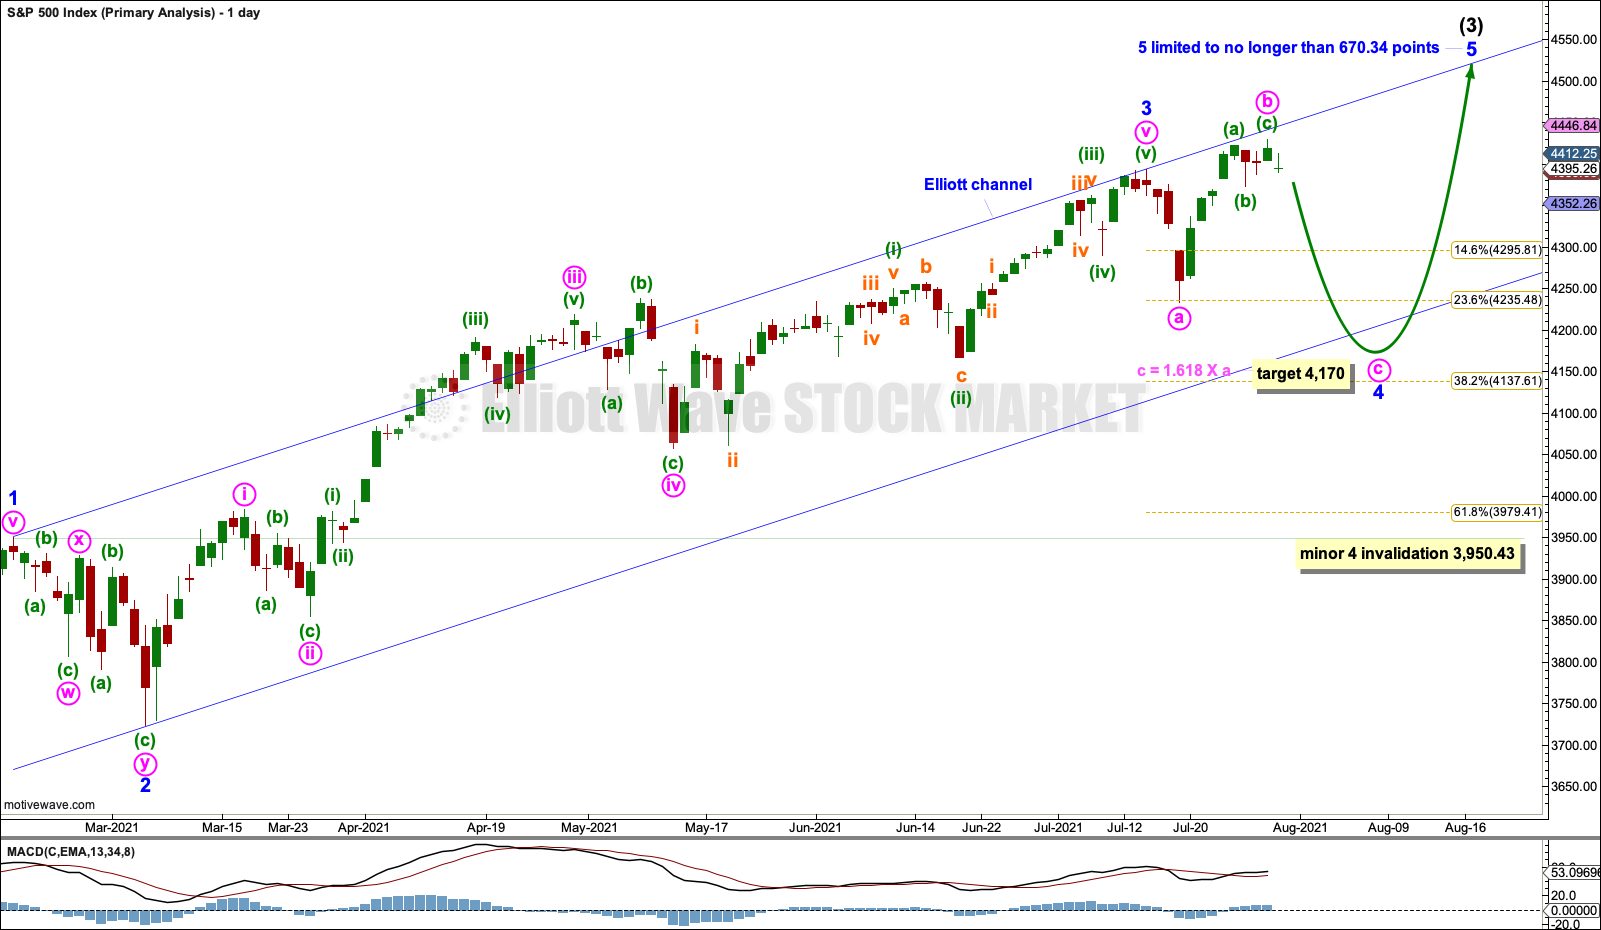
Minor wave 2 subdivided as a double zigzag and lasted 12 sessions. Minor wave 4 may last about 3 to 6 weeks and may most likely subdivide as a flat, triangle or combination, which are often longer lasting than zigzags. Flats, triangles or combinations are choppy sideways movements with swings from resistance to support and back again. Price does not move in a straight line during these swings, so it will not be possible to know which of several Elliott wave structures minor wave 4 has subdivided as until it may be over.
The most likely structure for minor wave 4 at this stage looks like an expanded flat, which is a very common structure. Minute wave c within minor wave 4 would be likely to make at least a slight new low below the end of minute wave a at 4,233.13 to avoid a truncation and a very rare running flat.
Draw an Elliott channel. Draw the first trend line from the ends of minor waves 1 to 3, then place a parallel copy on the end of minor wave 2. Minor wave 4 may find support about the lower edge of this channel.
A target is now calculated for minute wave c that would expect a small overshoot of the lower edge of the blue Elliott channel, which is acceptable. But if the target is wrong, then it may be a little too low as price may find support at the lower edge of the channel.
Minor wave 4 may not move into minor wave 1 price territory below 3,950.43.
If minor wave 3 is over, then it would be 70.64 points shorter than minor wave 1. This limits minor wave 5 to no longer than equality in length with minor wave 3, so that the core Elliott rule stating a third wave may never be the shortest is met.
FIRST ALTERNATE
DAILY CHART
Click chart to enlarge.
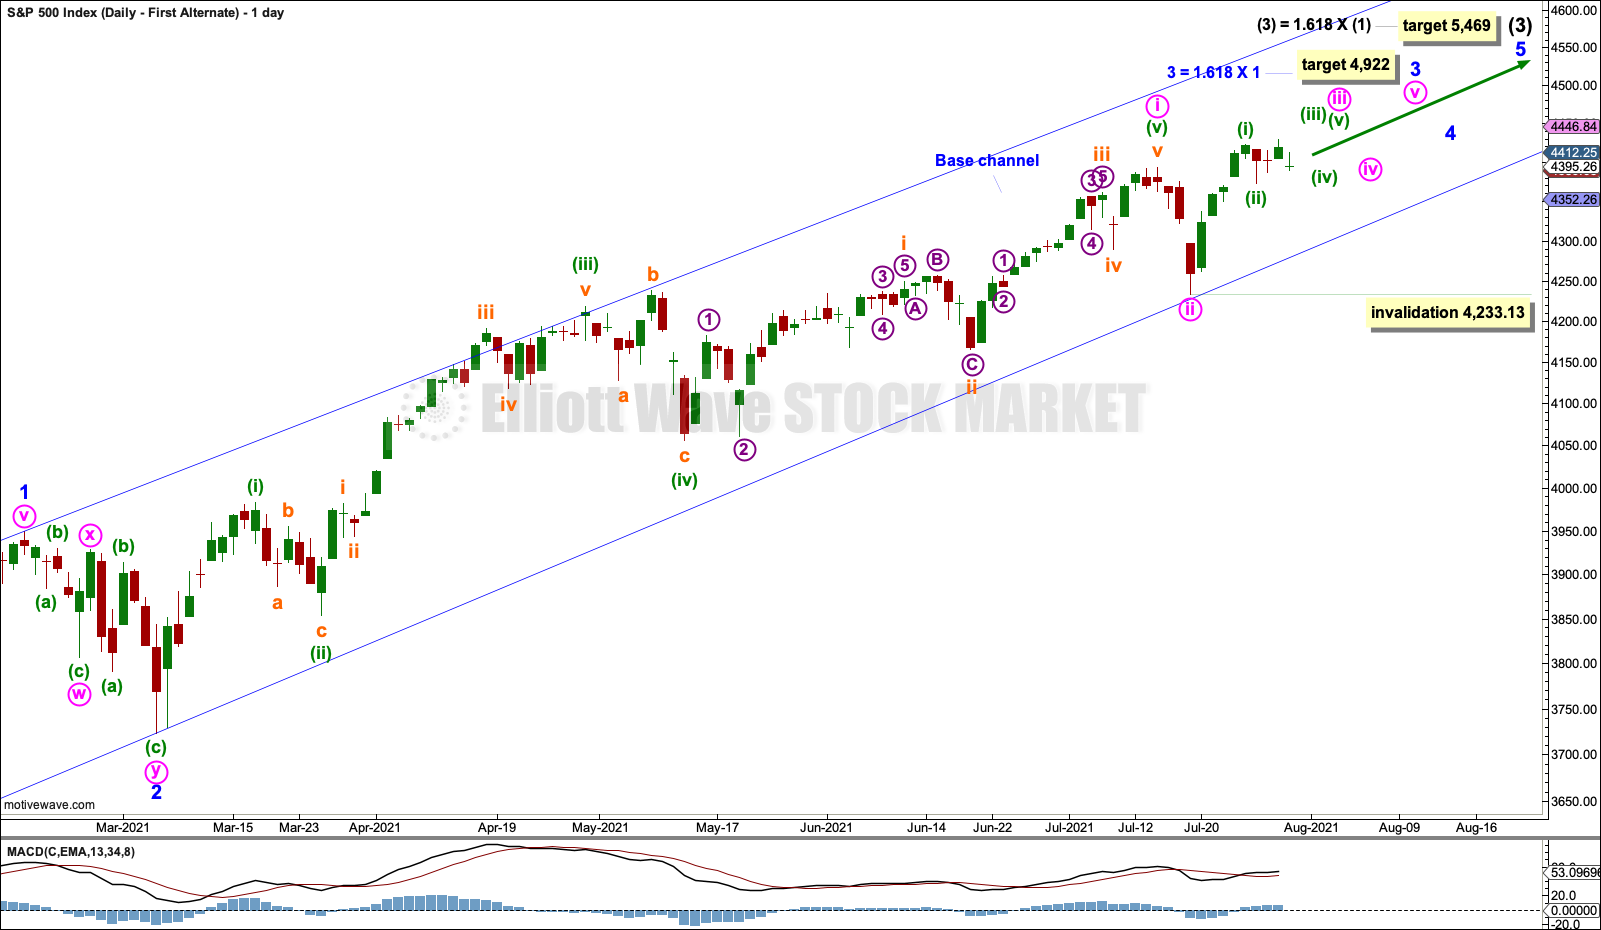
This alternate wave count has a lower probability than the main Elliott wave count. It is named first alternate mostly because we should always expect the trend remains the same until proven otherwise. With new all time highs this week, the S&P is still technically within an upwards trend. However, the cluster of bearish signals puts this wave count behind the main wave count at this stage.
If the degree of labelling within minor wave 3 is moved down one degree, then only minute wave i within minor wave 3 may be complete.
Minute wave ii within minor wave 3 may be over at the last low. A third wave up at minute, minor and intermediate degree may have begun.
Targets are calculated for minor wave 3 and intermediate wave (3) that expect common Fibonacci ratios.
No second wave correction within minute wave iii may move beyond its start below 4,233.13.
SECOND ALTERNATE
WEEKLY CHART
Click chart to enlarge.
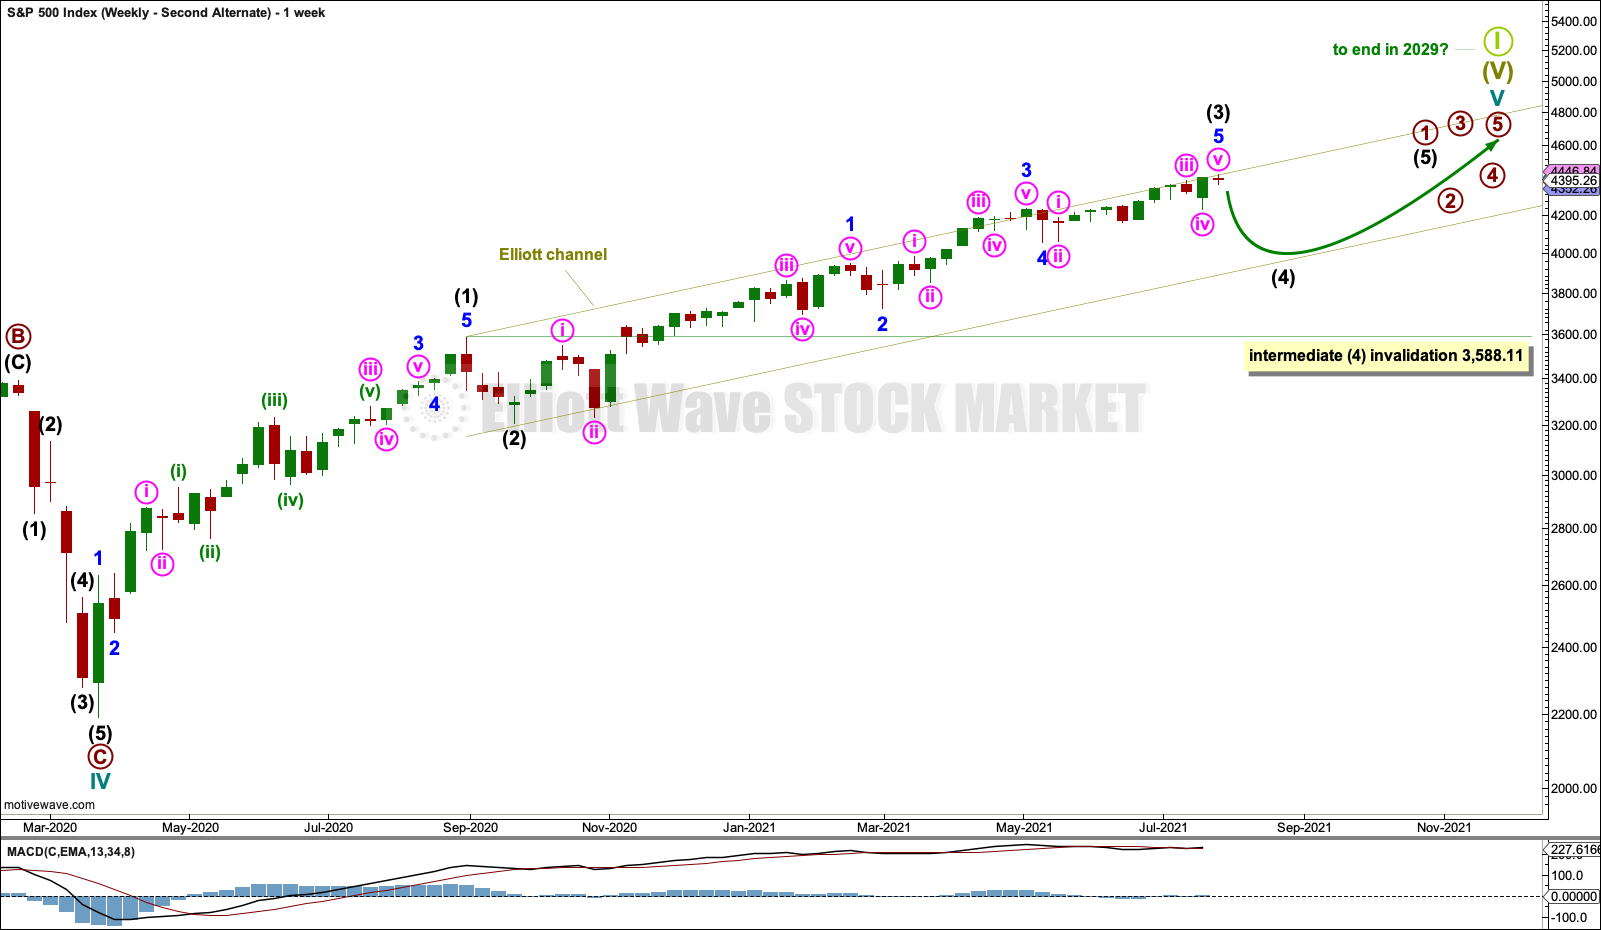
This weekly chart is again considered.
It is possible that intermediate wave (3) is over at the last high. However, it may also continue a little higher.
Intermediate wave (4) may last from three to several weeks and may find support about the lower edge of the Elliott channel. Intermediate wave (4) may not move into intermediate wave (1) price territory below 3,588.11.
Intermediate wave (3) is shorter than intermediate wave (1) by 182.97 points. It is unusual for third waves to be shorter than first waves for the S&P, particularly of a higher degree such as intermediate. This reduces the probability of this alternate wave count.
This alternate wave count is considered because the bearish divergence between price and the AD line is increasingly strong.
THIRD ALTERNATE
WEEKLY CHART
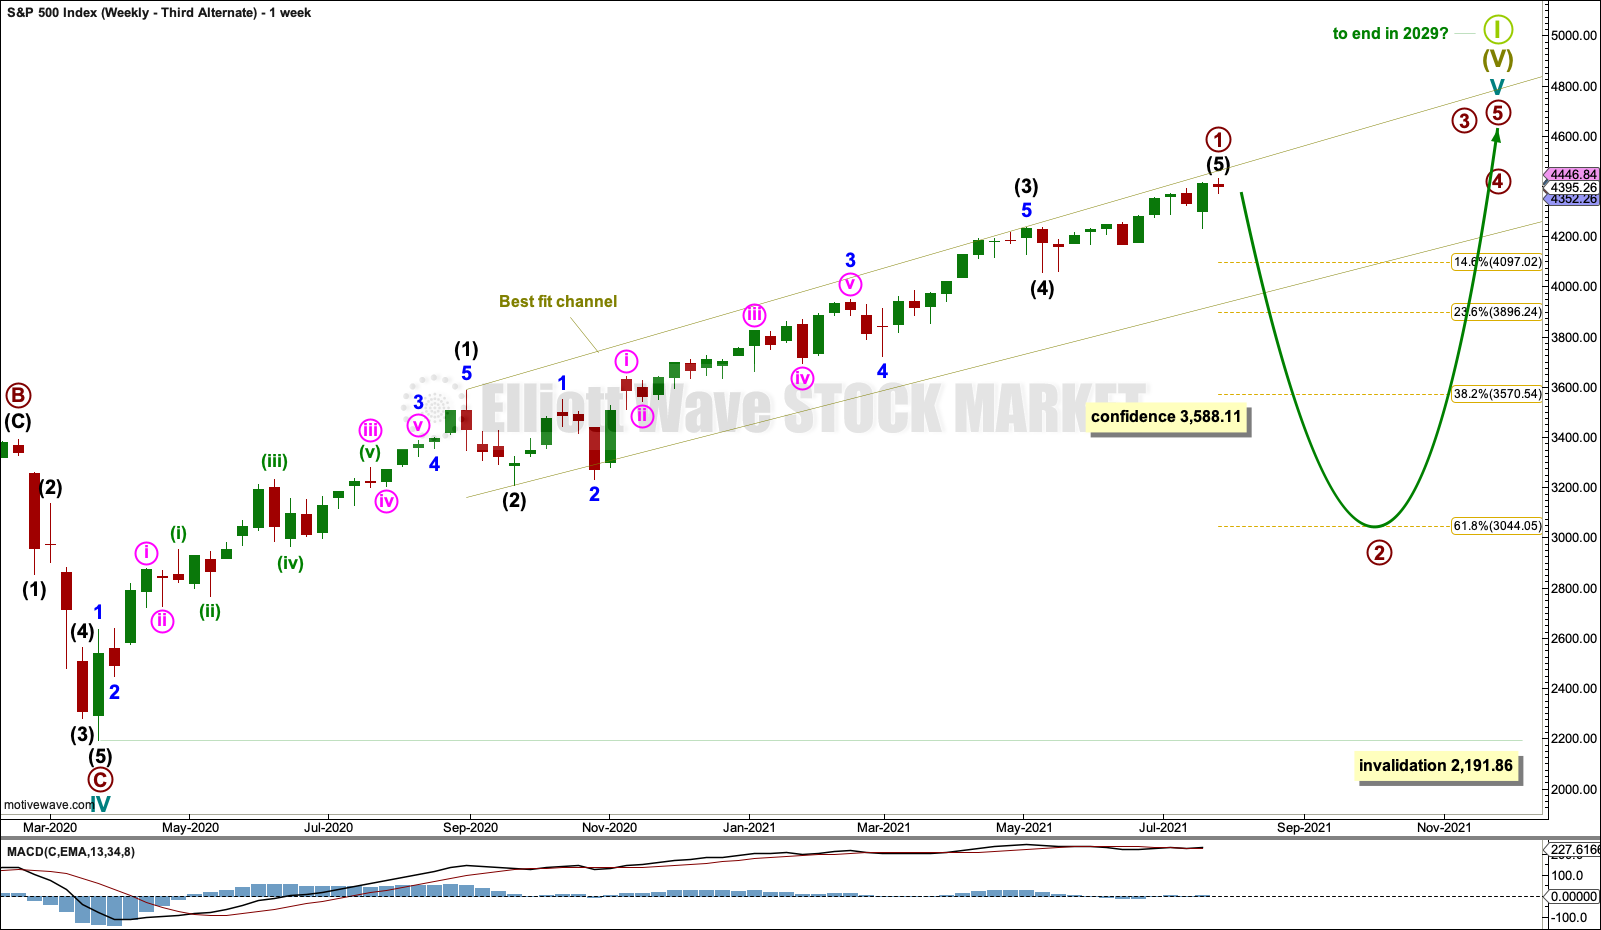
Click chart to enlarge.
This third alternate Elliott wave count is considered because it is technically possible. However, primary wave 2 may correct to the 0.618 Fibonacci ratio, which would be a 31% reduction in market value and meet the technical definition of a bear market. This is possible but has a very low probability as there is only 18 days of bearish divergence between price and the AD line. Within the last (almost) 100 years, only three bear markets have occurred following less than 4 months bearish divergence between price and the AD line. If this wave count is correct, then it would exhibit bearish divergence of less than 4 months a fourth time in almost 100 years; the probability of this alternate is rather low.
Primary wave 2 may last one to a few months. It may not move beyond the start of primary wave 1 below 2,191.86.
TECHNICAL ANALYSIS
WEEKLY CHART
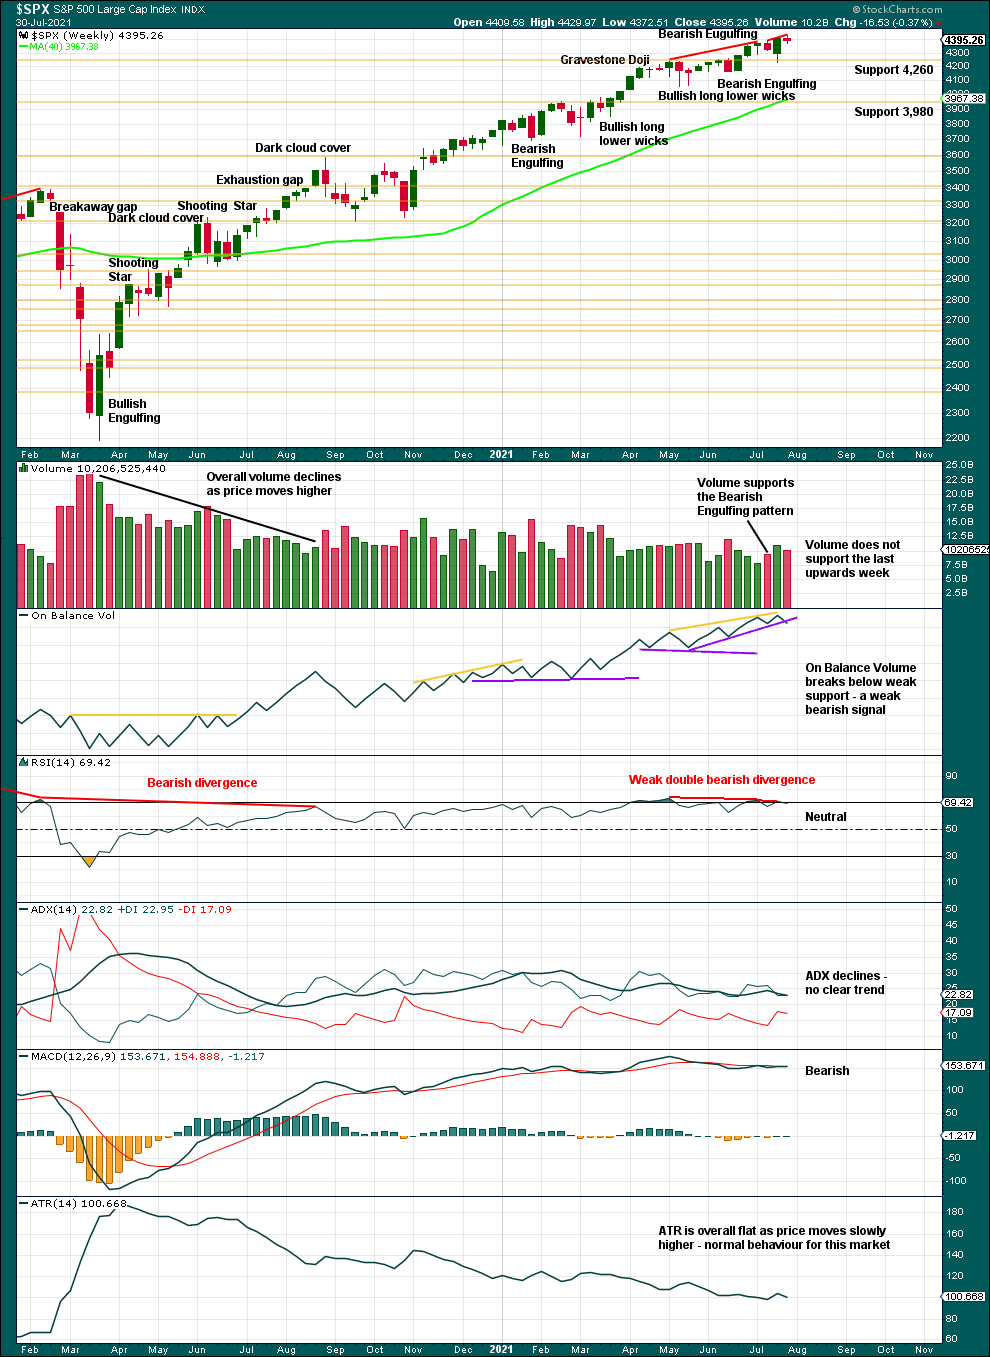
Click chart to enlarge. Chart courtesy of StockCharts.com.
This week there is now double bearish divergence between price and RSI, although it is weak. On Balance Volume also gives a bearish signal, but that too is weak.
There is some weakness evident in this chart, but it is not greatly concerning. It suggests a more time consuming consolidation or a deeper pullback may occur, but it would still be expected to most likely occur within the larger context of an ongoing bull market.
DAILY CHART
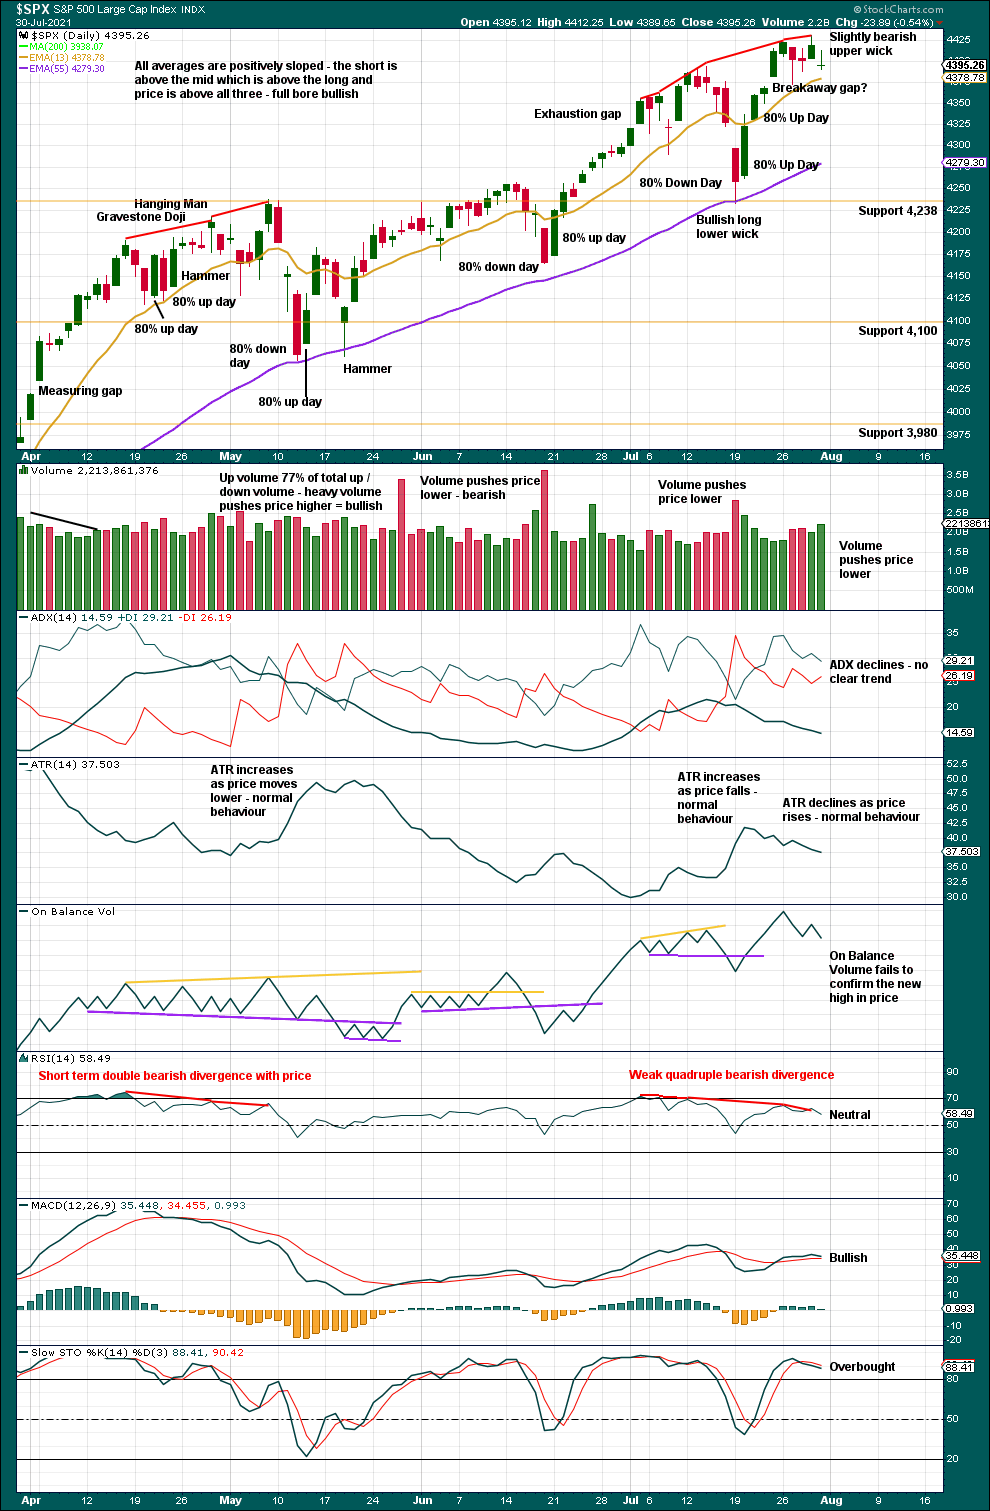
Click chart to enlarge. Chart courtesy of StockCharts.com.
Two back to back 80% up days are now complete off the last low, although they have not come after a 90% or two back to back 80% down days, so this is not enough for confidence in a sustainable low.
The last swing low on the 18th of June though did come with one 80% down day followed by one 80% up day.
However, on the 18th of June there was not a reasonable cluster of bearish signals from the AD line, short-term bearish divergence between price and RSI, nor a reasonable cluster of bearish signals from inverted VIX. The bearish signals are stronger in this instance.
A target from the breakaway gap is at 4,518.04. The gap remains open, so the target remains valid. If the gap is closed, then it would be renamed an exhaustion gap, which would be a bearish signal.
Bearish divergence between price and RSI is now quadruple, although it is still reasonably weak.
BREADTH – AD LINE
WEEKLY CHART
Click chart to enlarge. Chart courtesy of StockCharts.com. So that colour blind members are included, bearish signals will be noted with blue and bullish signals with yellow.
Breadth should be read as a leading indicator.
Lowry’s Operating Companies Only AD line has made a new all time high on the 8th of June. There is now over one and a half months of bearish divergence between the OCO AD line and price. This supports the main and second alternate Elliott wave counts but not necessarily the third alternate Elliott wave count.
Large caps all time high: 4,429.97 on Jul 29, 2021.
Mid caps all time high: 2,780.08 on May 10, 2021.
Small caps all time high: 1,417.45 on June 8, 2021.
With over 2 months of weakness in small and mid caps, some pullback or consolidation may result sooner. The Elliott wave count and supporting technical analysis suggest it may have begun.
Again, price makes a new all time high, but the AD line does not. This adds to the small cluster of bearish divergence and supports the main Elliott wave count.
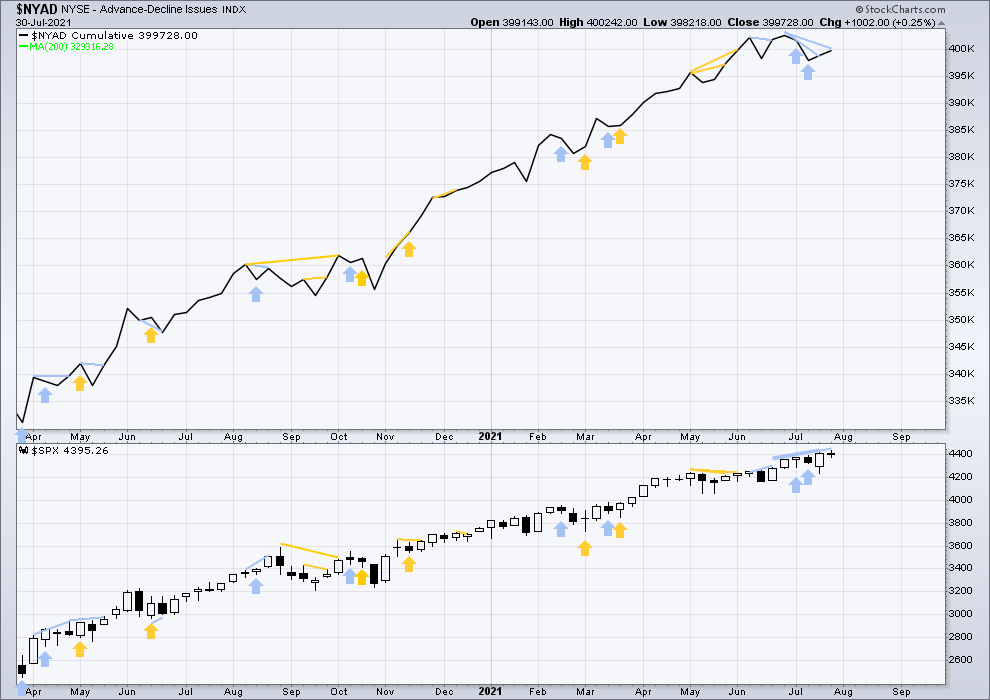
DAILY CHART
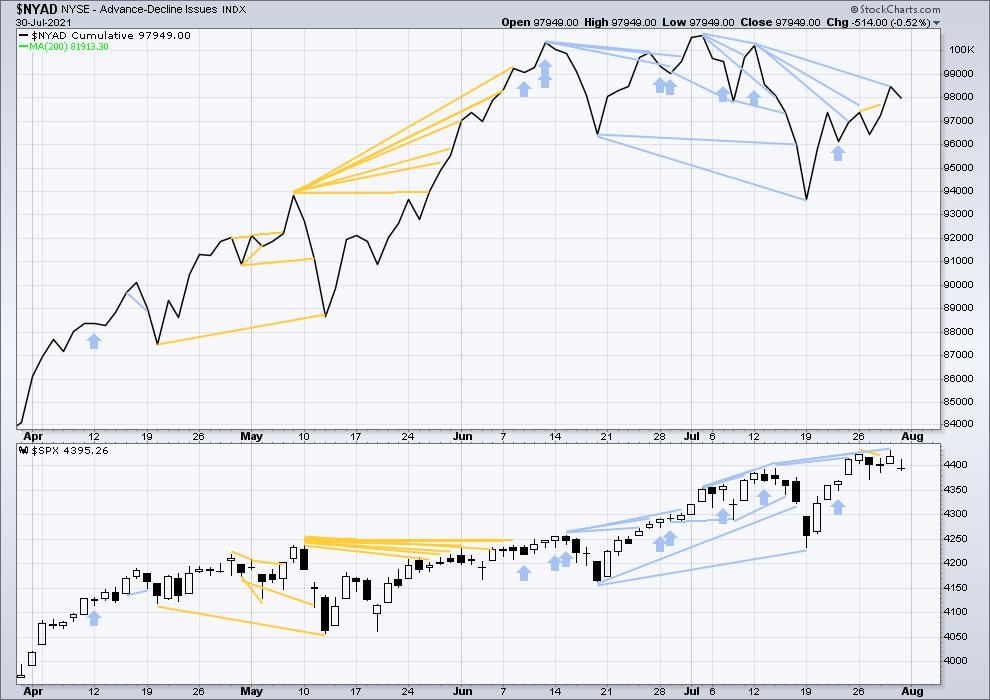
Click chart to enlarge. Chart courtesy of StockCharts.com. So that colour blind members are included, bearish signals will be noted with blue and bullish signals with yellow.
Both price and the AD line have moved slightly lower on Friday. There is no new short-term divergence. A reasonably strong cluster of bearish divergence remains, which supports the main or second alternate Elliott wave counts.
The last all time high for the AD line occurred just 18 days prior to the last all time high in price. With less than four weeks of bearish divergence, probability still favours a short-term pullback or consolidation and not a fully fledged bear market. This suggests the main Elliott wave count or second alternate Elliott wave count may be preferred.
VOLATILITY – INVERTED VIX CHART
WEEKLY CHART
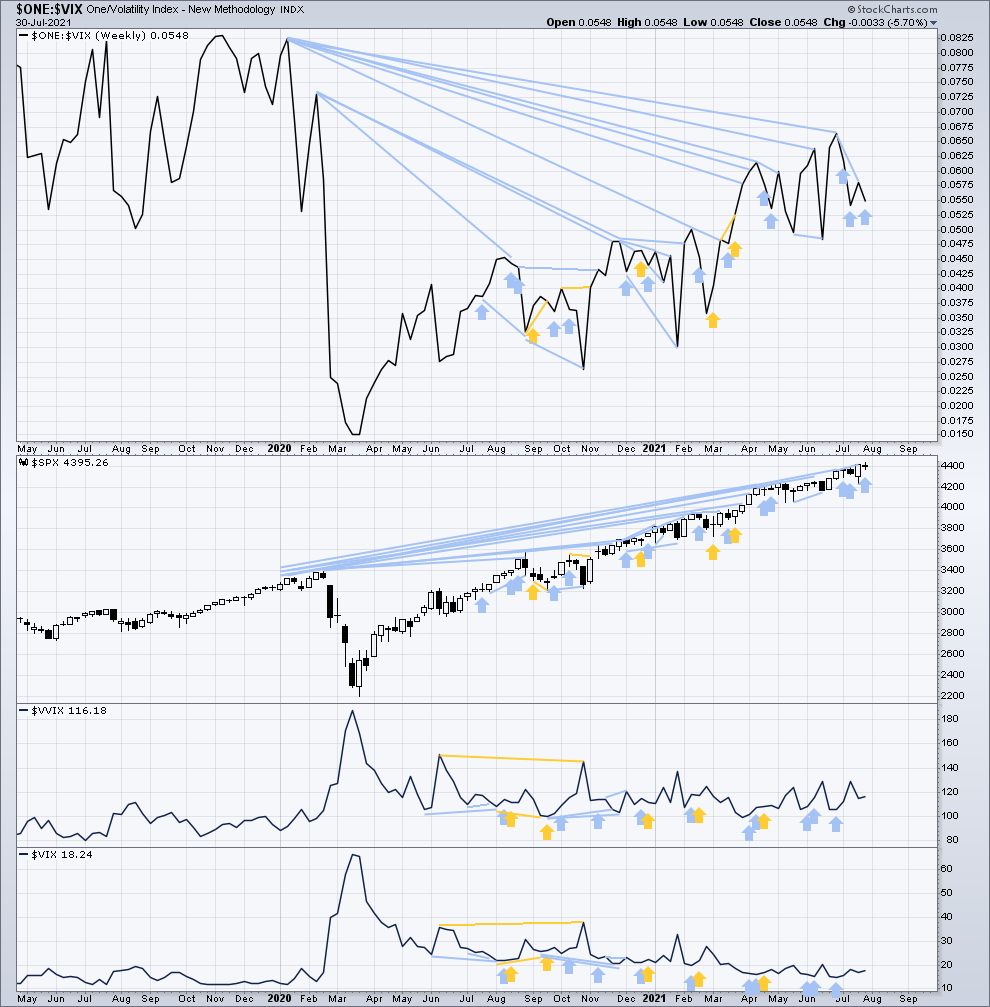
Click chart to enlarge. Chart courtesy of StockCharts.com. So that colour blind members are included, bearish signals will be noted with blue and bullish signals with yellow.
Inverted VIX remains well below all time highs. The all time high for inverted VIX was in the week beginning October 30, 2017. There is over 3 years of bearish divergence between price and inverted VIX. This bearish divergence may develop further before the bull market ends. It may be a very early indicator of an upcoming bear market, but it is not proving to be useful in timing. It may support the third alternate Elliott wave count.
This week price moves higher, but inverted VIX moves lower. This is another single week instance of bearish divergence which adds to the cluster of short and mid-term bearish divergence. This supports either the main or second alternate Elliott wave counts.
Comparing VIX and VVIX at the weekly chart level:
Both have moved higher. There is no new short-term divergence.
DAILY CHART
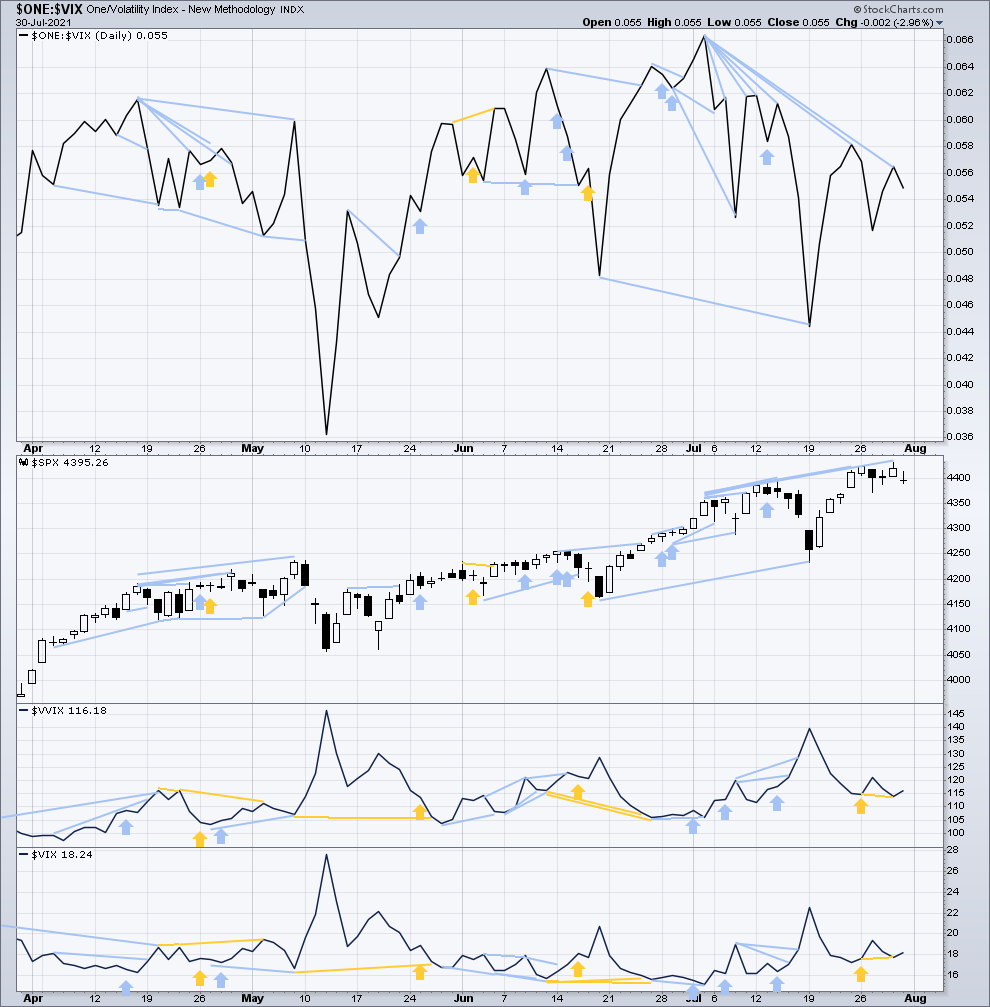
Click chart to enlarge. Chart courtesy of StockCharts.com. So that colour blind members are included, bearish signals will be noted with blue and bullish signals with yellow.
On Friday both inverted VIX and price have moved lower. There is no new short-term divergence. The cluster of bearish short and mid-term divergence remains and supports either the main or second alternate Elliott wave counts.
Comparing VIX and VVIX at the daily chart level:
Both VIX and VVIX have moved higher today. There is no new short-term divergence.
DOW THEORY
Dow Theory confirms a new bull market with new highs made on a closing basis:
DJIA: 29,568.57 – closed above on 16th November 2020.
DJT: 11,623.58 – closed above on 7th October 2020.
Most recently, on 10th May 2021 both DJIA and DJT have made new all time highs. An ongoing bull market is again confirmed by Dow Theory.
Adding in the S&P and Nasdaq for an extended Dow Theory, confirmation of a bull market would require new highs made on a closing basis:
S&P500: 3,393.52 – closed above on 21st August 2020.
Nasdaq: 9,838.37 – closed above on June 8, 2020.
The following major swing lows would need to be seen on a closing basis for Dow Theory to confirm a change from bull to a bear market:
DJIA: 18,213.65
DJT: 6,481.20
Adding in the S&P and Nasdaq for an extended Dow Theory, confirmation of a new bear market would require new lows on a closing basis:
S&P500: 2,191.86
Nasdaq: 6,631.42
GOLD
An inside day on Friday leaves both Elliott wave counts unchanged.
Short-term targets are given for a bounce next week; a short-term price point is indicated, which would indicate the bounce may be over.
Summary: Both the main and alternate Elliott wave counts expect upwards movement to a short-term target at 1,843. Thereafter, a strong downwards wave should move below 1,793.21.
For the short term, a new low below 1,806.79 would expect a high in place and a target would be either at 1,731 or 1,568.
Grand SuperCycle analysis and last monthly charts are here.
MAIN ELLIOTT WAVE COUNT
WEEKLY CHART
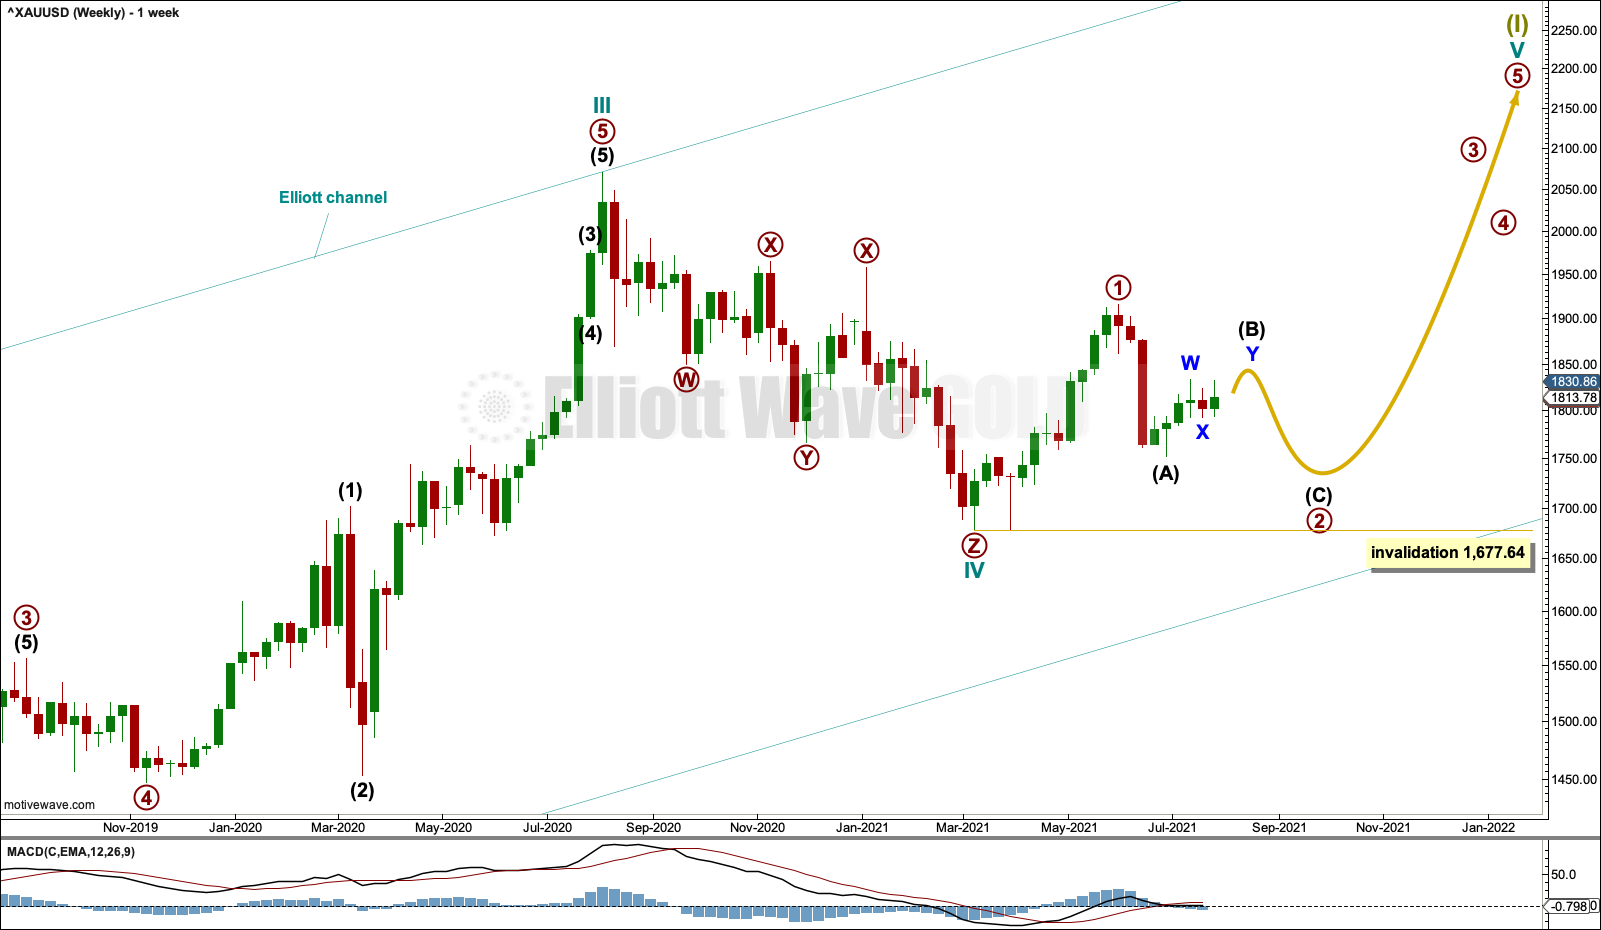
Click chart to enlarge.
This wave count sees the the bear market complete at the last major low for Gold on 3 December 2015.
If Gold is in a new bull market, then it should begin with a five wave structure upwards on the weekly chart.
Cycle wave I fits as a five wave impulse with reasonably proportionate corrections for primary waves 2 and 4.
Cycle wave II fits as a double flat. However, within the first flat correction labelled primary wave W, this wave count needs to ignore what looks like an obvious triangle from July to September 2016 (this can be seen labelled as a triangle on the second weekly chart on prior analysis here). This movement must be labelled as a series of overlapping first and second waves. Ignoring this triangle reduces the probability of this wave count in Elliott wave terms.
Double flats are fairly rare structures. The probability of this wave count is further reduced.
Cycle wave IV may be a complete triple zigzag. Triple zigzags are not rare structures, but they are not common. The probability of this wave count is further reduced in Elliott wave terms. This is one reason why an alternate is still considered.
Cycle wave V may have begun. Within cycle wave V: Primary wave 1 may be over at the last high, and primary wave 2 may not move beyond the start of primary wave 1 below 1,677.64.
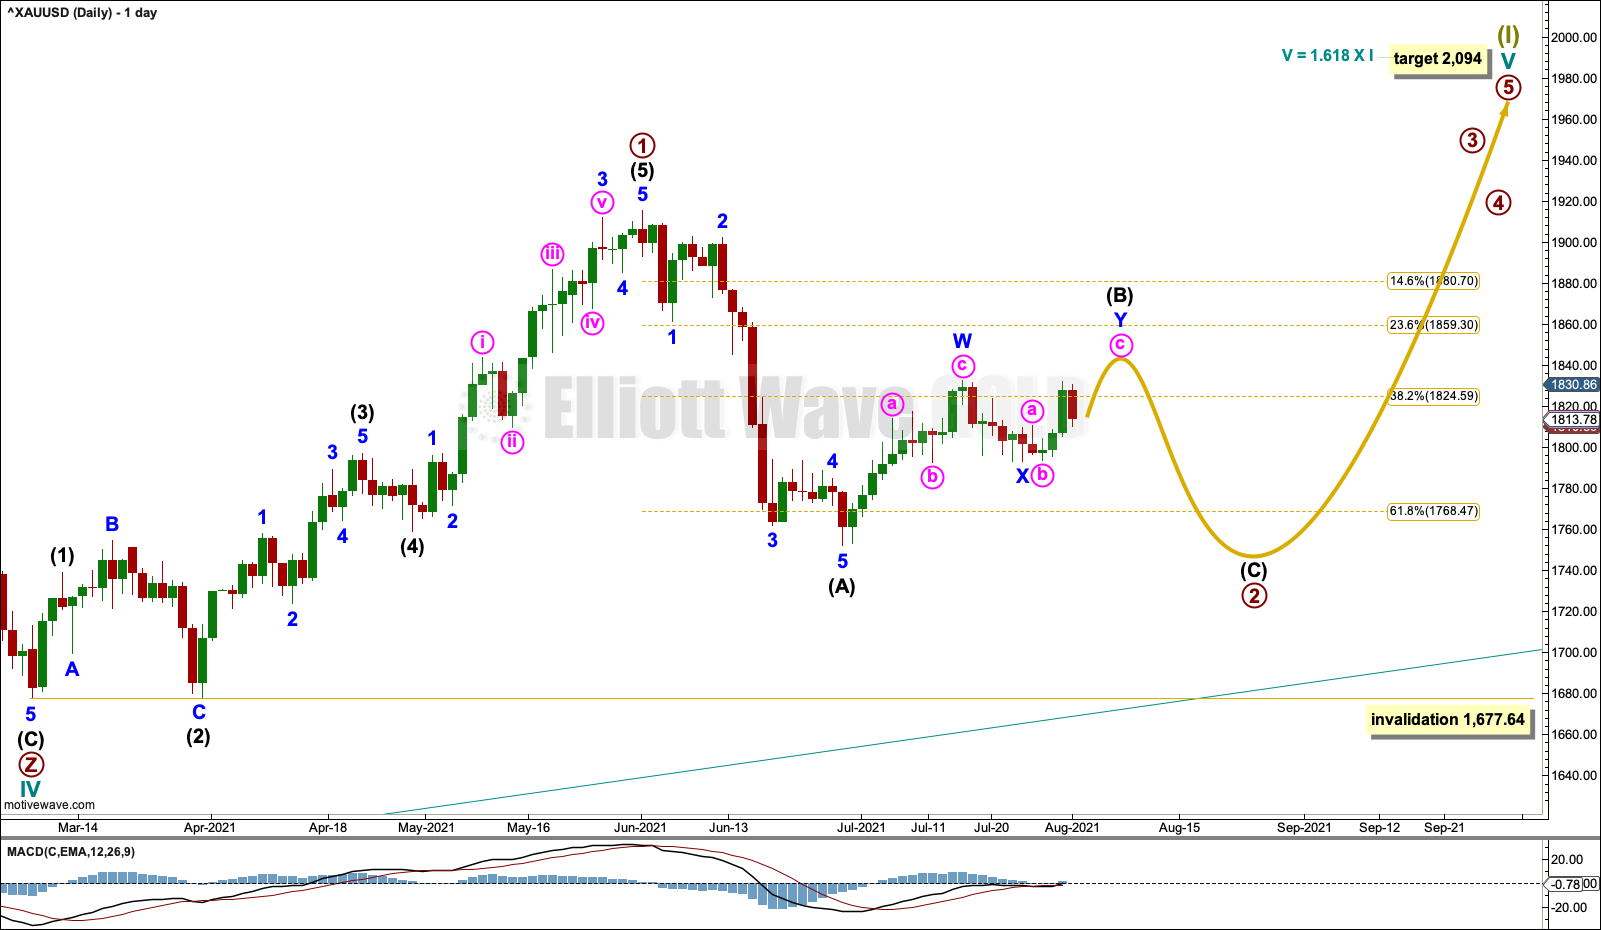
DAILY CHART
Click chart to enlarge.
A target is calculated for cycle wave V. If this target is wrong for this wave count, then it may be too low. As price approaches the target, if the structure is incomplete, then a higher target may be calculated.
Primary wave 1 within cycle wave V may be complete.
Primary wave 2 may be an incomplete zigzag. Intermediate wave (B) within primary wave 2 may be continuing higher as a double zigzag.
When intermediate wave (B) may be complete, then intermediate wave (C) should make at least a slight new low below the end of intermediate wave (A) at 1,752.19 to avoid a truncation. When intermediate wave (B) may be complete, then a target can be calculated for intermediate wave (C).
Primary wave 2 may not move beyond the start of primary wave 1 below 1,677.64.
For the short term, a new low below 1,806.79 would see intermediate wave (B) labelled over at the last high and intermediate wave (C) down would have a target at 1,731.
ALTERNATE ELLIOTT WAVE COUNT
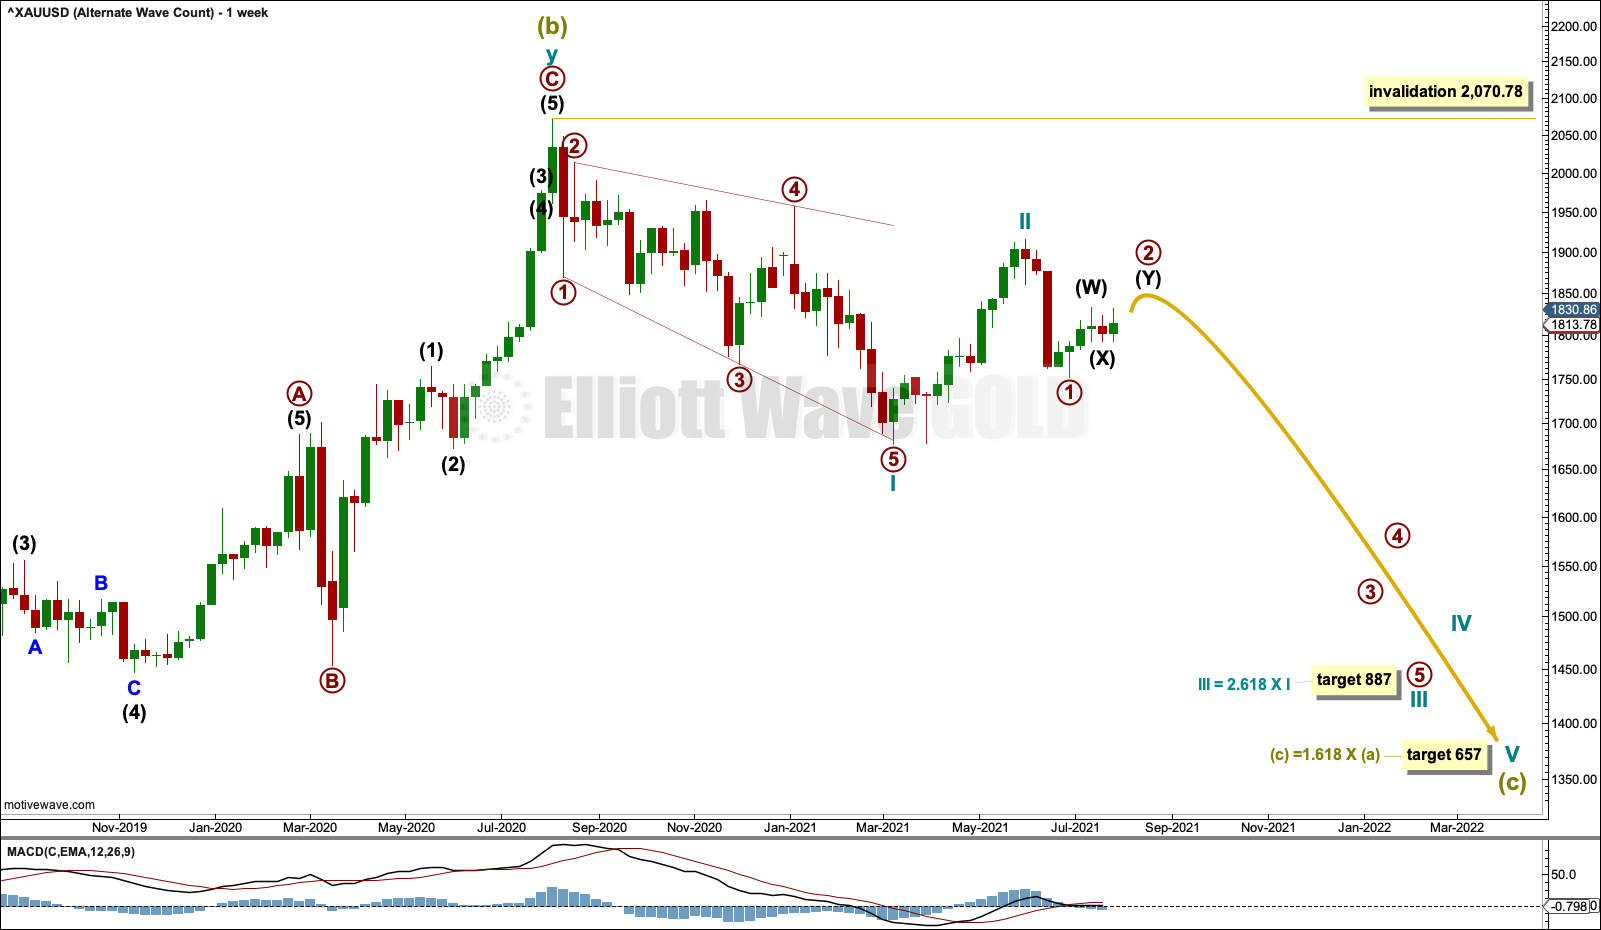
WEEKLY CHART
Click chart to enlarge.
The bigger picture for this alternate Elliott wave count sees Gold as within a bear market, in a three steps back pattern that is labelled Grand Super Cycle wave IV on monthly charts. Grand Super Cycle wave IV may be subdividing as an expanded flat pattern.
Super Cycle wave (b) within Grand Super Cycle wave IV may be a complete double zigzag. This wave count expects Super Cycle wave (c) to move price below the end of Super Cycle wave (a) at 1,046.27 to avoid a truncation and a very rare running flat. The target calculated expects a common Fibonacci ratio for Super Cycle wave (c).
Super Cycle wave (c) may have begun with a leading expanding diagonal for cycle wave I. Leading expanding diagonals in first wave positions are uncommon, so the probability of this wave count is reduced. However, it has a good fit and must be considered.
Second wave corrections to follow leading diagonals in first wave positions are usually very deep. Cycle wave II is deep and the structure may be complete; so far it is following a common pattern. If it continues higher, then cycle wave II may not move beyond the start of cycle wave I above 2,070.78.
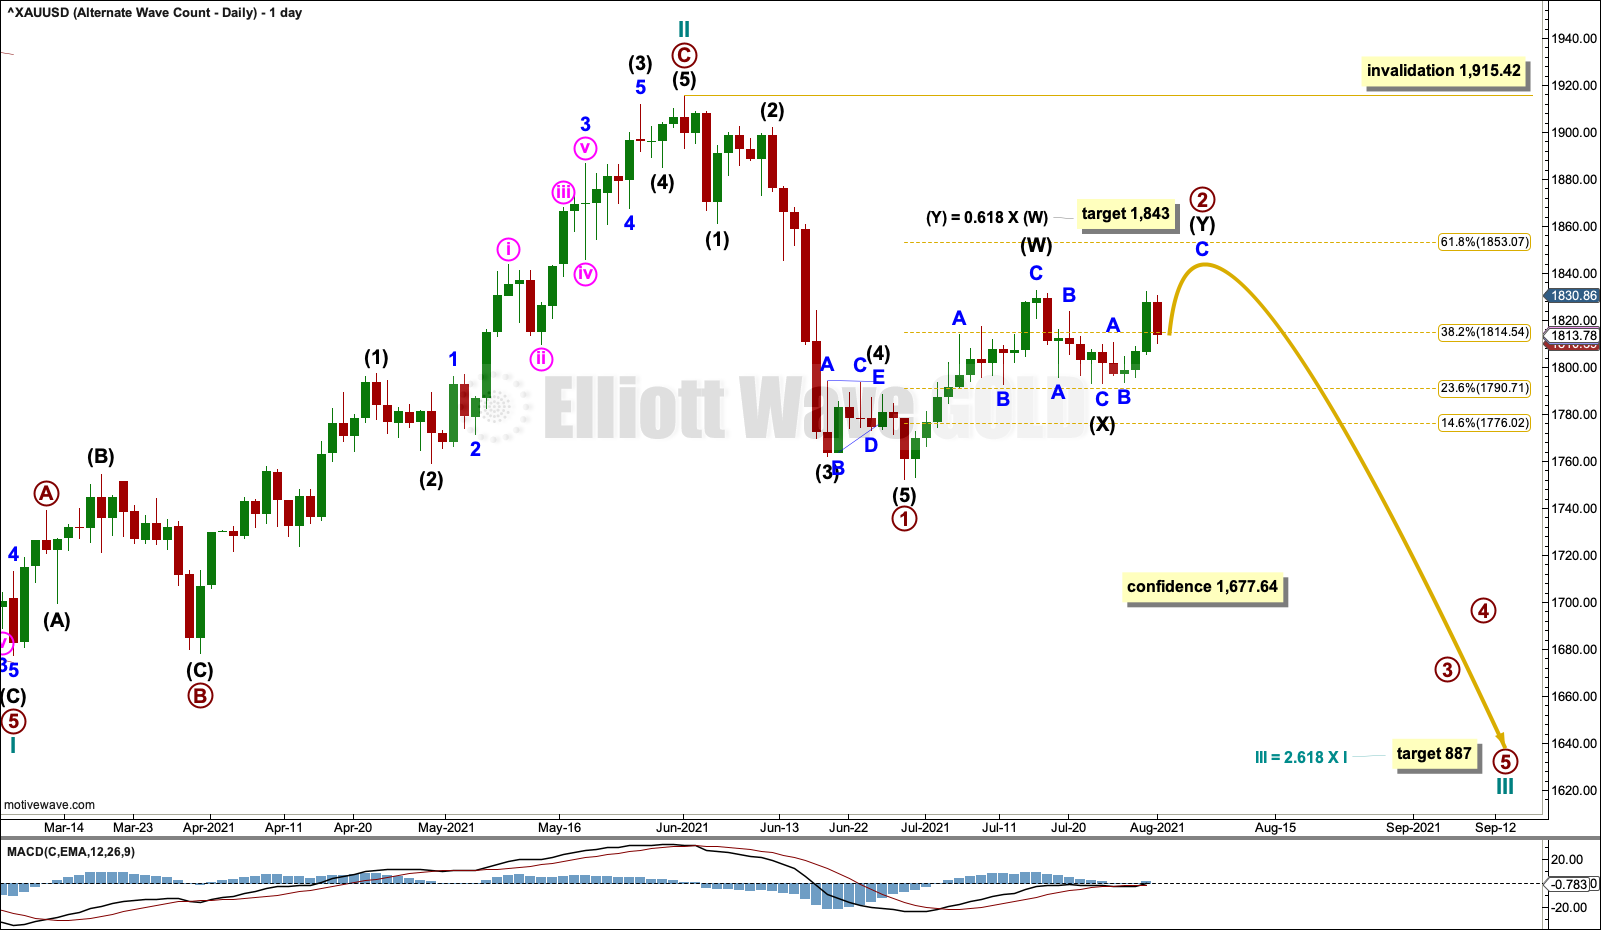
DAILY CHART
Click chart to enlarge.
A target is calculated for cycle wave III.
Primary wave 2 may be completing as a double zigzag. The first zigzag in the double may be complete, labelled intermediate wave (W). The double may be joined by a three in the opposite direction, labelled intermediate wave (X). The second zigzag in the double may now be underway, labelled intermediate wave (Y).
The purpose of a second zigzag in a double is to deepen a correction. To achieve this purpose the second zigzag usually moves beyond the end of the first. Intermediate wave (Y) may be expected to end reasonably above the end of intermediate wave (W).
A target is calculated for primary wave 2 to end.
Primary wave 2 may not move beyond the start of primary wave 1 above 1,915.42.
For the short term, a new low below 1,806.79 would see primary wave 2 labelled over at the last high and a target for primary wave 3 would be at 1,568.
TECHNICAL ANALYSIS
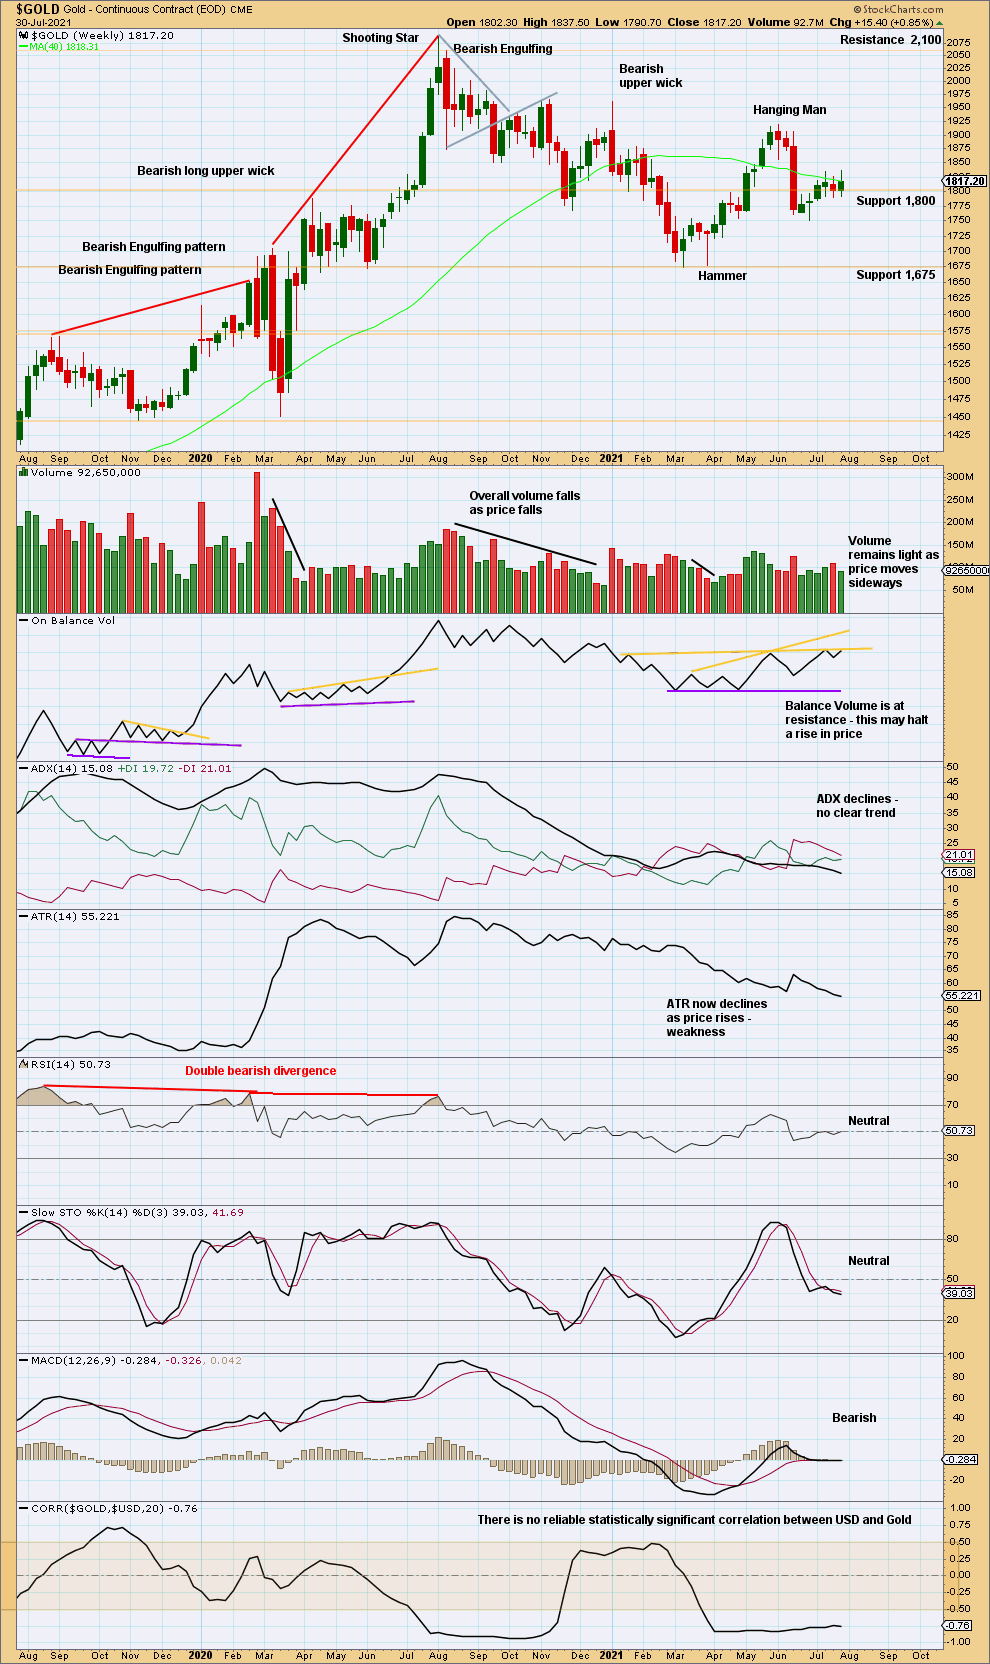
WEEKLY CHART
Click chart to enlarge. Chart courtesy of StockCharts.com.
For recent weeks, volume has been strongest in the last downwards week. This is slightly bearish.
Price has not been able to break below and remain below support about 1,800. On Balance Volume suggests upwards movement here is limited.
DAILY CHART
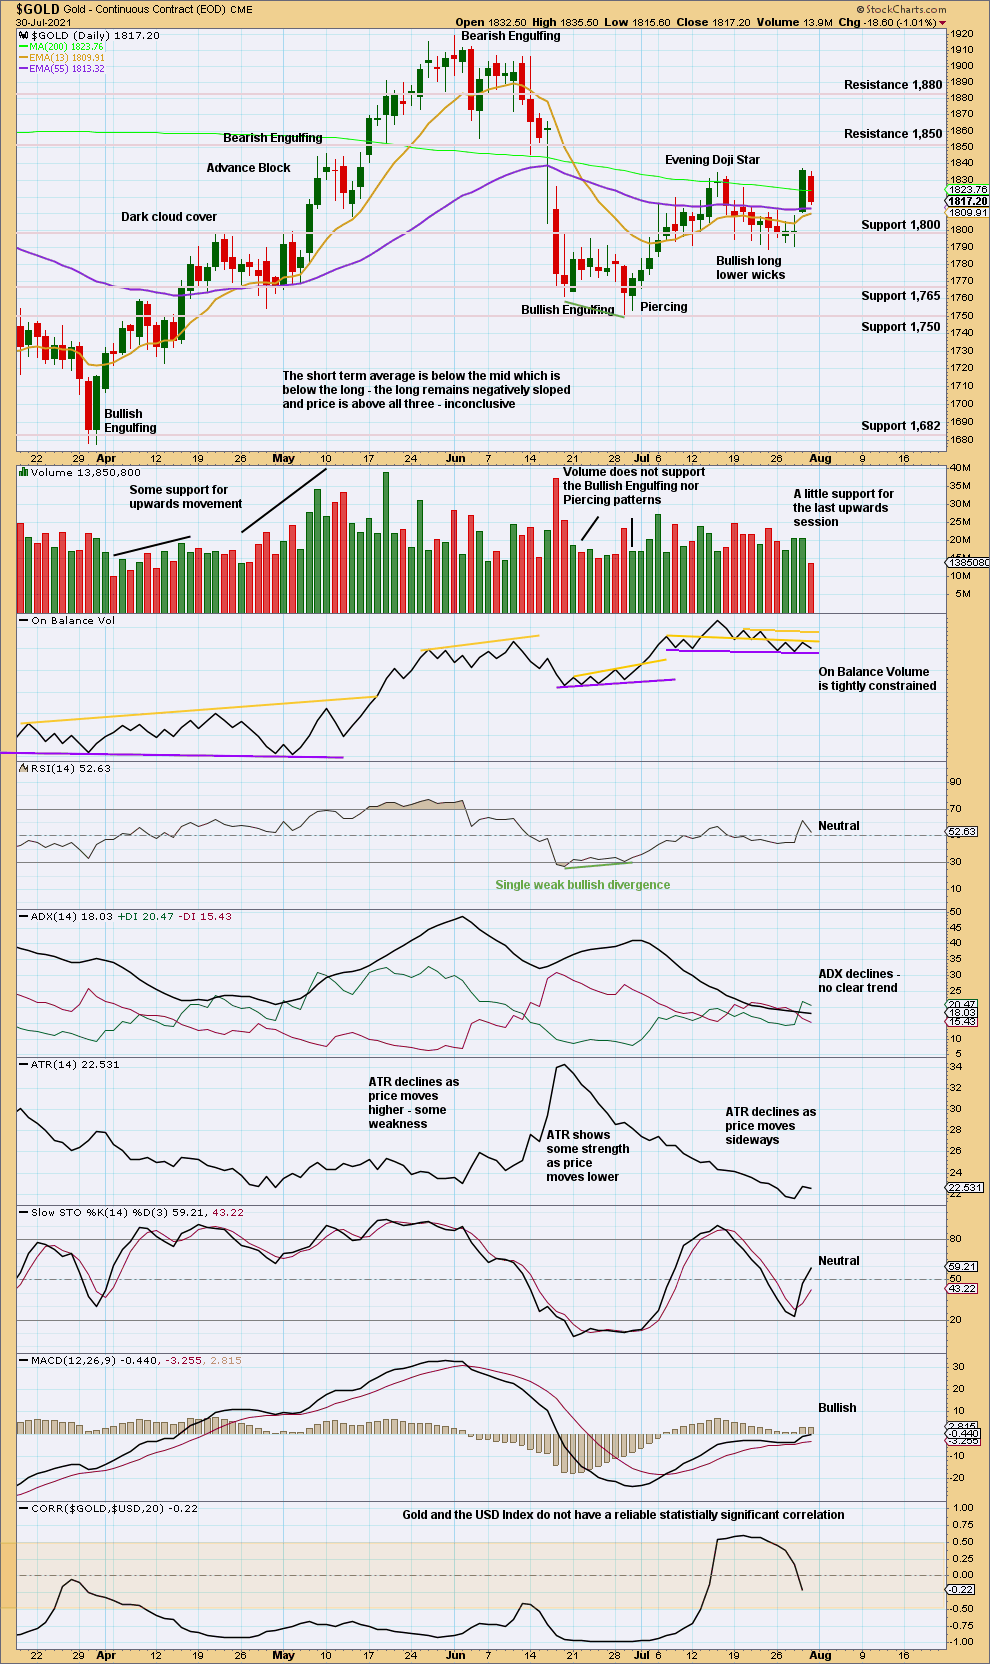
Click chart to enlarge. Chart courtesy of StockCharts.com.
Price is nearing resistance. On Balance Volume is at weak resistance. ADX indicates no trend, but Stochastics is still well within neutral territory. Expect an upwards swing to continue until price is at resistance and Stochastics reaches overbought. Next resistance is about 1,850.
GDX WEEKLY CHART
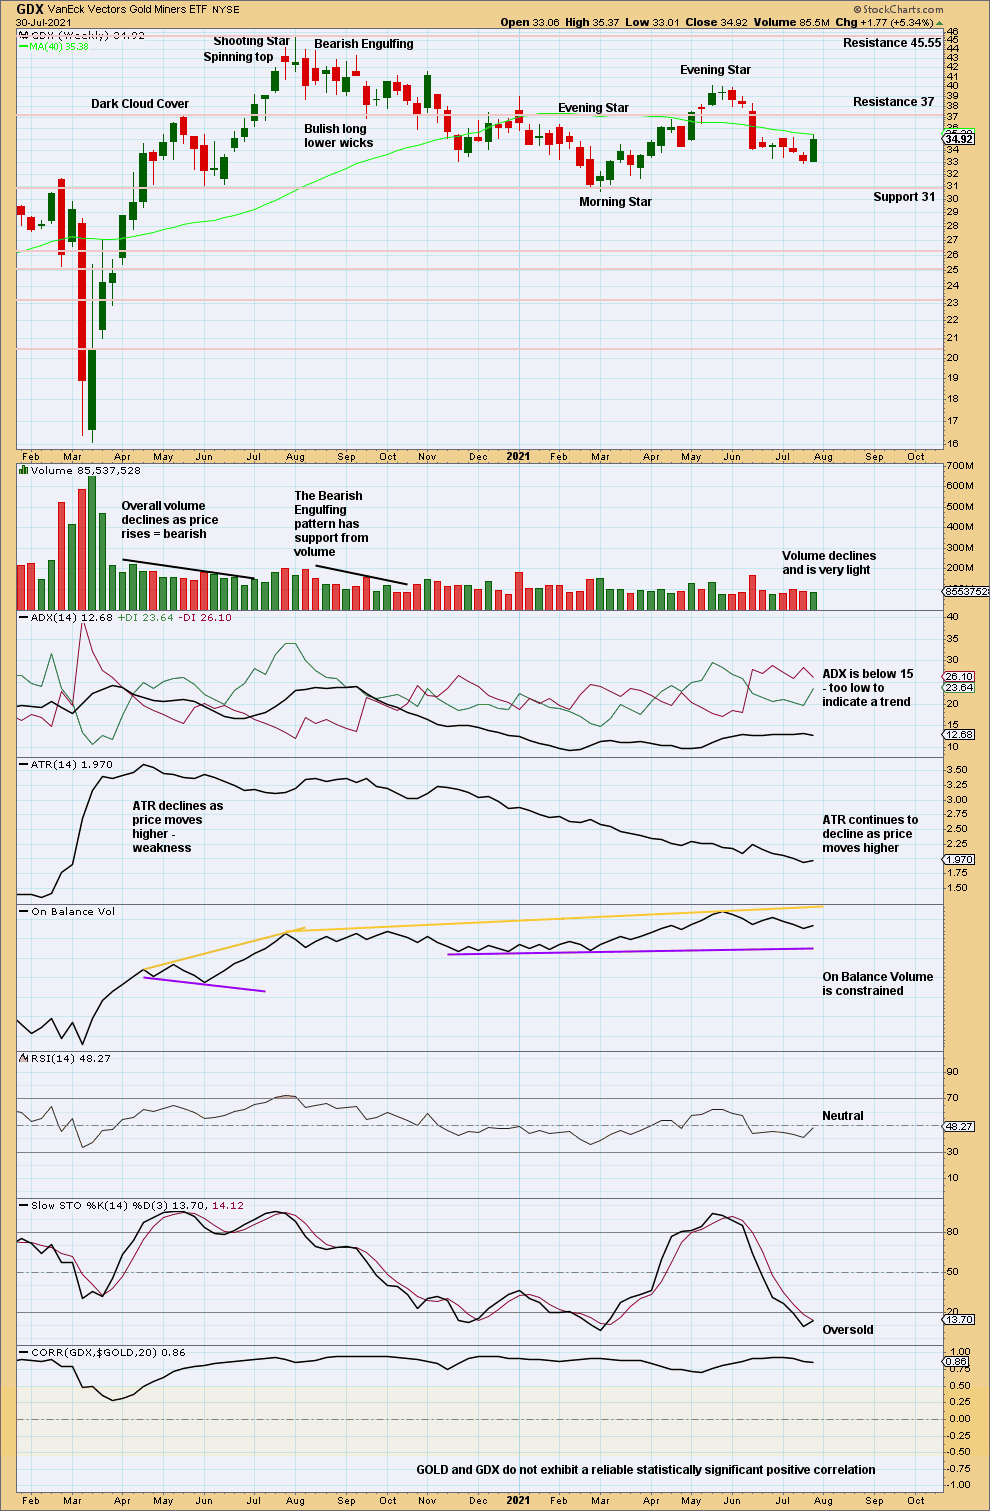
Click chart to enlarge. Chart courtesy of StockCharts.com.
Stochastics reached oversold in the last downwards swing, but price did not quite reach support. Now an upwards week suggests an upwards swing may continue until price reaches resistance and Stochastics reaches overbought.
GDX DAILY CHART
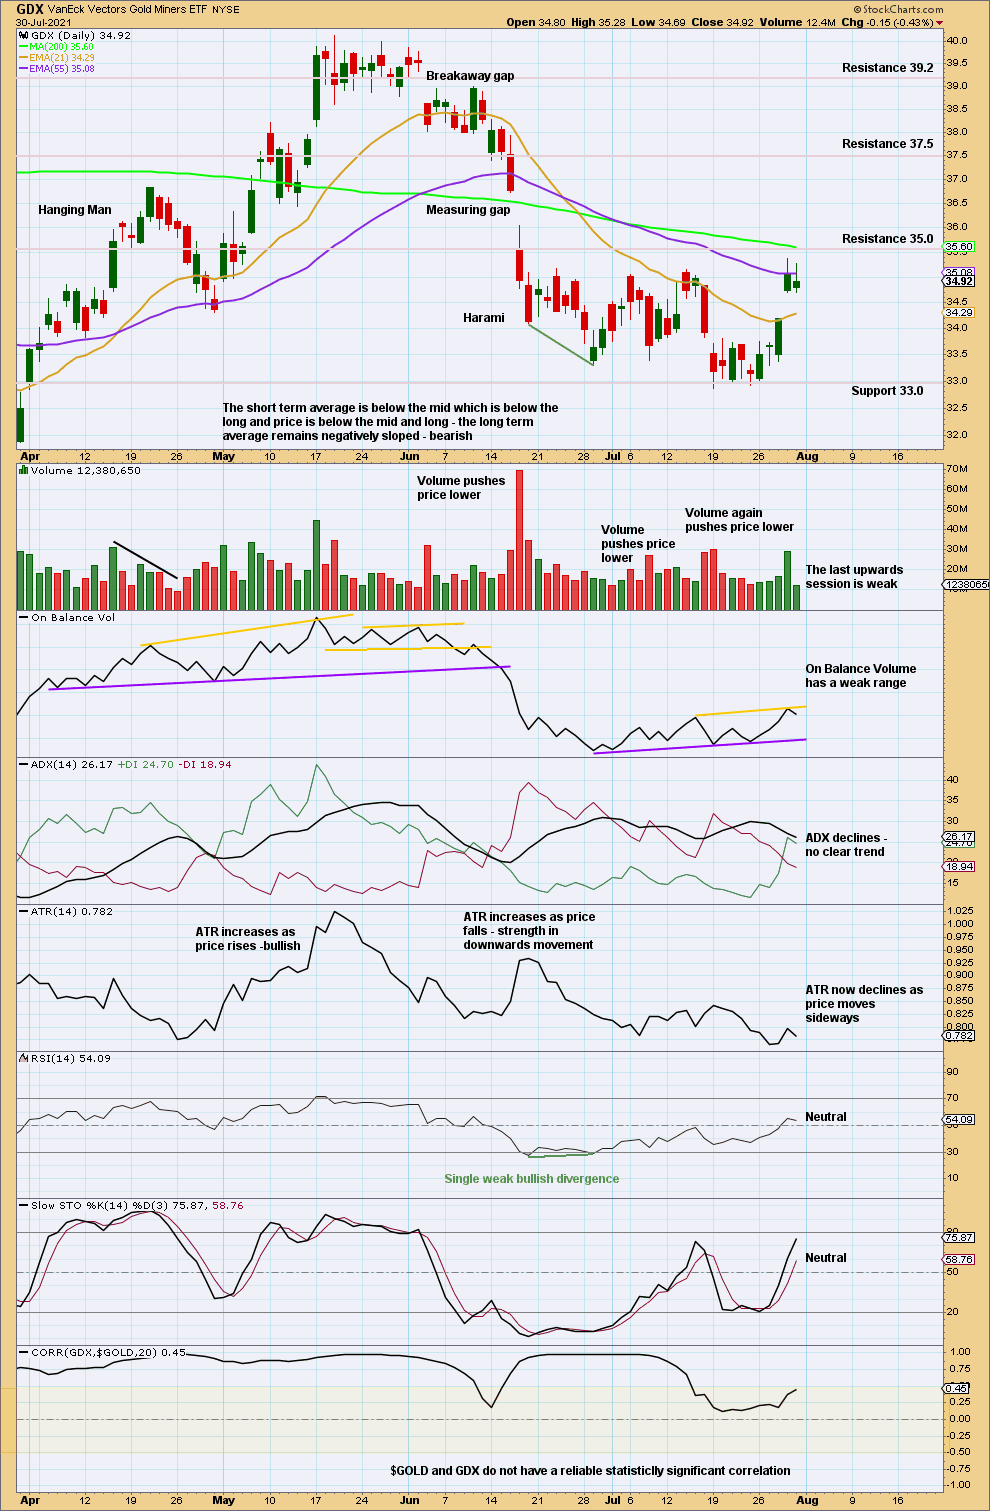
Click chart to enlarge. Chart courtesy of StockCharts.com.
Price is consolidating with resistance about 35 and support about 33.0. A breakout is required before confidence in the next direction may be had.
An upwards swing within the consolidation is now underway. Price is now very close to resistance at 35 and Stochastics is close to overbought. The upwards swing may end soon.
US OIL
Last week’s Elliott wave and technical analysis expected upwards movement to resume for US Oil. This week price has moved higher as expected.
Summary: The main Elliott wave count expects upwards movement to resume to the next target at 112.79.
An alternate Elliott wave count allows for more downwards movement to end at support at the lower edge of a channel on the daily chart.
Oil may have found a major sustainable low in April 2020.
ELLIOTT WAVE COUNT
MONTHLY CHART
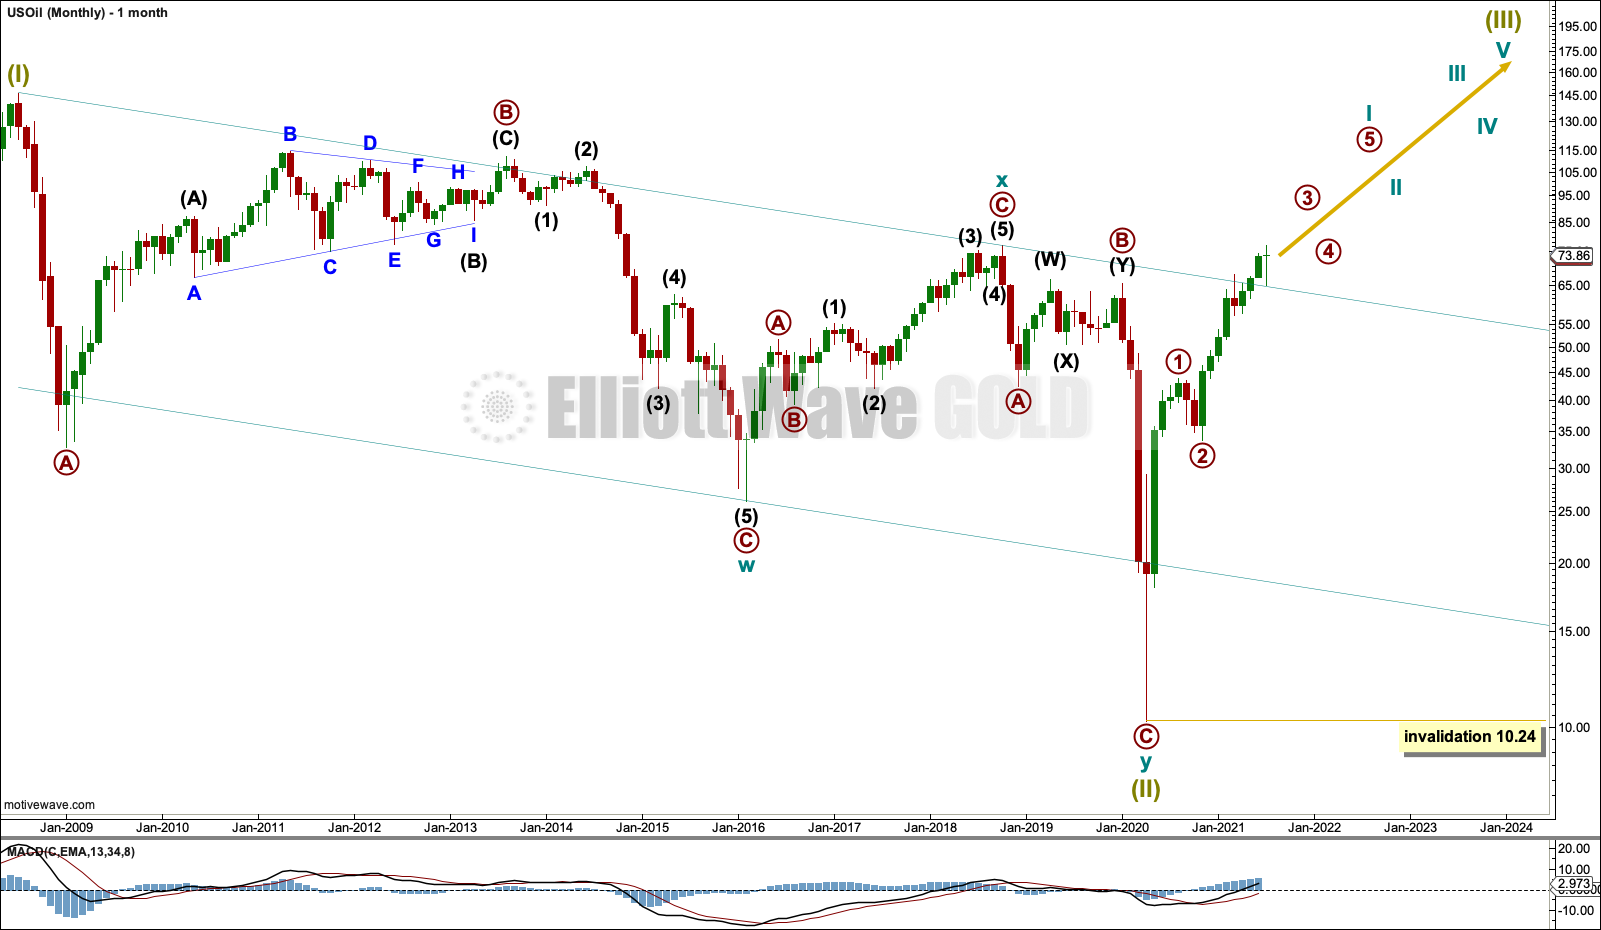
Click chart to enlarge.
The basic Elliott wave structure is five steps forward and three steps back. This Elliott wave count expects that US Oil has completed a three steps back pattern, which began in July 2008. The Elliott wave count expects that the bear market for US Oil may now be over.
Following Super Cycle wave (II), which was a correction (three steps back), Super Cycle wave (III), which may have begun, should be five steps up when complete. Super Cycle wave (III) may last a generation and must make a new high above the end of Super Cycle wave (I) at 146.73.
A channel is drawn about Super Cycle wave (II): draw the first trend line from the start of cycle wave w to the end of cycle wave x, then place a parallel copy on the end of cycle wave w. This trend line is breached to the downside, which is a typical look for the end of a movement for a commodity.
The upper edge of the channel has now been breached by upwards movement. This trend line may now have provided support for the last pullback.
A new high above the high at 76.90 from October 2018 has been made. This is a significant new high and was expected from this wave count. Further confidence in a bull market for Oil may be had.
Super Cycle wave (III) may only subdivide as a five wave impulse. New trends for Oil usually start out very slowly with short first waves and deep time consuming second wave corrections. However, while this is a common tendency, it is not always seen and may not have been seen in this instance. The first reasonably sized pullback may be over already.
WEEKLY CHART
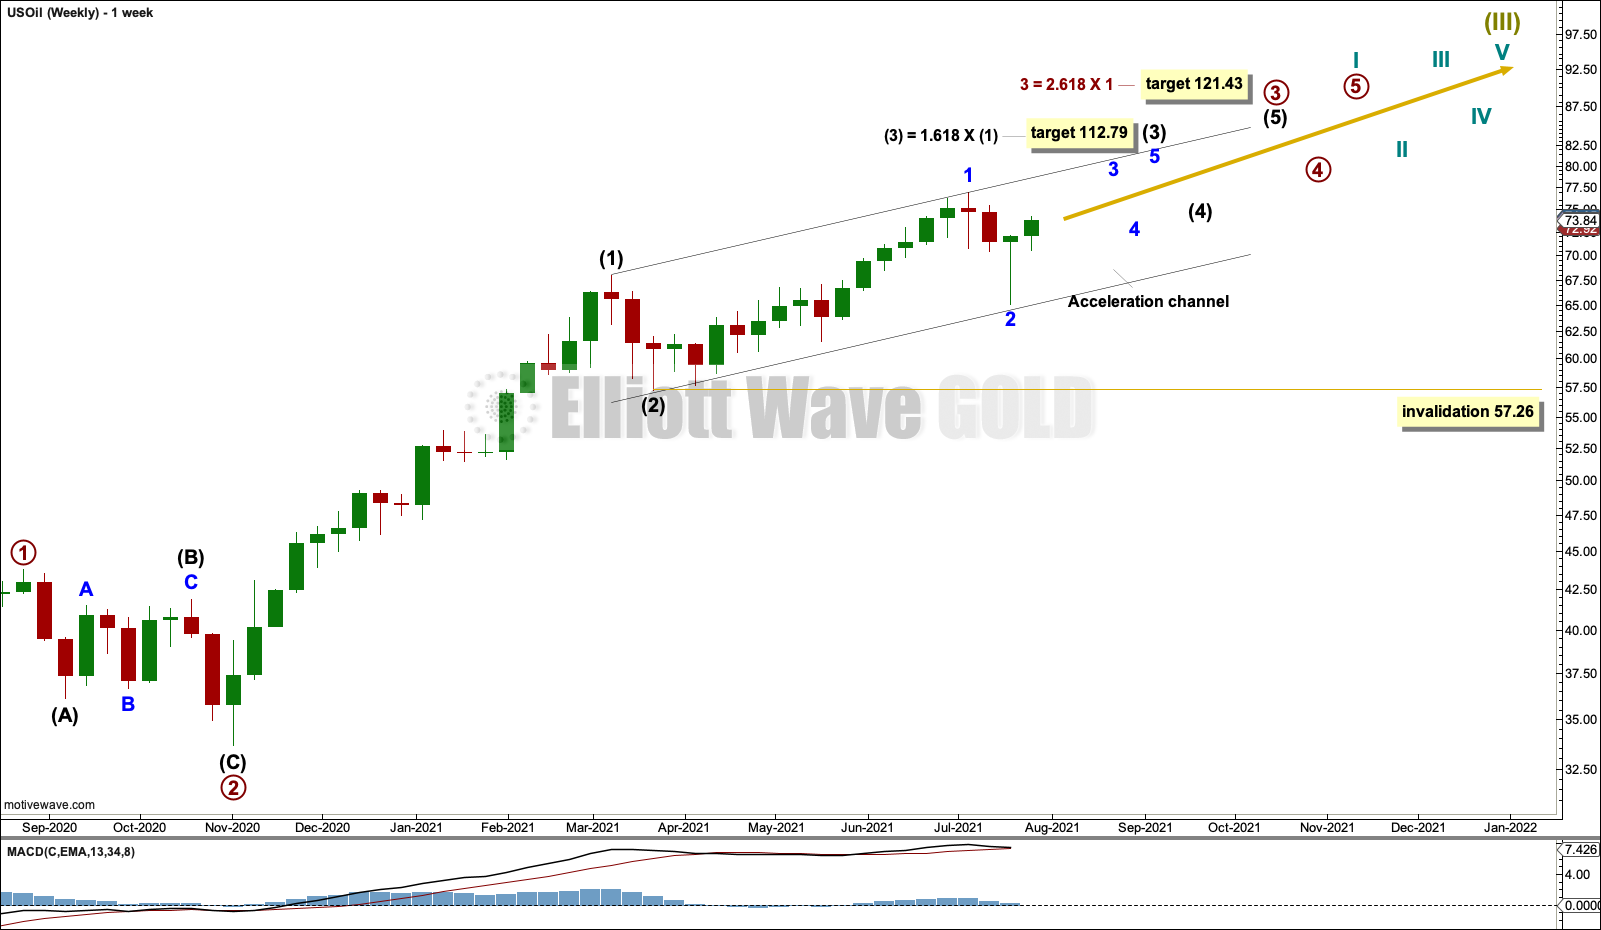
Click chart to enlarge.
Super Cycle wave (III) must subdivide as an impulse.
Cycle wave I within Super Cycle wave (III) may be incomplete.
Within cycle wave I: Primary waves 1 and 2 may be complete, and primary wave 3 may only subdivide as an impulse.
Intermediate waves (1) and (2) within primary wave 3 may be complete. Minor wave 2 within intermediate wave (3) may not move beyond the start or minor wave 1 below 57.26.
DAILY CHART
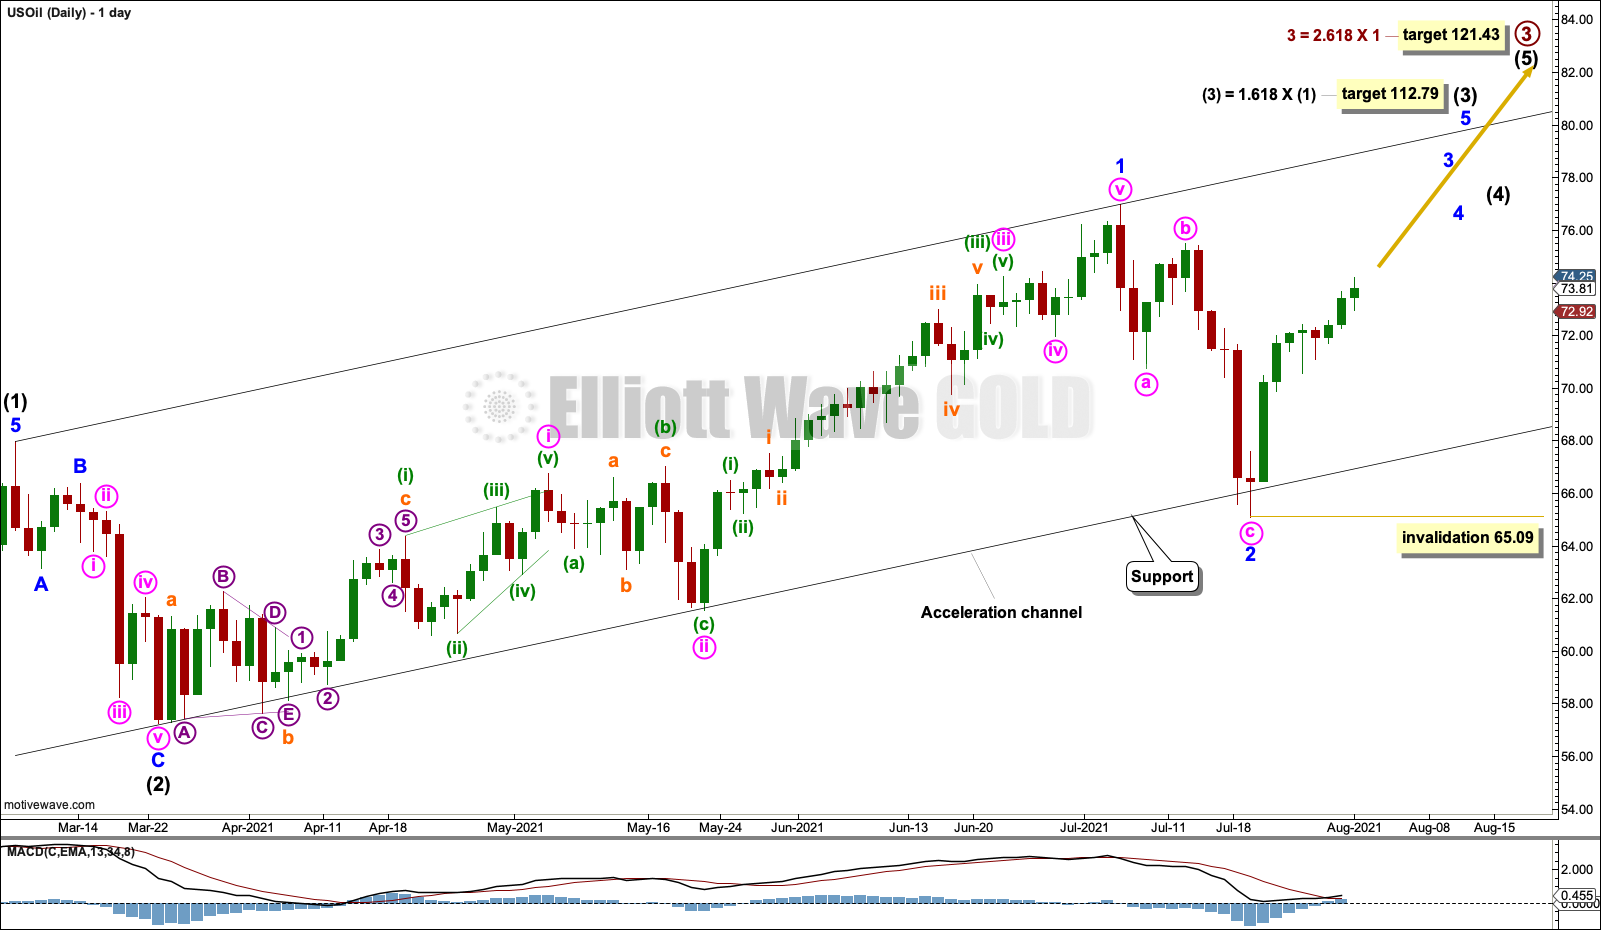
Click chart to enlarge.
Minor wave 1 within intermediate wave (3) may be complete at the last high. The last pullback may be minor wave 2. Minor wave 2 may have ended about support at the lower edge of the acceleration channel.
Minor wave 3 may only subdivide as an impulse. Within the impulse, its second wave correction may not move beyond the start of its first wave below 65.09.
This wave count is very bullish. It expects a third wave at minor, intermediate and primary degree may have just begun. An increase in upwards momentum would be expected.
ALTERNATE WEEKLY CHART
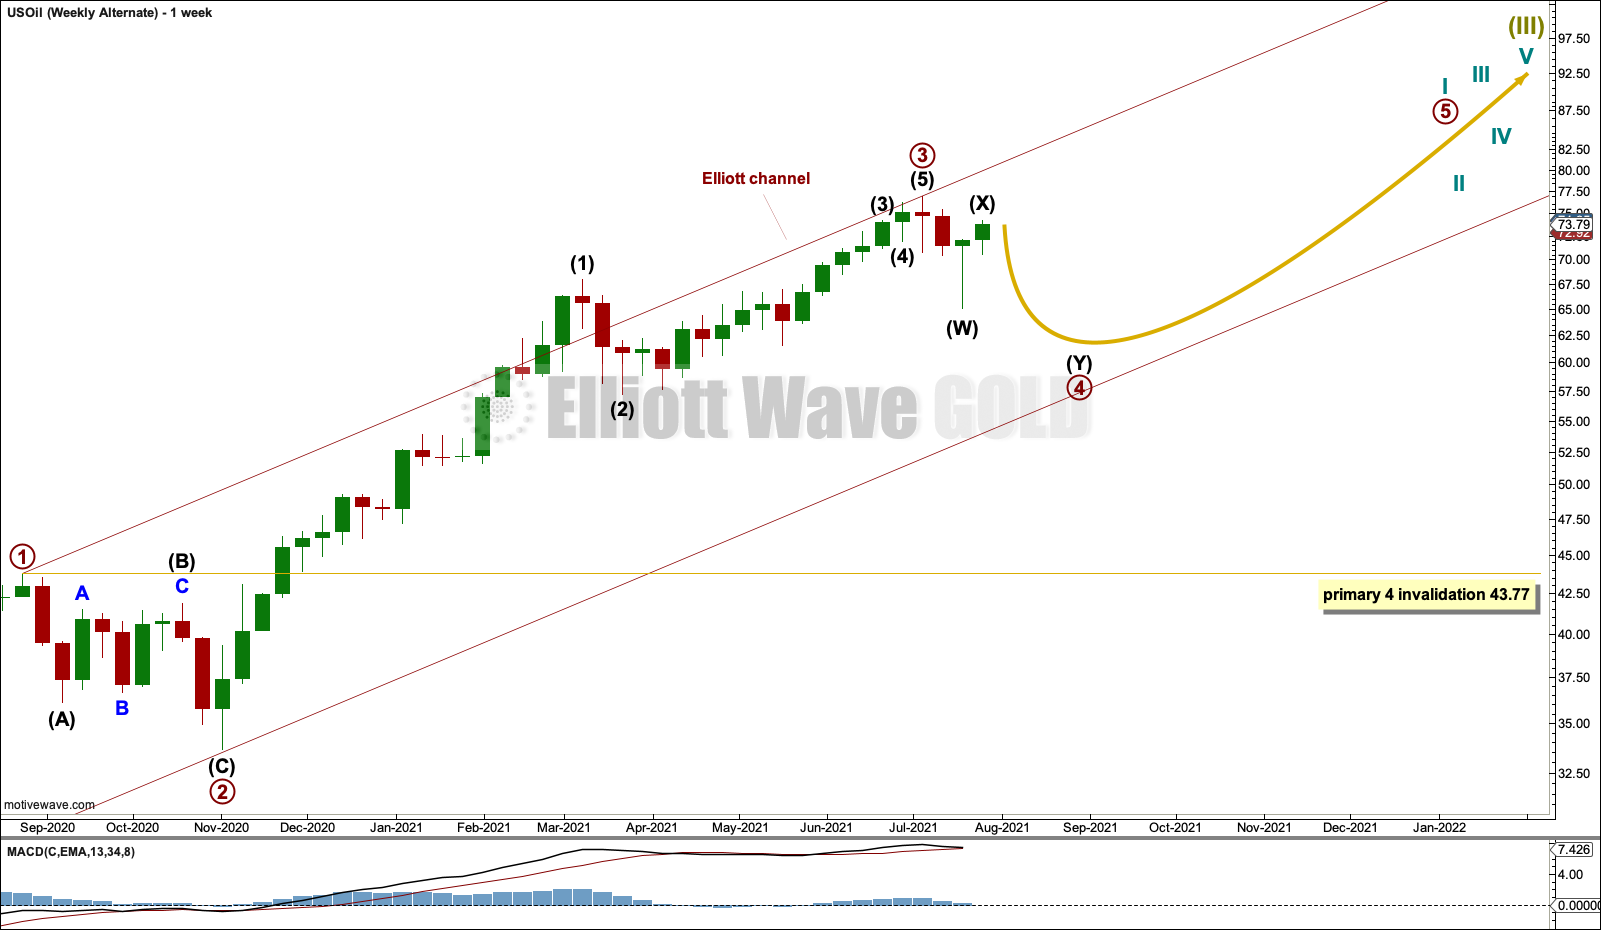
Click chart to enlarge.
It is possible that primary waves 1, 2 and 3 within cycle wave I are complete. If primary wave 3 was complete at the last high, then the last pullback may have been the start of primary wave 4.
Primary wave 3 exhibits no Fibonacci ratio to primary wave 1. Primary wave 3 at 43.32 is longer than primary wave 1, which was 33.53.
Primary wave 2 lasted 10 weeks and subdivided as a single zigzag. Primary wave 4 may subdivide as any Elliott wave structure; so far it will be labelled as a possible double zigzag, but this labelling may need to change as it unfolds.
Primary wave 4 should last a few more weeks to be in better proportion to primary wave 2. Primary wave 4 may not move into primary wave 1 price territory below 43.77.
Draw an Elliott channel about the impulse. Draw the first trend line from the ends of primary waves 1 to 3, then place a parallel copy on the end of primary wave 2. Primary wave 4 may find support about the lower edge of this channel.
ALTERNATE DAILY CHART
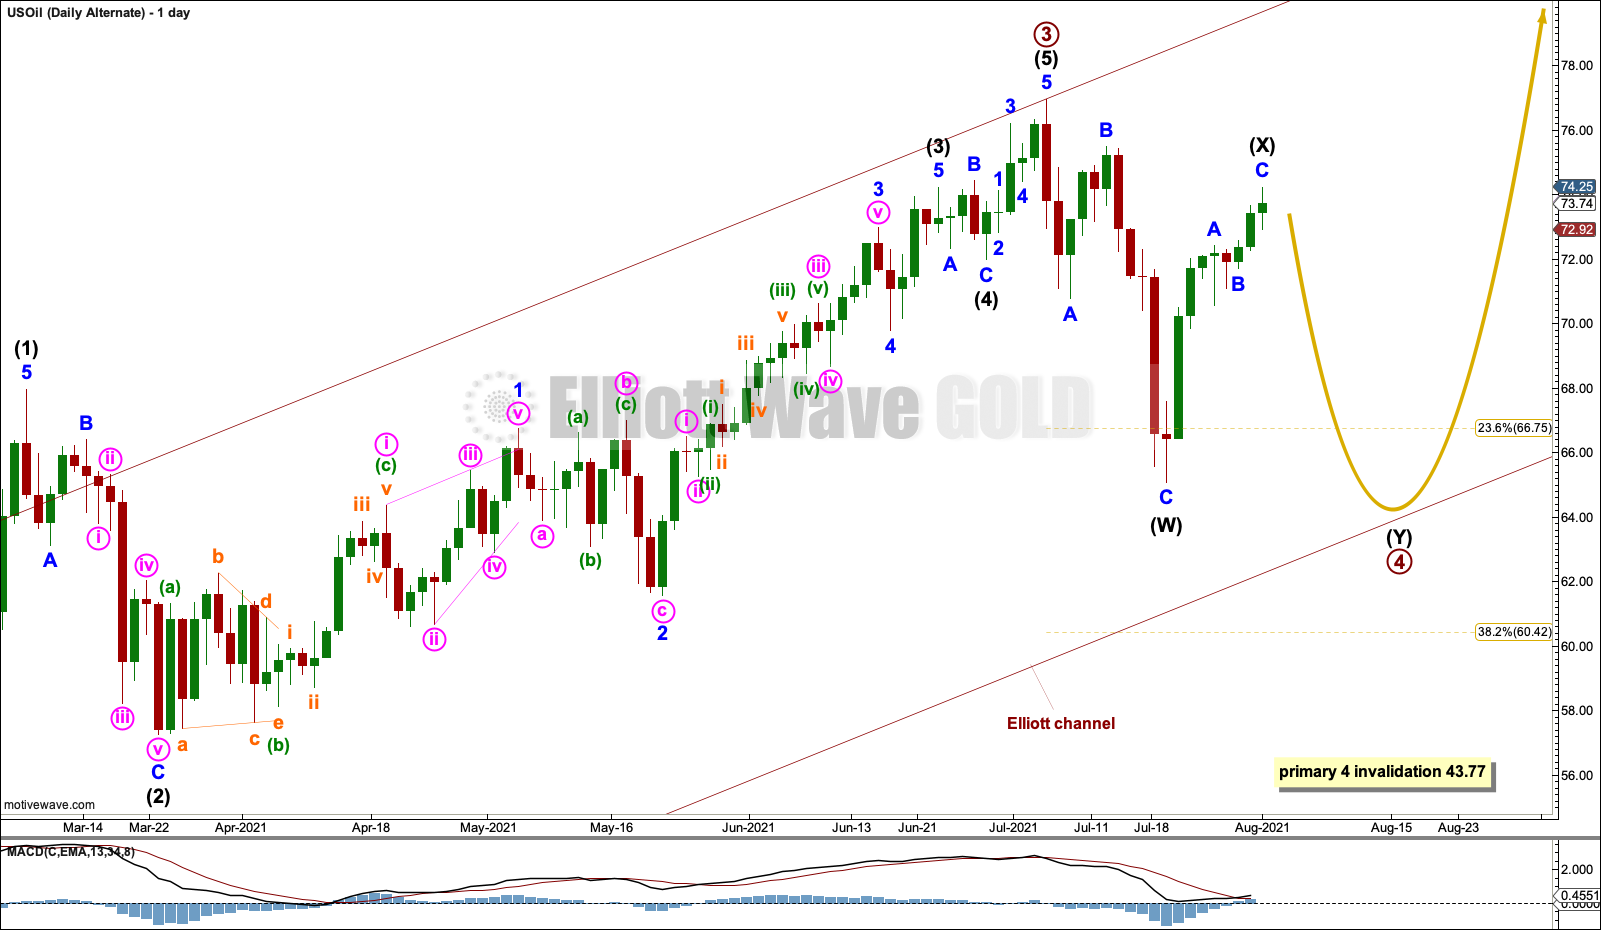
Click chart to enlarge.
Primary wave 4 may unfold as any one of more than 23 possible corrective Elliott wave structures. So far it will be labelled as a possible double zigzag to move lower to find support about the lower edge of the Elliott channel, but it may also continue sideways as a combination, flat or triangle.
It would be most likely that primary wave 4 would not be over at the last low. It would look too brief in comparison to primary wave 2.
TECHNICAL ANALYSIS
MONTHLY CHART
Click chart to enlarge. Chart courtesy of StockCharts.com.
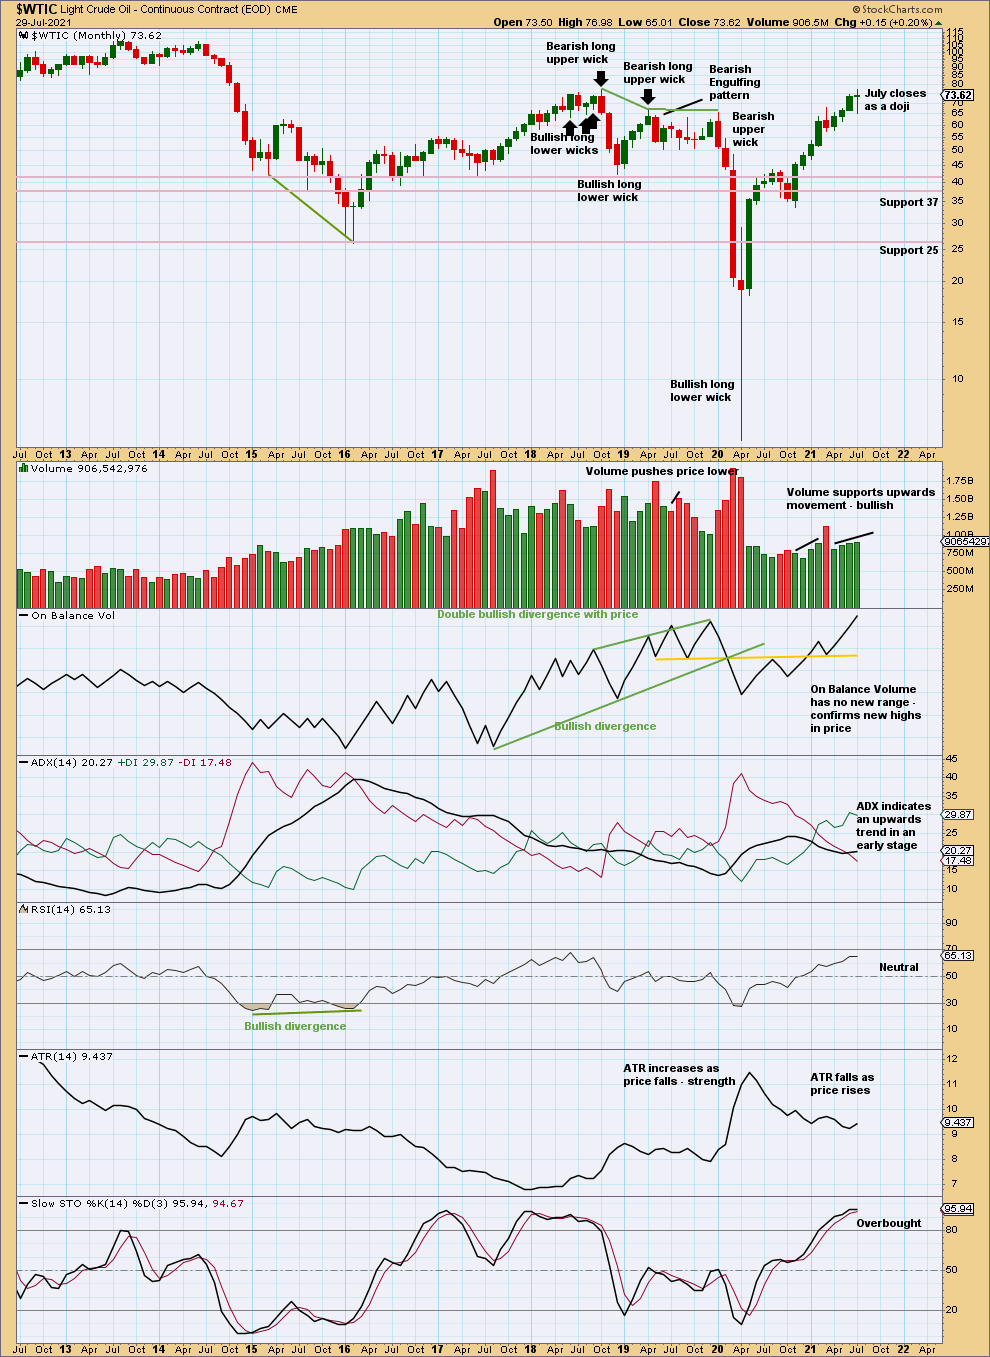
It is time to step back and look at the monthly chart.
There is an upwards trend with room to continue; RSI is not yet overbought and volume supports the trend.
Closure of July as a doji is bearish for the short term, so a pullback may result. Doji in upwards trends are slightly bearish, but on their own are not reversal signals. The doji signals caution.
WEEKLY CHART
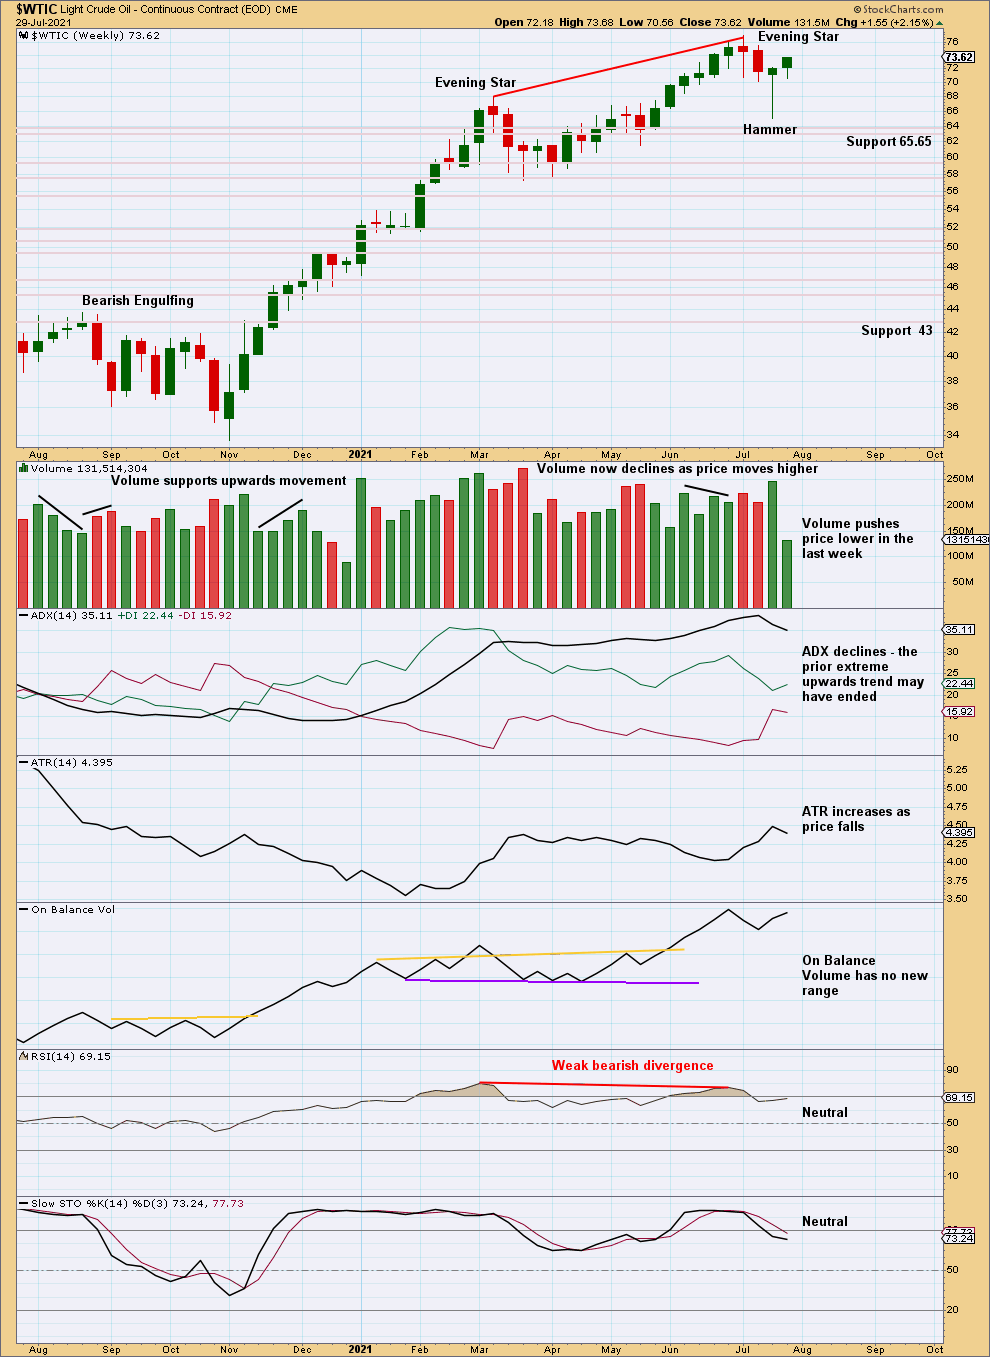
Click chart to enlarge. Chart courtesy of StockCharts.com.
At the last high, there was bearish divergence between price and RSI, ADX had reached extreme, and a bearish candlestick pattern in an Evening Star developed. Given these extreme conditions, some further pullback or consolidation may continue here to relieve extreme conditions to set up for the trend to continue. This favours the alternate Elliott wave count.
For the short term, a Hammer candlestick pattern suggests the pullback may be over; this favours the main Elliott wave count. When this market has a strong trend, then extreme conditions may be sustained for a reasonable period of time while price moves a great distance.
Volume for the final week (not shown on this chart) supports upwards movement, which favours the main Elliott wave count.
DAILY CHART
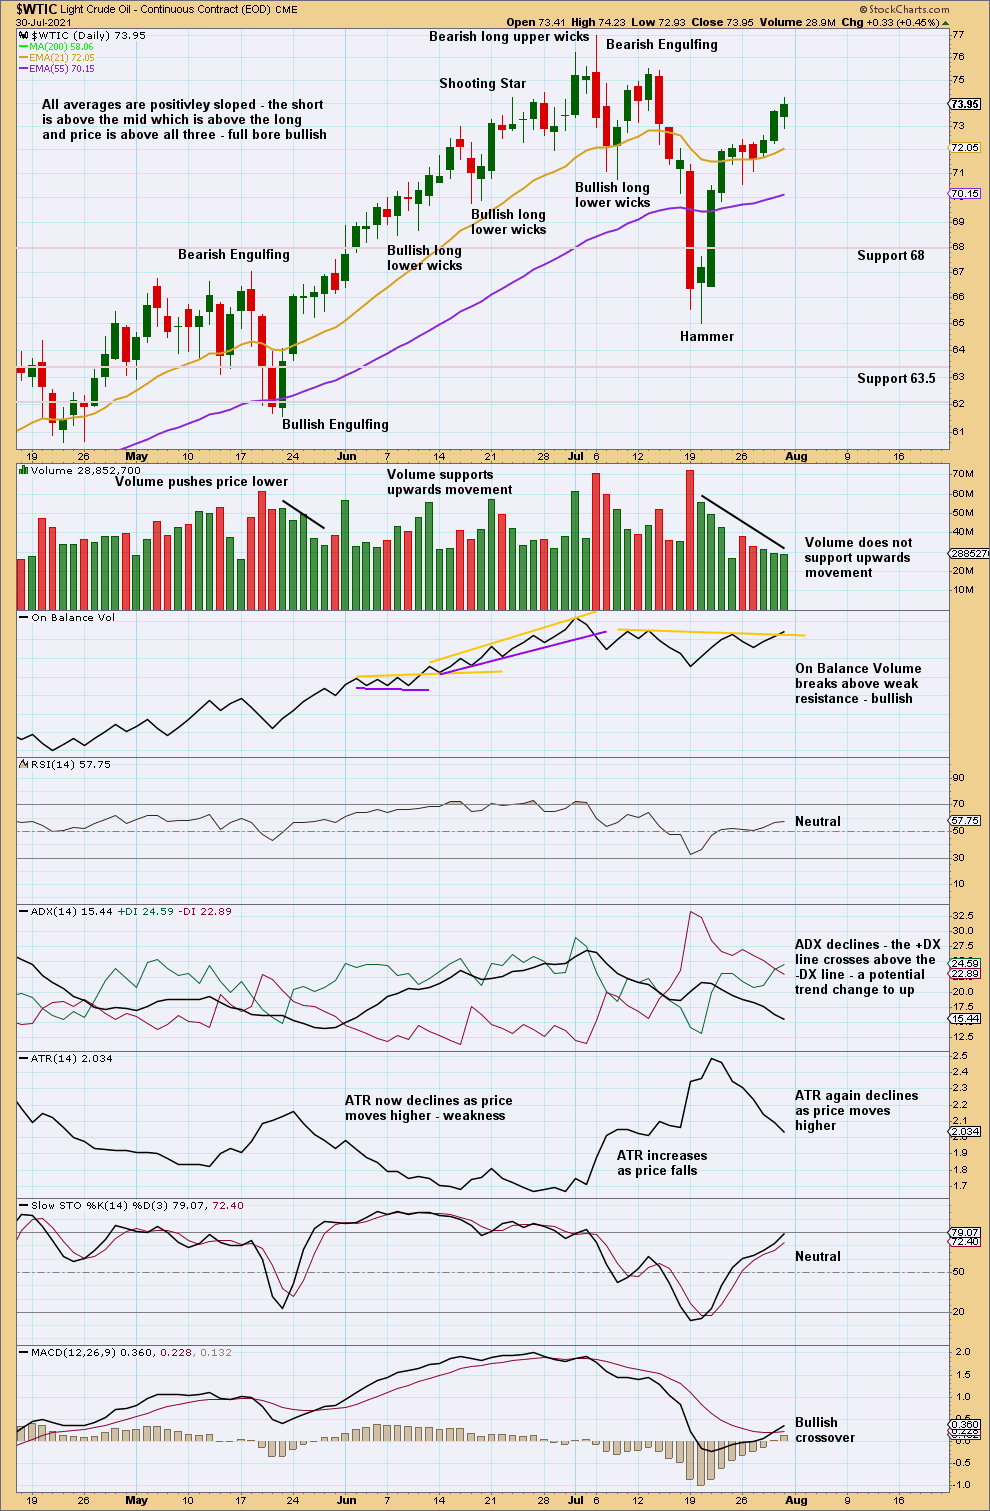
Click chart to enlarge. Chart courtesy of StockCharts.com.
The pullback continued until Stochastics reached oversold and price moved below support, to then turn up strongly. A Hammer candlestick pattern at the low suggests the pullback may be over. This supports the main Elliott wave count.
Neither ADX nor RSI are extreme. There is room for a trend to develop here in either direction.
Declining volume is a concern for the main Elliott wave count, but it must be noted that this has occurred previously in the early days of a sustained upwards trend. The low on the 21st of May was followed by five sessions of overall declining volume on upwards movement, yet price continued in an upwards trend for weeks, moving $15.42 from low to high.
—
Always practice good risk management as the most important aspect of trading. Always trade with stops and invest only 1-5% of equity on any one trade. Failure to manage risk is the most common mistake new traders make.
—