
GOLD: Elliott Wave and Technical Analysis | Charts – August 11, 2021
A breach of the short-term channel on the hourly chart suggests either a bounce or a trend change has occurred.
A small target zone is calculated for the preferred Elliott wave count.
Summary: Both Elliott wave counts remain valid, but the bearish wave count is preferred. The bearish wave count expects a bounce to end within a target zone from 1,777 to 1,779. Thereafter, the mid-term target for the next wave down is at 1,568.
The bullish wave count now expects the bull market to resume to a target at 2,078.
The price point which differentiates the two wave counts at this stage is 1,677.64. A new low below this point would add strong confidence in the bearish wave count.
Grand SuperCycle analysis and last monthly charts are here.
BULLISH ELLIOTT WAVE COUNT
WEEKLY CHART
Click chart to enlarge.
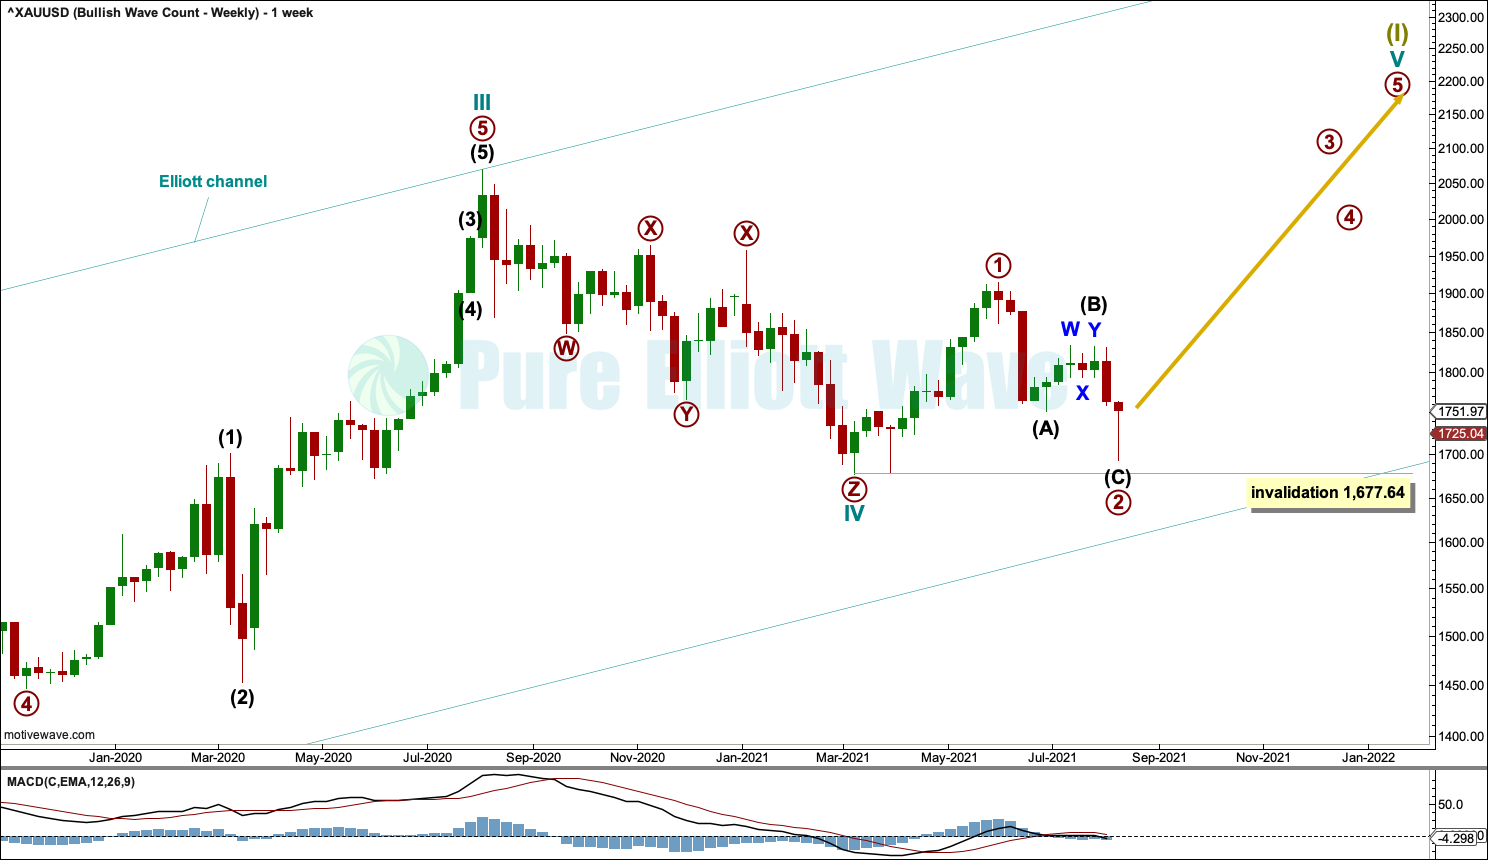
This wave count sees the the bear market complete at the last major low for Gold on 3 December 2015.
If Gold is in a new bull market, then it should begin with a five wave structure upwards on the weekly chart.
Cycle wave I fits as a five wave impulse with reasonably proportionate corrections for primary waves 2 and 4.
Cycle wave II fits as a double flat. However, within the first flat correction labelled primary wave W, this wave count needs to ignore what looks like an obvious triangle from July to September 2016 (this can be seen labelled as a triangle on the second weekly chart on prior analysis here). This movement must be labelled as a series of overlapping first and second waves. Ignoring this triangle reduces the probability of this wave count in Elliott wave terms.
Double flats are fairly rare structures. The probability of this wave count is further reduced.
Cycle wave IV may be a complete triple zigzag. Triple zigzags are not rare structures, but they are not common. The probability of this wave count is further reduced in Elliott wave terms. This is one reason why the bearish Elliott wave count is still considered.
Cycle wave V may have begun. Within cycle wave V: Primary waves 1 and 2 may now both be over, and primary wave 3 may have just begun. If it continues any lower, then primary wave 2 may not move beyond the start of primary wave 1 below 1,677.64.
DAILY CHART
Click chart to enlarge.
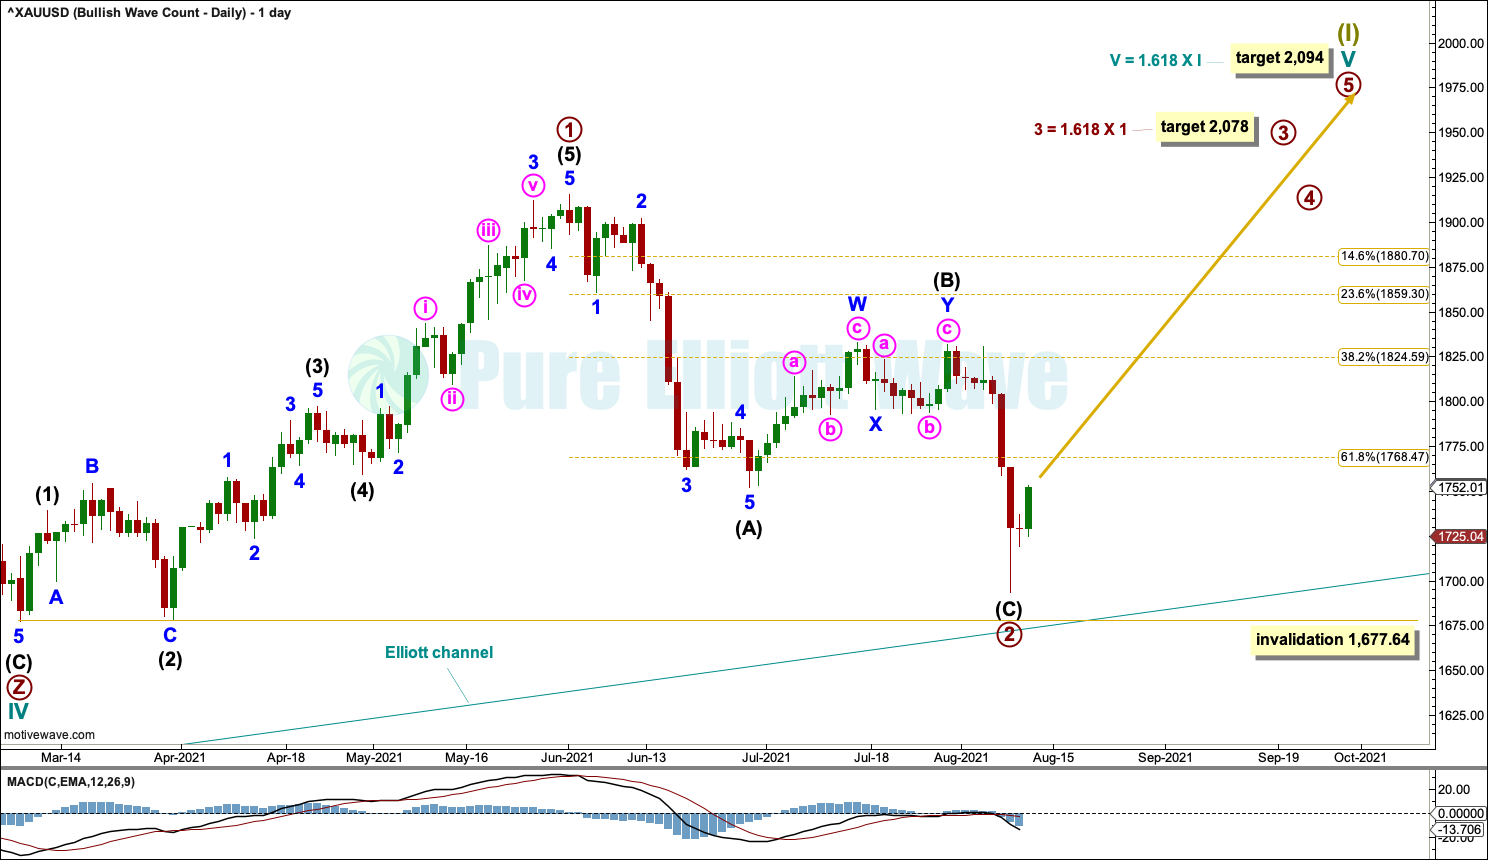
A target is calculated for cycle wave V. If this target is wrong for this wave count, then it may be too low. As price approaches the target, if the structure is incomplete, then a higher target may be calculated.
Primary waves 1 and 2 within cycle wave V may be complete.
A target is calculated for primary wave 3. Primary wave 3 should exhibit an increase in upwards momentum and have support from volume.
HOURLY CHART
Click chart to enlarge.
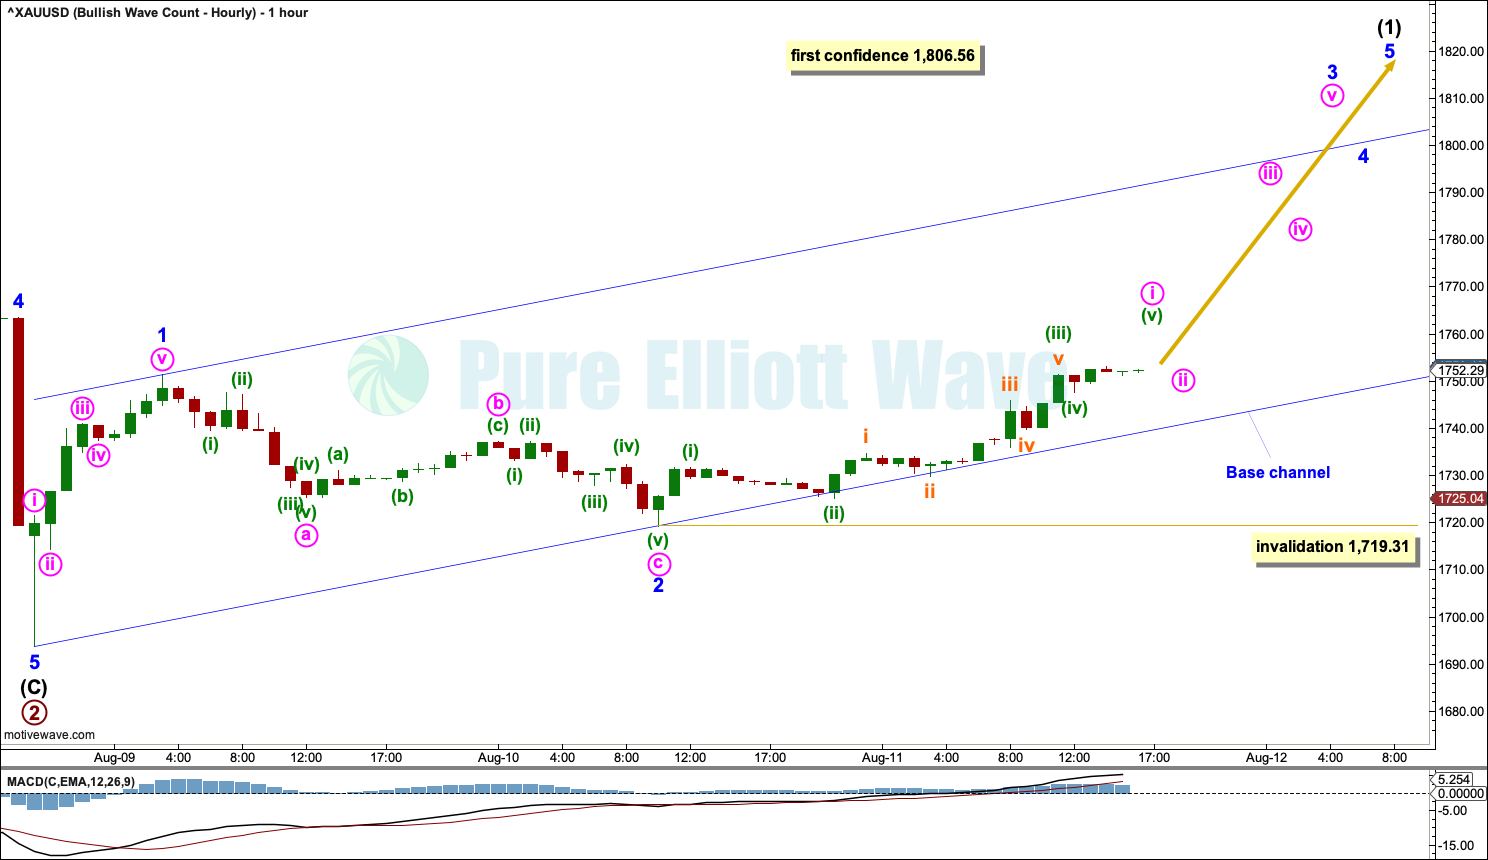
Primary wave 2 may now be complete.
Primary wave 3 may only subdivide as an impulse. Intermediate wave (1) within primary wave 3 may be incomplete and may be unfolding as an impulse.
Within intermediate wave (1): Minor waves 1 and 2 may be complete, and minor wave 3 may only subdivide as an impulse.
Within minor wave 3: Minute wave i may be incomplete, and minute wave ii may not move beyond the start of minute wave i below 1,719.31.
Draw a base channel about the start of intermediate wave (1). Draw the first trend line from the start of minor wave 1 to the end of minor wave 2, then place a parallel copy on the end of minor wave 1. Along the way up, pullbacks may find support about the lower edge of the channel.
BEARISH ELLIOTT WAVE COUNT
WEEKLY CHART
Click chart to enlarge.
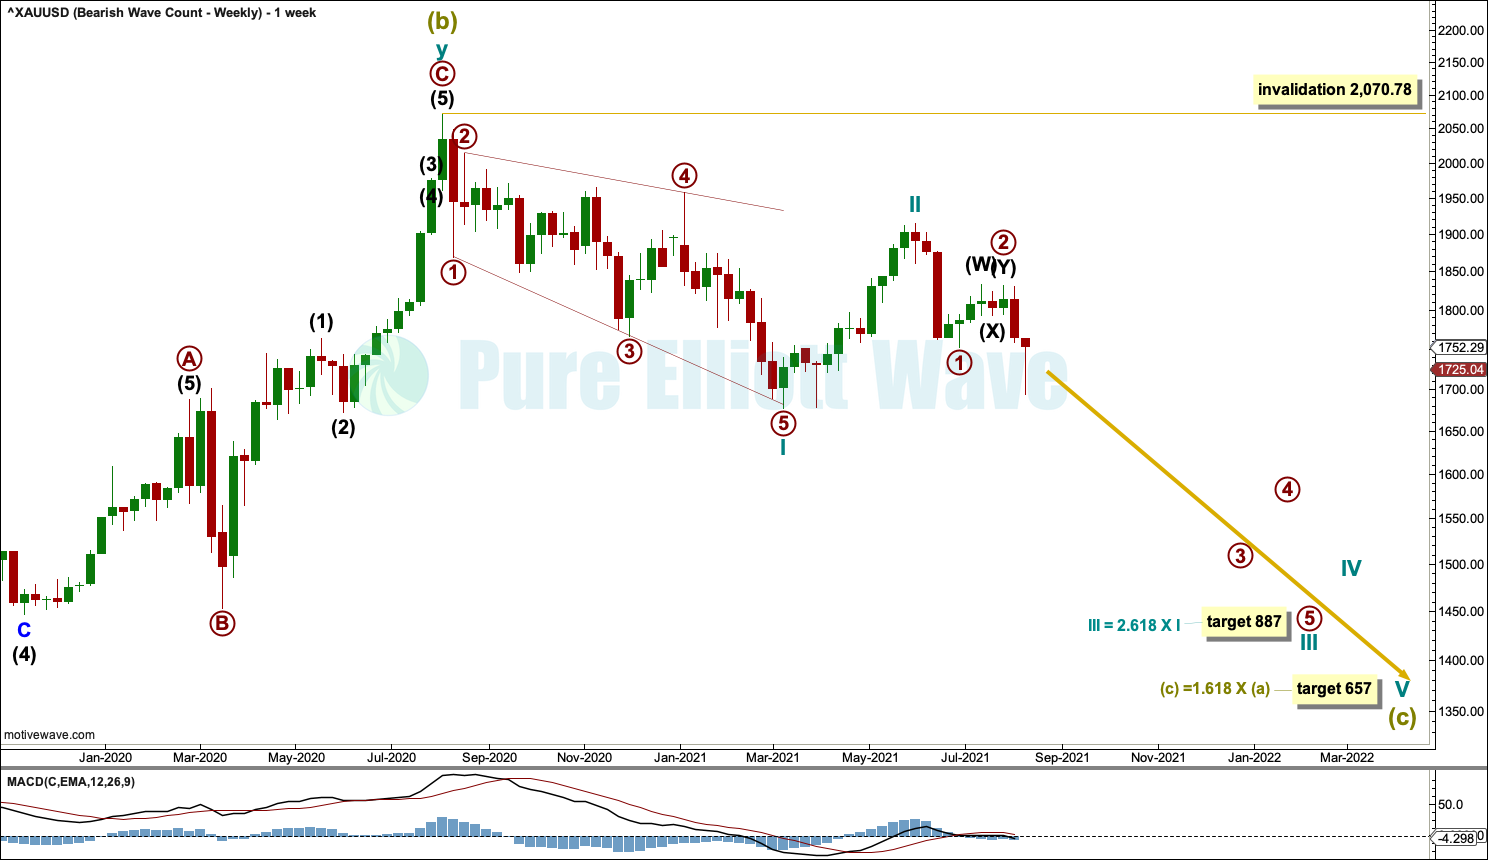
The bigger picture for this Elliott wave count sees Gold as within a bear market, in a three steps back pattern that is labelled Grand Super Cycle wave IV on monthly charts. Grand Super Cycle wave IV may be subdividing as an expanded flat pattern.
Super Cycle wave (b) within Grand Super Cycle wave IV may be a complete double zigzag. This wave count expects Super Cycle wave (c) to move price below the end of Super Cycle wave (a) at 1,046.27 to avoid a truncation and a very rare running flat. The target calculated expects a common Fibonacci ratio for Super Cycle wave (c).
Super Cycle wave (c) may have begun with a leading expanding diagonal for cycle wave I. Leading expanding diagonals in first wave positions are uncommon, so the probability of this wave count is reduced. However, it has a good fit and must be considered.
Second wave corrections to follow leading diagonals in first wave positions are usually very deep. Cycle wave II is deep and the structure may be complete; so far it is following a common pattern. If it continues higher, then cycle wave II may not move beyond the start of cycle wave I above 2,070.78.
DAILY CHART
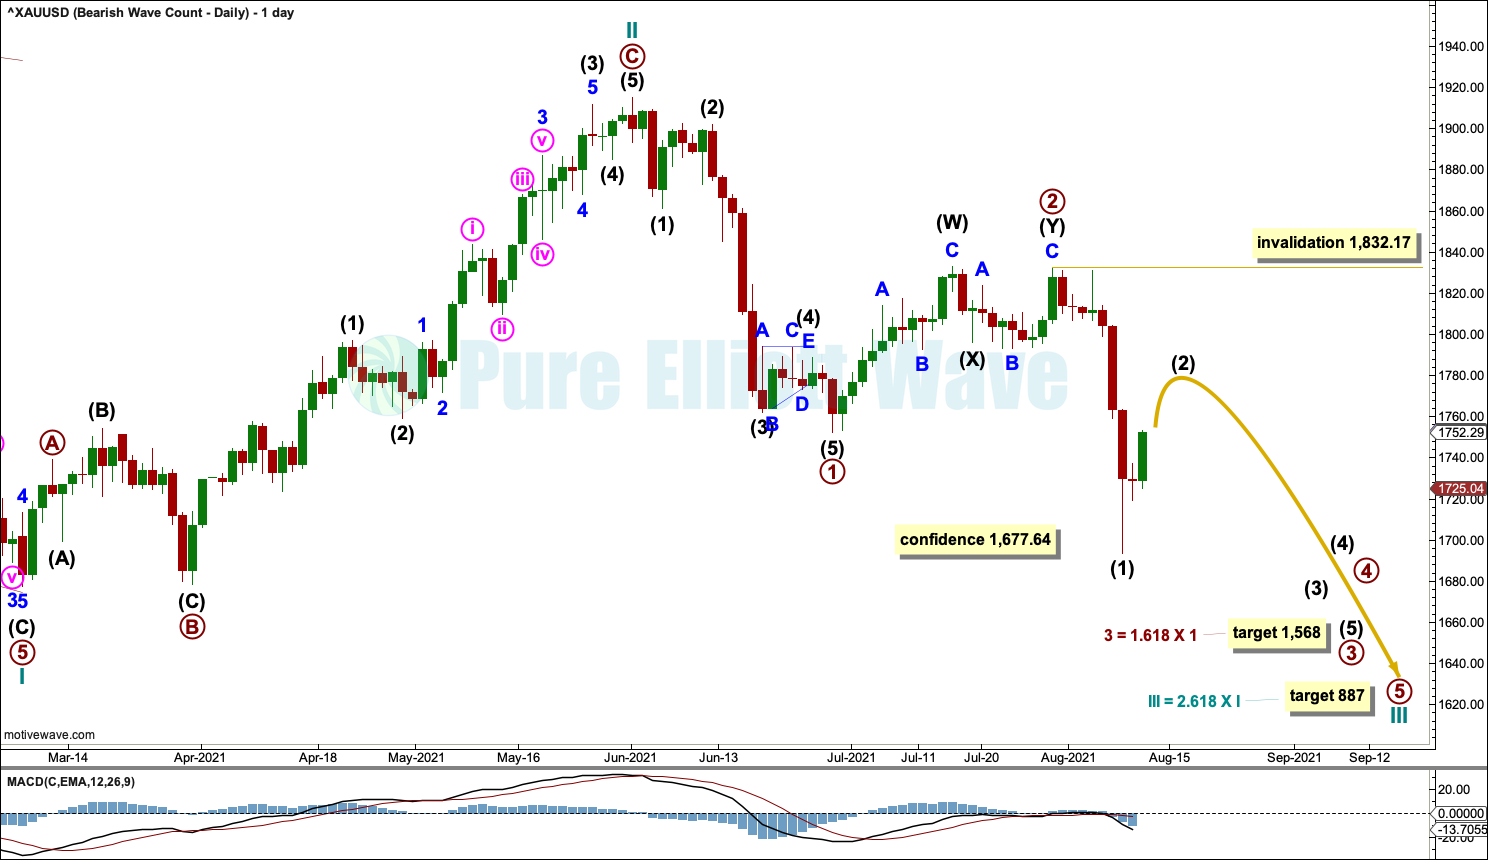
Click chart to enlarge.
A target is calculated for cycle wave III.
Primary wave 2 may be a complete double combination. Primary wave 3 downwards may have just begun. Primary wave 3 has now moved beyond the end of primary wave 1 at 1,752.19, meeting this core Elliott wave rule.
Intermediate wave (2) within primary wave 3 may not move beyond the start of intermediate wave (1) above 1,832.17.
At 1,568 primary wave 3 would reach 1.618 the length of primary wave 1.
Primary wave 3 may last a few months.
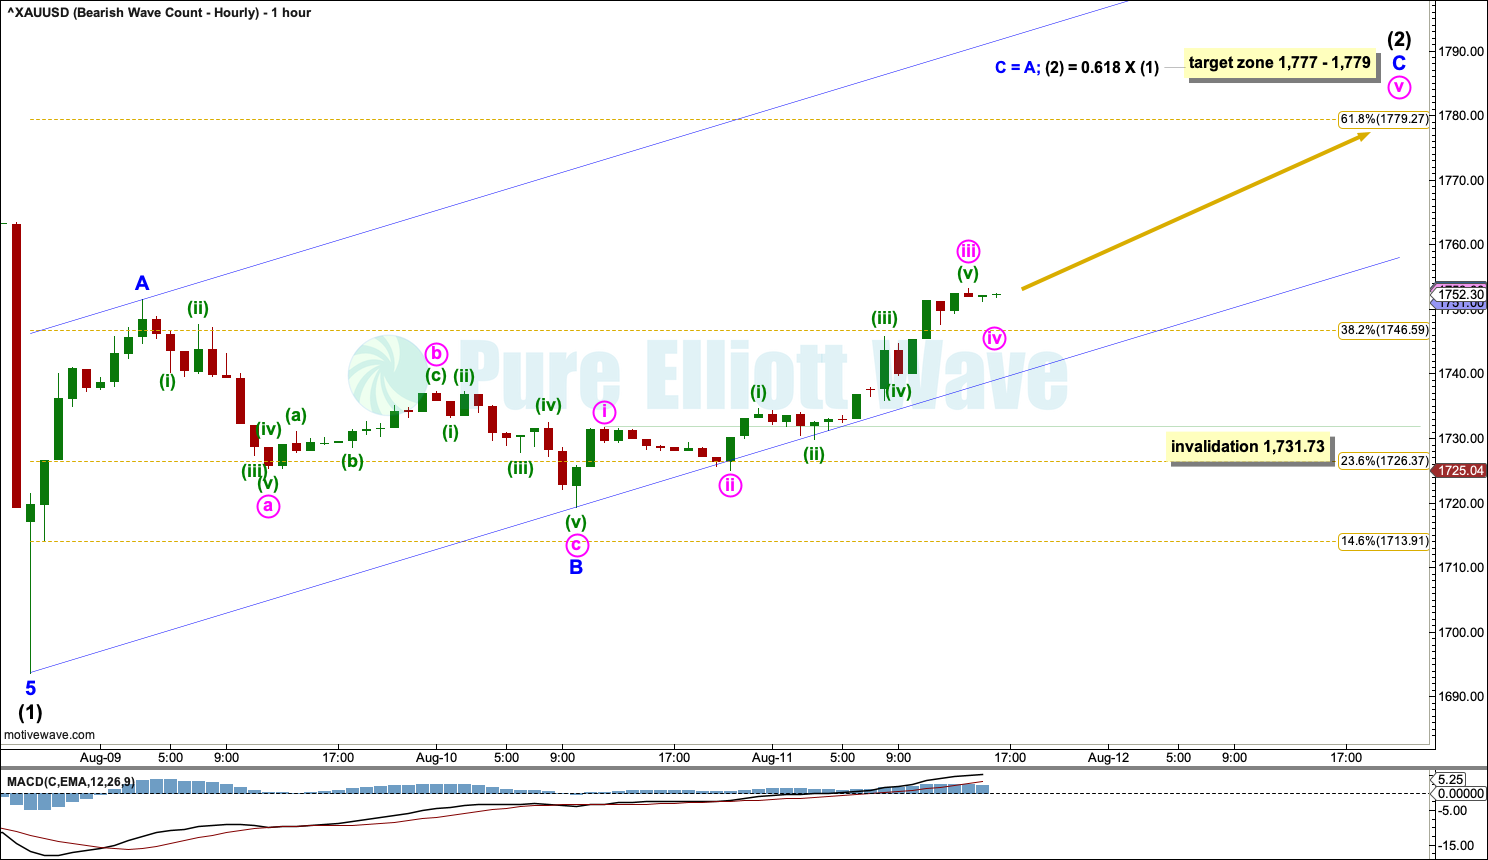
HOURLY CHART
Click chart to enlarge.
Primary wave 3 may only subdivide as an impulse. Intermediate wave (1) within the impulse of primary wave 3 may be complete.
Intermediate wave (2) may be underway and may be subdividing as a zigzag. Within the zigzag: Minor waves A and B may be complete, and minor wave C may only subdivide as a five wave motive structure. At this stage, minor wave C looks like it may be subdividing as the more common impulse.
Within minor wave C: Minute waves i, ii and iii may be complete, and minute wave iv may not move into minute wave i price territory below 1,731.13.
A target is calculated for minor wave C to end.
Draw a channel about intermediate wave (2) using Elliott’s technique for a correction. Draw the first trend line from the start of minor wave A to the end of minor wave B, then place a parallel copy on the end of minor wave A. Minor wave C may end either mid way within the channel or about the upper edge. When the channel is breached by subsequent downwards movement, then it would indicate that intermediate wave (2) may be over and intermediate wave (3) may then be underway.
The next wave down for this bearish wave count is expected to be a third wave at intermediate, primary and cycle degrees. This is a very bearish wave count. A strong increase in downwards momentum may be expected.
TECHNICAL ANALYSIS
WEEKLY CHART
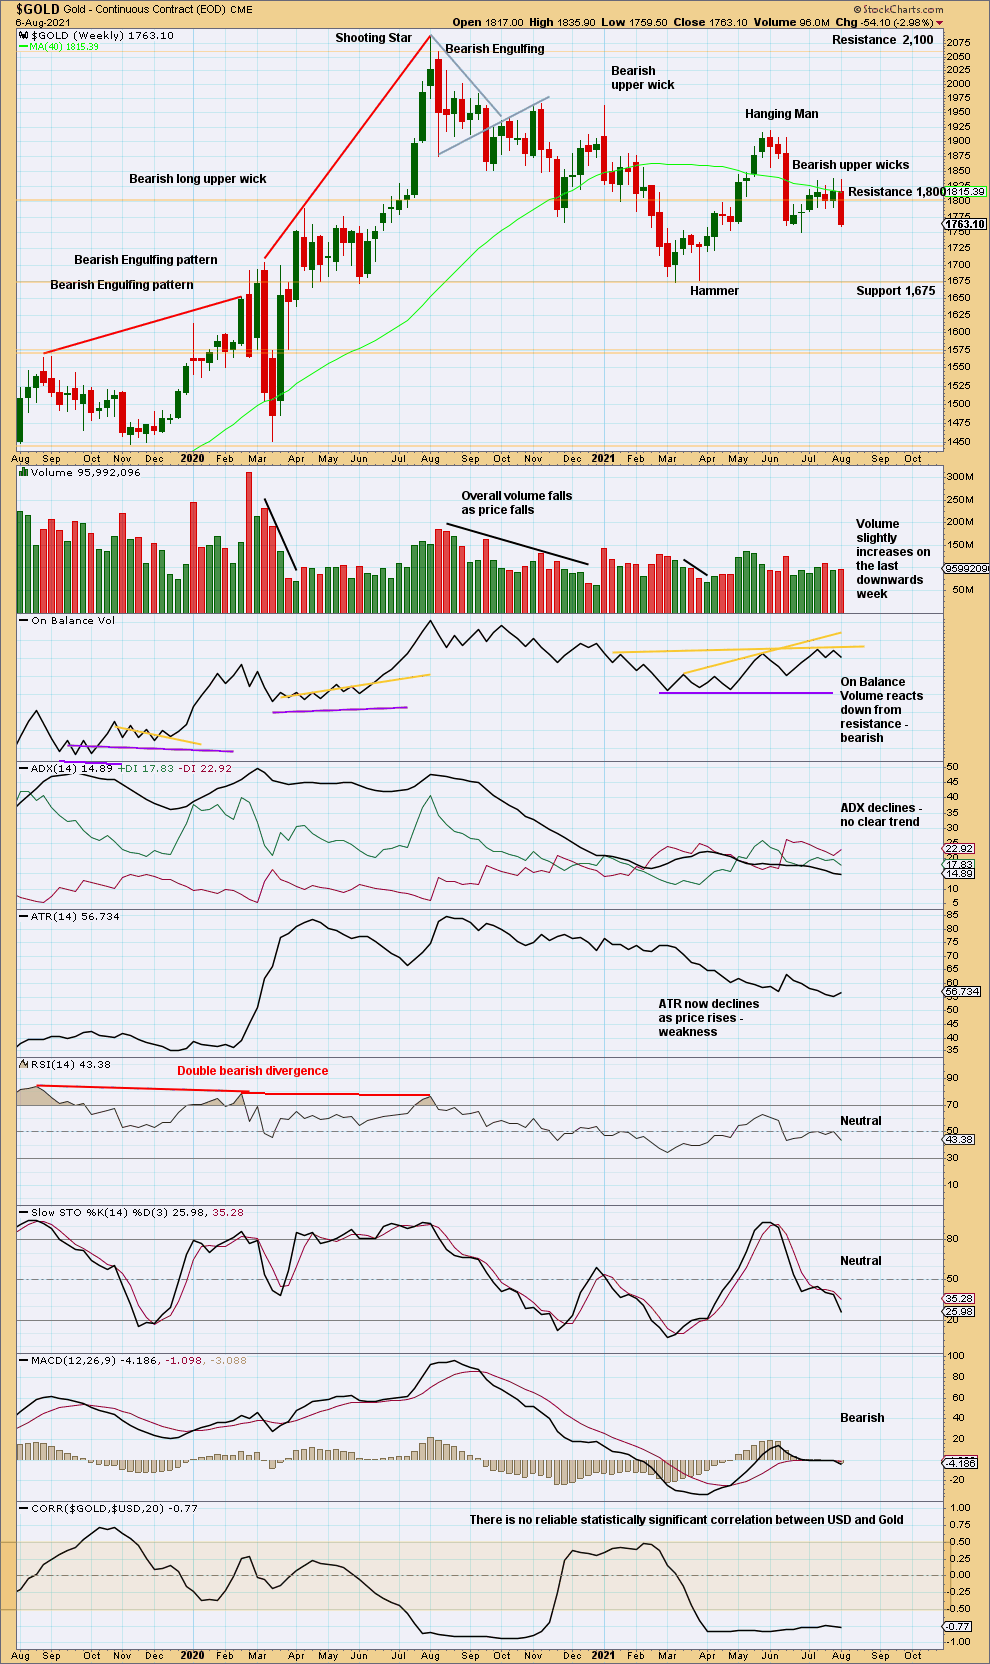
Click chart to enlarge. Chart courtesy of StockCharts.com.
Price last week has convincingly broken below support at 1,800. Stochastics is not yet oversold, so there is room for price to fall further here. Next short-term support is at 1,750 and below that 1,675.
DAILY CHART
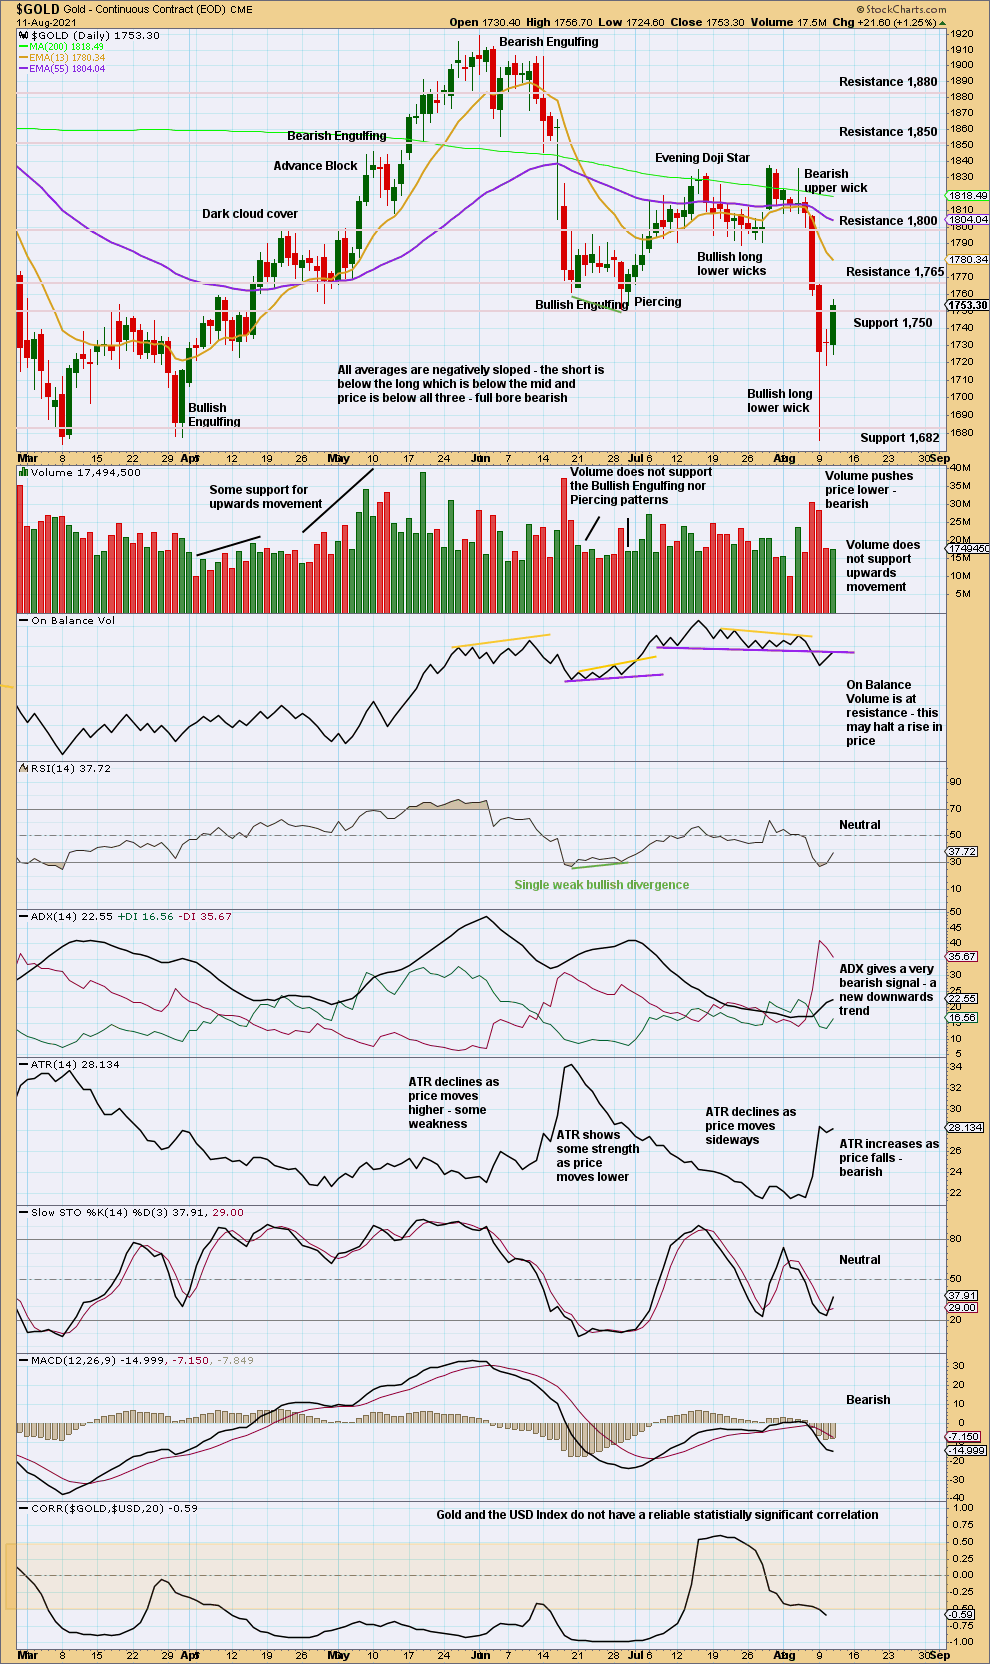
Click chart to enlarge. Chart courtesy of StockCharts.com.
The last three candlesticks do not complete a bullish reversal pattern. The second candlestick has its doji real body reasonably within the body of the first candlestick, so it cannot be part of a Morning Doji Star.
Volume is weak. On Balance Volume is at resistance. RSI has only just reached oversold. ADX is nowhere near extreme. There is plenty of room to go before this downwards trend reaches extreme.
Today’s bounce looks like a counter trend movement.
GDX WEEKLY CHART
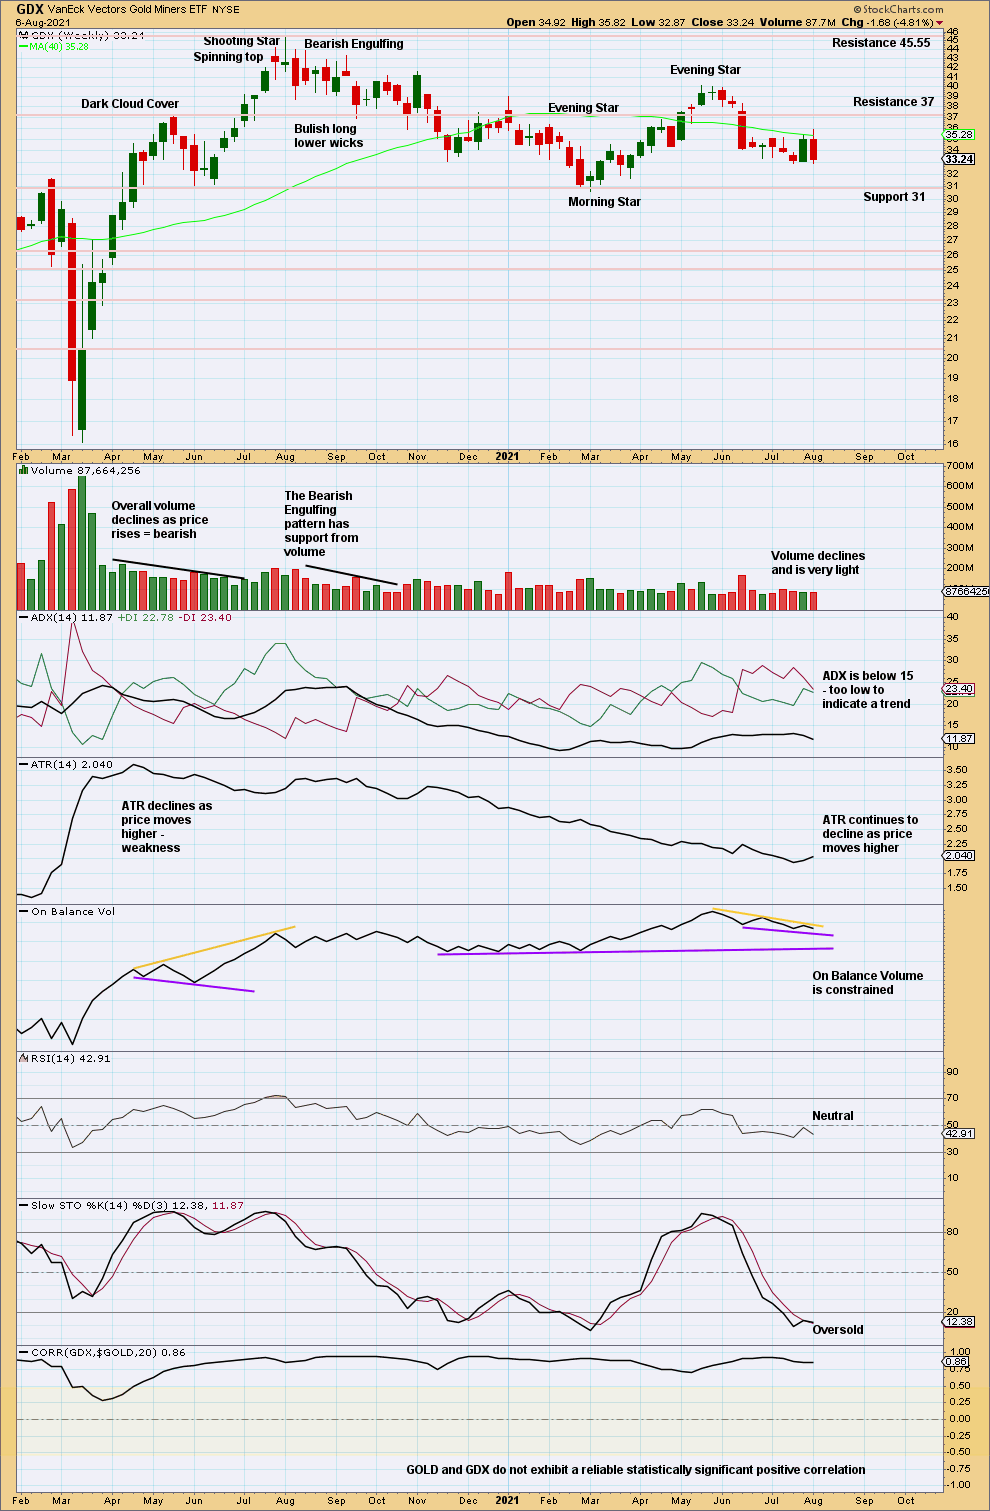
Click chart to enlarge. Chart courtesy of StockCharts.com.
There is still no clear trend at this time frame. Price is range bound.
GDX DAILY CHART
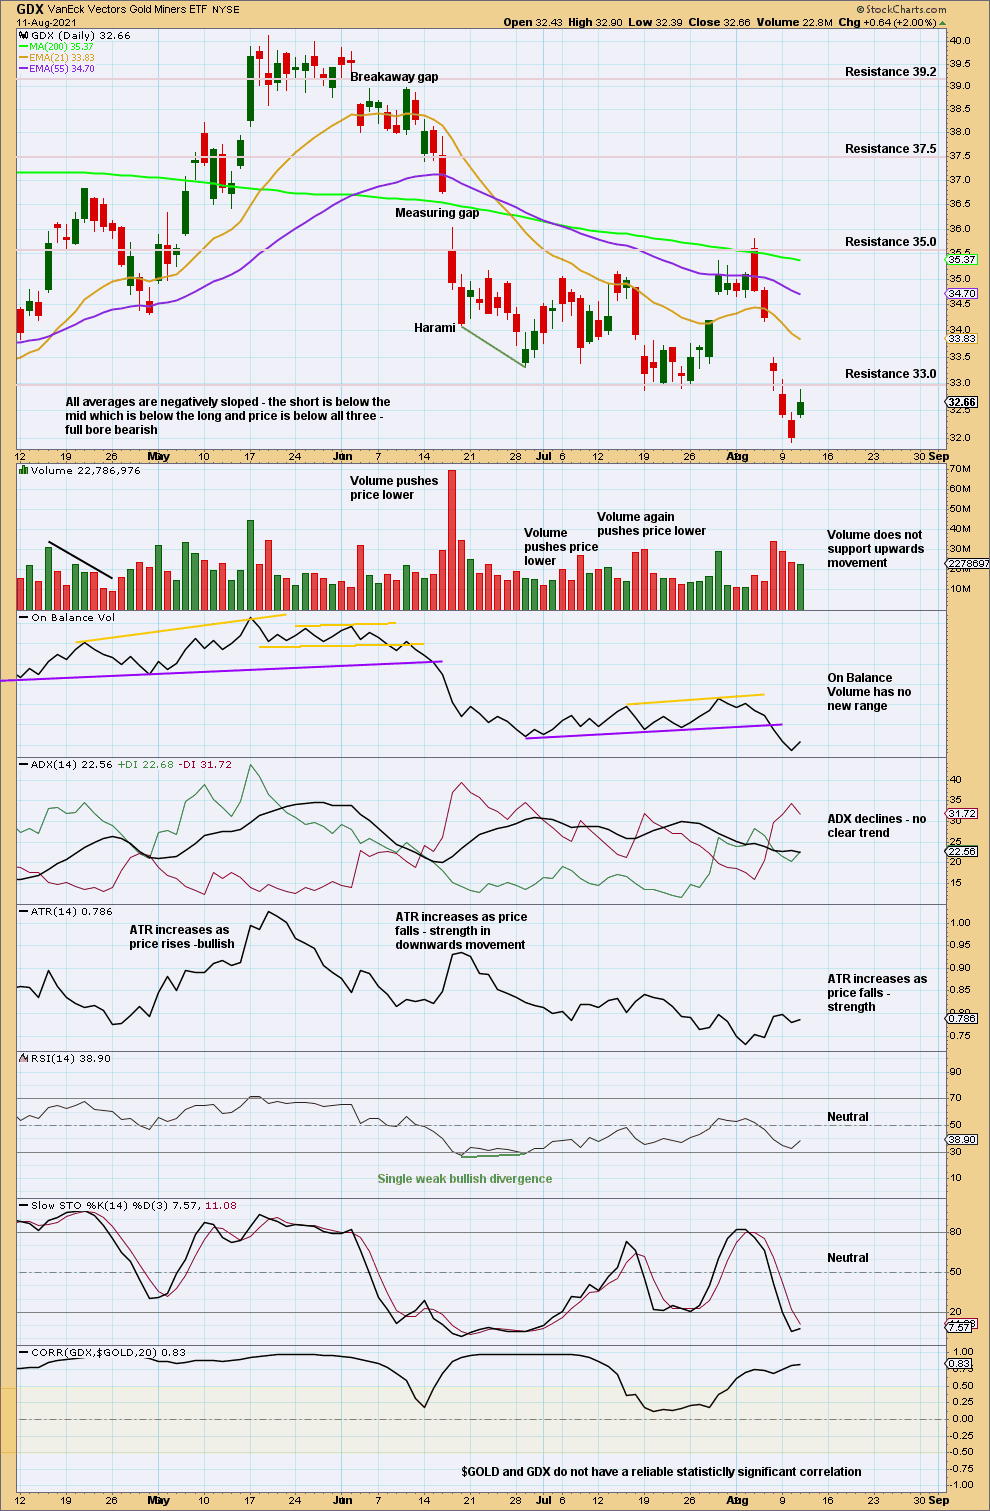
Click chart to enlarge. Chart courtesy of StockCharts.com.
There is no bullish candlestick reversal pattern on GDX.
This bounce looks most likely to be a counter trend movement.
Published @ 05:57 p.m. ET.
—
Careful risk management protects your trading account(s).
Follow my two Golden Rules:
1. Always trade with stops.
2. Risk only 1-5% of equity on any one trade.
—
New updates to this analysis are in bold.
—