
GOLD: Elliott Wave and Technical Analysis | Charts – August 19, 2021
Another small range day moves price slowly lower. Both Elliott wave counts remain valid.
Today a new alternate bullish Elliott wave count is considered.
Summary: Both Elliott wave counts remain valid, but the bearish wave count is preferred. The bearish wave count expects the bounce may have ended at the last high. Thereafter, the short-term target is at 1,571, and the mid-term target is at 1,568. For the short term, a new low below 1,751.48 would add confidence that the bounce should be over. It will be possible though that while price remains above 1,778.64 the bounce may continue higher. A target would be at 1,817.
The bullish wave count now expects the bull market to resume to a target at 2,078. A new short-term target is calculated at 1,836.
The price point which differentiates the two wave counts at this stage is 1,677.64. A new low below this point would add strong confidence in the bearish wave count even though a new alternate bullish wave count would remain valid until 1,303.51.
Grand SuperCycle analysis and last monthly charts are here.
BULLISH ELLIOTT WAVE COUNT
WEEKLY CHART
Click chart to enlarge.
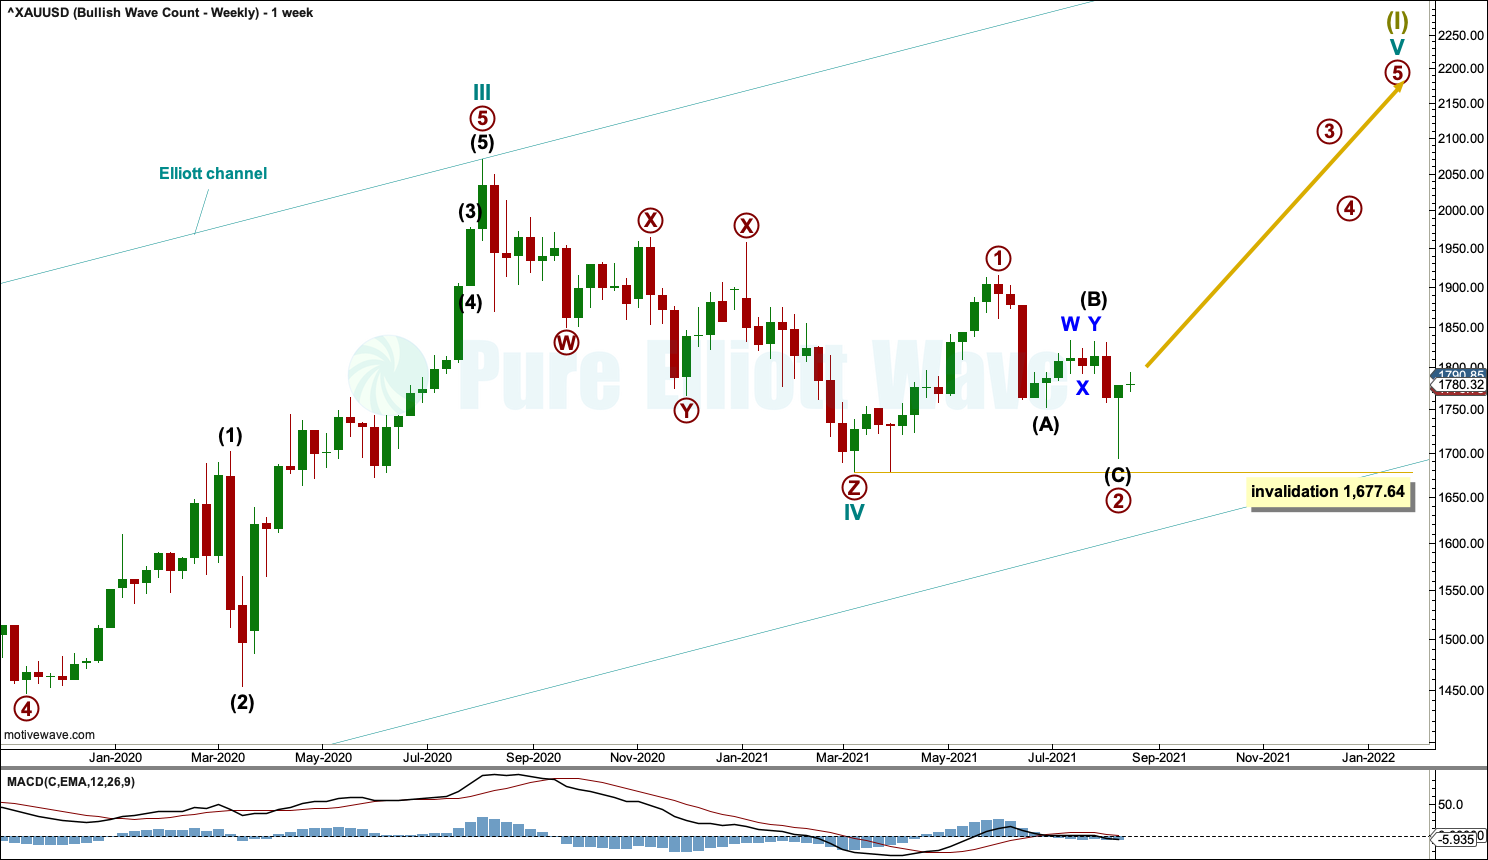
This wave count sees the the bear market complete at the last major low for Gold on 3 December 2015.
If Gold is in a new bull market, then it should begin with a five wave structure upwards on the weekly chart.
Cycle wave I fits as a five wave impulse with reasonably proportionate corrections for primary waves 2 and 4.
Cycle wave II fits as a double flat. However, within the first flat correction labelled primary wave W, this wave count needs to ignore what looks like an obvious triangle from July to September 2016 (this can be seen labelled as a triangle on the second weekly chart on prior analysis here). This movement must be labelled as a series of overlapping first and second waves. Ignoring this triangle reduces the probability of this wave count in Elliott wave terms.
Double flats are fairly rare structures. The probability of this wave count is further reduced.
Cycle wave IV may be a complete triple zigzag. Triple zigzags are not rare structures, but they are not common. The probability of this wave count is further reduced in Elliott wave terms. This is one reason why the bearish Elliott wave count is still considered.
Cycle wave V may have begun. Within cycle wave V: Primary waves 1 and 2 may now both be over, and primary wave 3 may have just begun. If it continues any lower, then primary wave 2 may not move beyond the start of primary wave 1 below 1,677.64.
DAILY CHART
Click chart to enlarge.
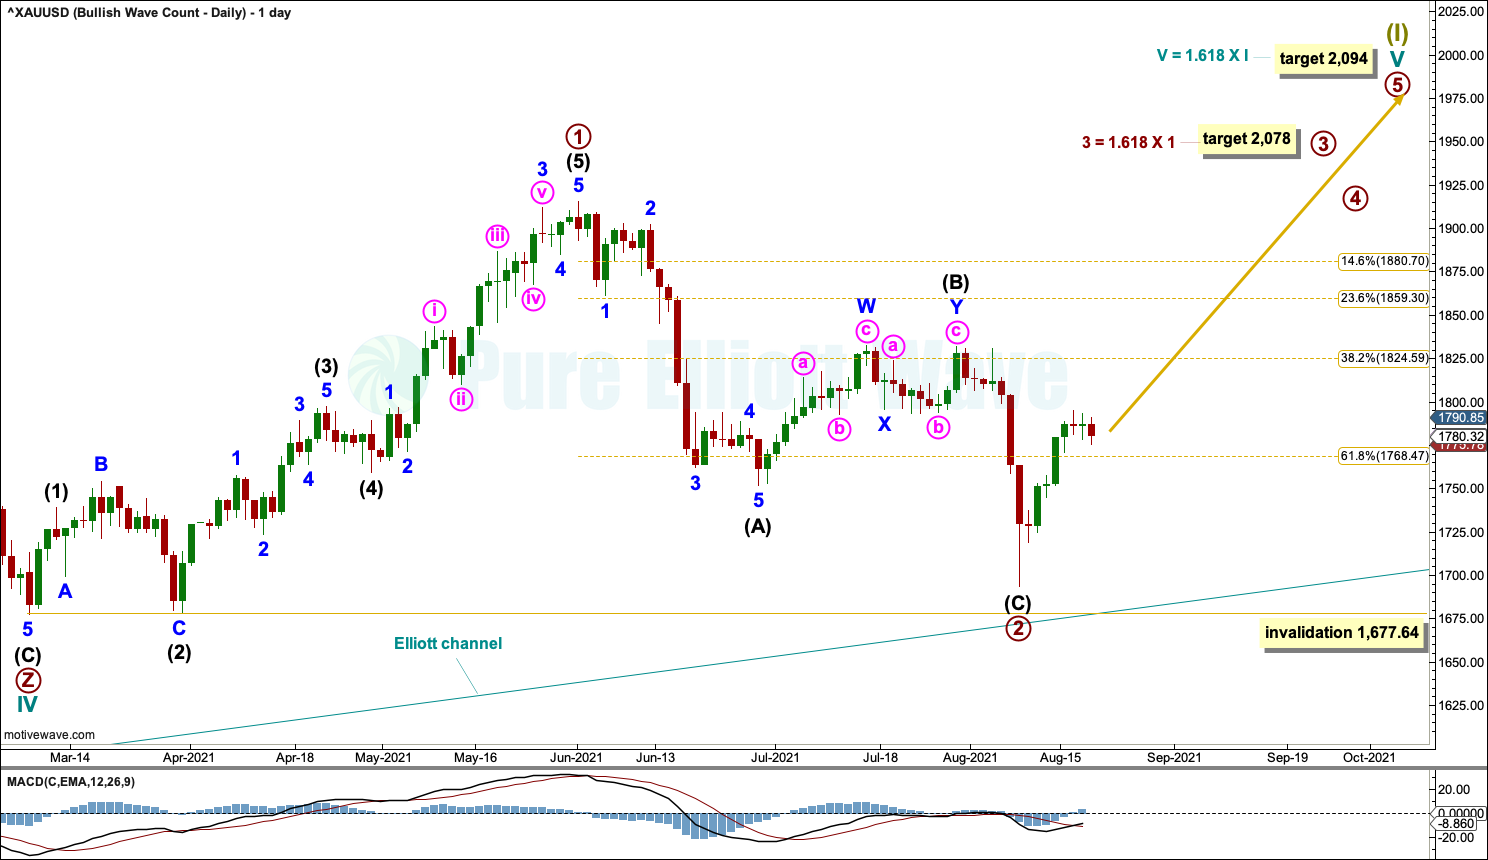
A target is calculated for cycle wave V. If this target is wrong for this wave count, then it may be too low. As price approaches the target, if the structure is incomplete, then a higher target may be calculated.
Primary waves 1 and 2 within cycle wave V may be complete.
A target is calculated for primary wave 3. Primary wave 3 should exhibit an increase in upwards momentum and have support from volume.
HOURLY CHART
Click chart to enlarge.
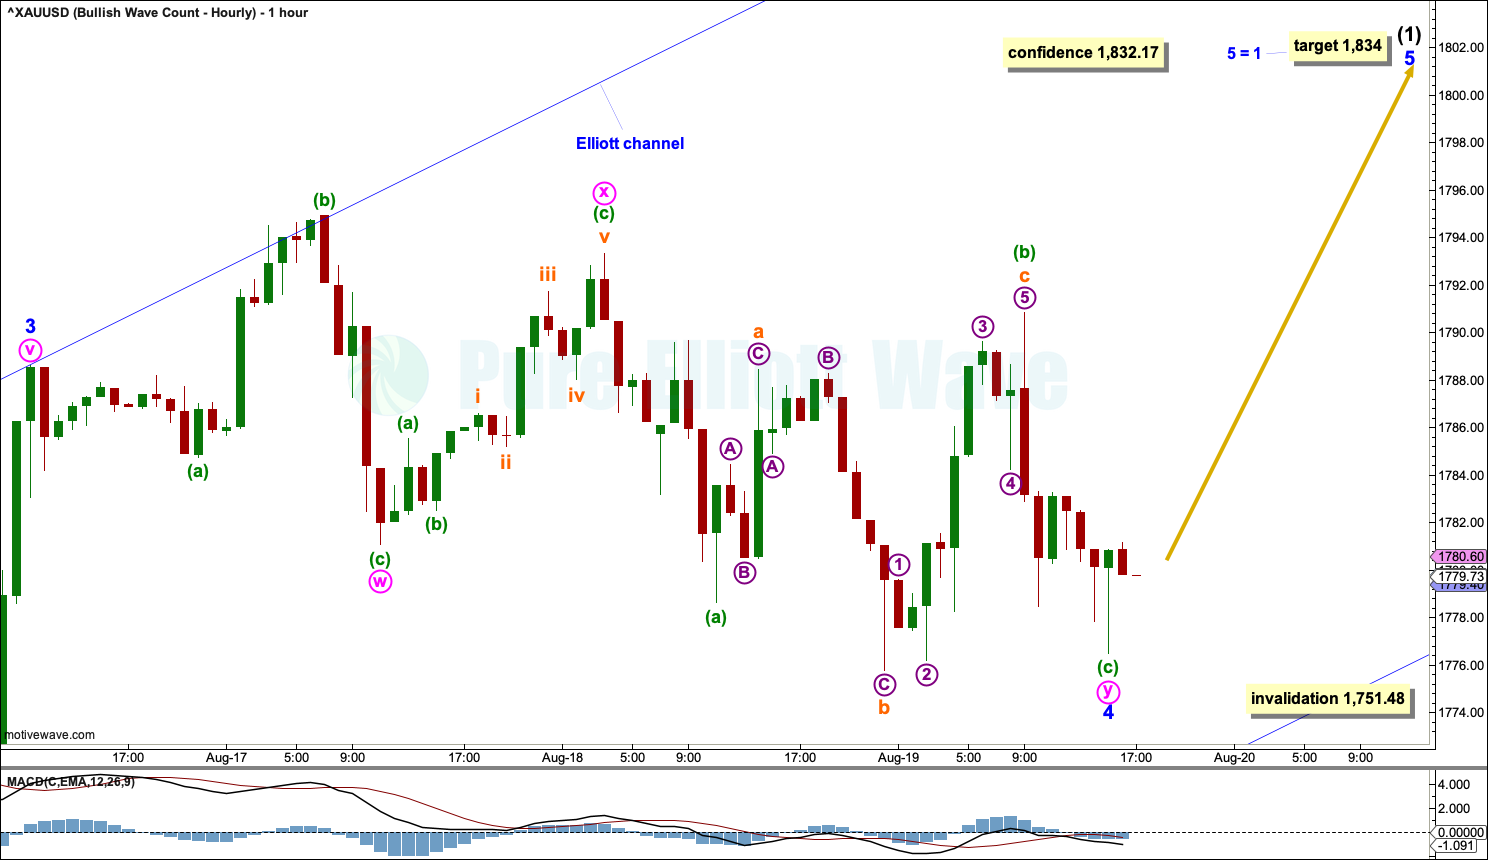
Primary wave 2 may now be complete.
Primary wave 3 may only subdivide as an impulse. Intermediate wave (1) within primary wave 3 may be incomplete and may be unfolding as an impulse.
Minor waves 1, 2, 3 and 4 within intermediate wave (1) may be complete.
Minor wave 4 may have continued sideways as a double combination: flat – X – zigzag, with the zigzag of minute wave y continuing today. However, both minuette waves (a) and (c) within the zigzag of minute wave y should subdivide as five wave structures, but both of these waves look like threes on the hourly chart. This wave count does not have a good fit, but I have so far been unable to resolve this problem. The probability of this wave count is reduced in Elliott wave terms.
A double combination for minor wave 4 provides alternation with the relatively deep zigzag of minor wave 2. If minor wave 4 continues further as a very rare triple combination, then it may find support about the lower edge of the Elliott channel. Minor wave 4 may not move into minor wave 1 price territory below 1,751.48.
A target is calculated for minor wave 5.
Draw an Elliott channel about the start of intermediate wave (1). Draw the first trend line from the end of minor wave 1 to the end of minor wave 3, then place a parallel copy on the end of minor wave 2. The upper edge may show where minor wave 5 may find resistance.
ALTERNATE WEEKLY CHART
Click chart to enlarge.
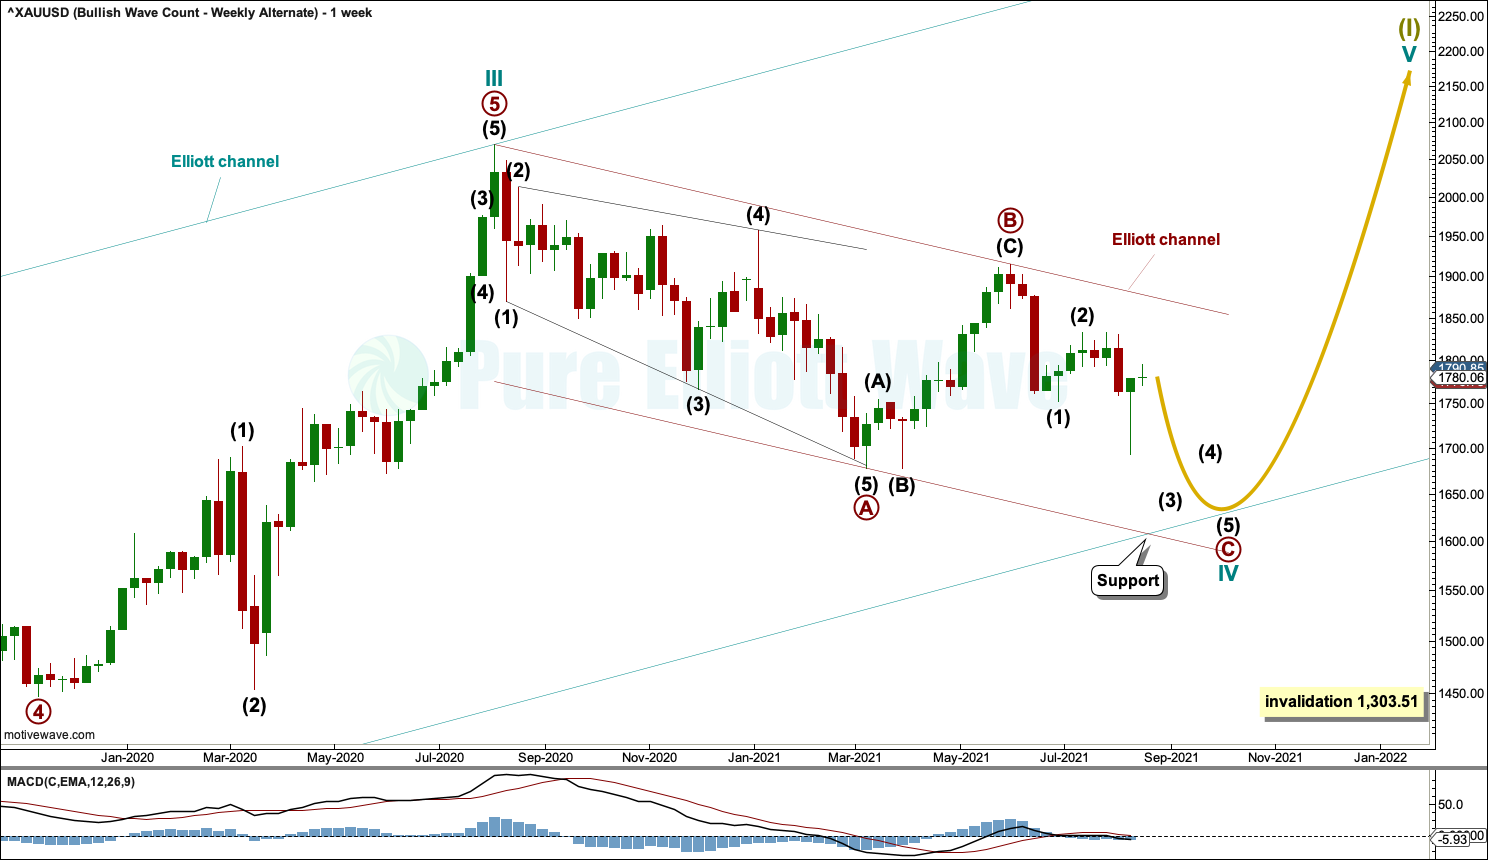
This alternate wave count is new today although it has been described in comments before.
It is possible that cycle wave IV is continuing lower as a large single zigzag. Within the zigzag: Primary wave A may have completed as a leading expanding diagonal, primary wave B may be a complete zigzag, and now primary wave C may continue lower to end at least below the end of primary wave A at 1,677.64.
Primary wave C may end about support at the lower edge of either the large teal channel or the maroon channel.
Cycle wave IV may not move into cycle wave I price territory below 1,303.51.
BEARISH ELLIOTT WAVE COUNT
WEEKLY CHART
Click chart to enlarge.
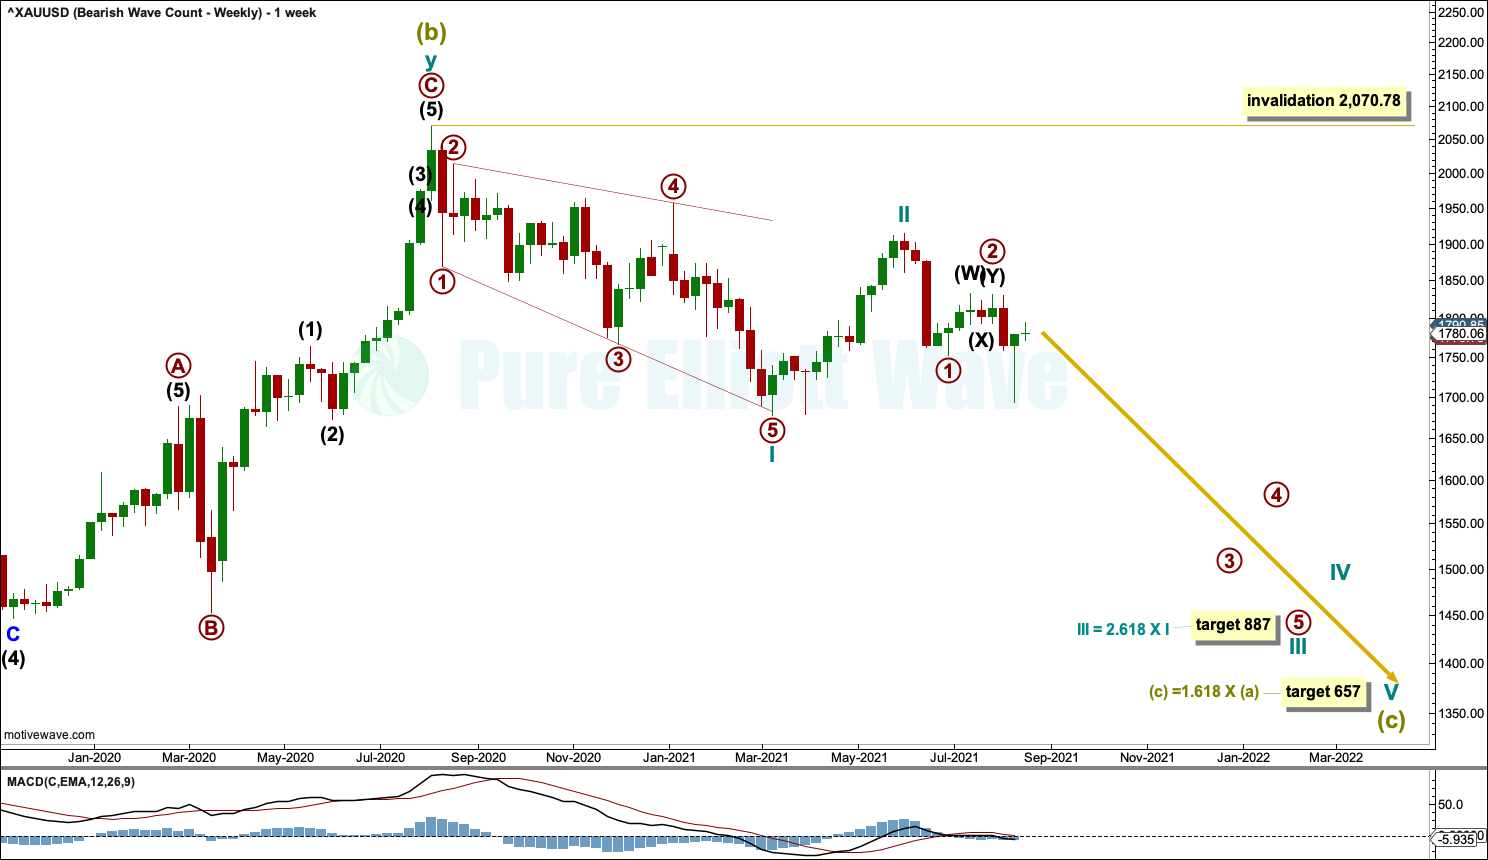
The bigger picture for this Elliott wave count sees Gold as within a bear market, in a three steps back pattern that is labelled Grand Super Cycle wave IV on monthly charts. Grand Super Cycle wave IV may be subdividing as an expanded flat pattern.
Super Cycle wave (b) within Grand Super Cycle wave IV may be a complete double zigzag. This wave count expects Super Cycle wave (c) to move price below the end of Super Cycle wave (a) at 1,046.27 to avoid a truncation and a very rare running flat. The target calculated expects a common Fibonacci ratio for Super Cycle wave (c).
Super Cycle wave (c) may have begun with a leading expanding diagonal for cycle wave I. Leading expanding diagonals in first wave positions are uncommon, so the probability of this wave count is reduced. However, it has a good fit and must be considered.
Second wave corrections to follow leading diagonals in first wave positions are usually very deep. Cycle wave II is deep and the structure may be complete; so far it is following a common pattern. If it continues higher, then cycle wave II may not move beyond the start of cycle wave I above 2,070.78.
DAILY CHART
Click chart to enlarge.
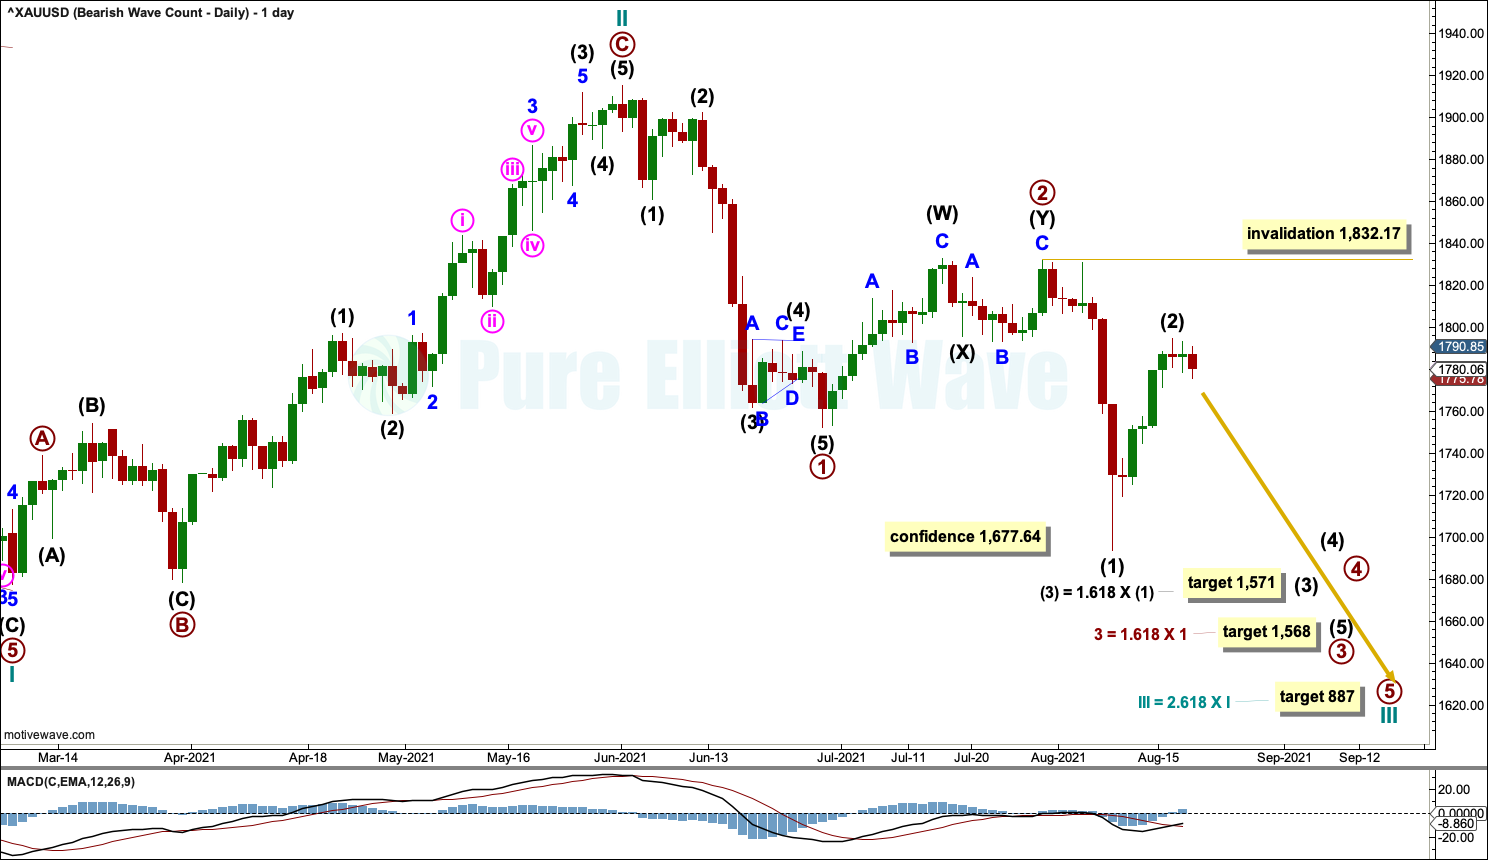
A target is calculated for cycle wave III.
Primary wave 2 may be a complete double combination. Primary wave 3 downwards may have begun. Primary wave 3 has now moved beyond the end of primary wave 1 at 1,752.19, meeting this core Elliott wave rule.
Intermediate wave (2) within primary wave 3 may not move beyond the start of intermediate wave (1) above 1,832.17.
At 1,568 primary wave 3 would reach 1.618 the length of primary wave 1.
At 1,571 intermediate wave (3) would reach 1.618 the length of intermediate wave (1).
Primary wave 3 may last a few months.
HOURLY CHART
Click chart to enlarge.
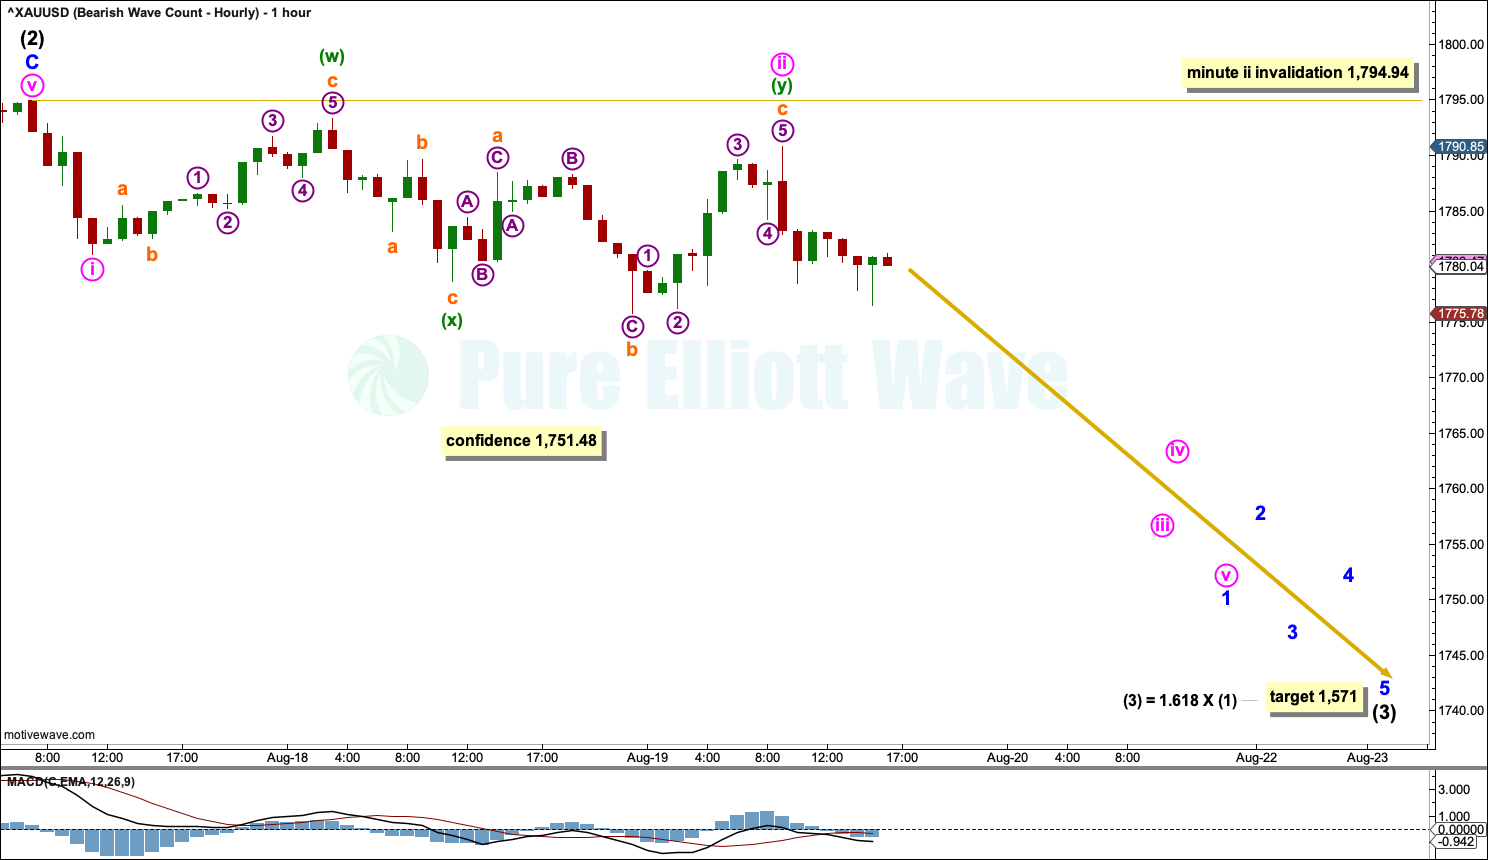
Intermediate wave (3) may have begun.
A new low below 1,751.48 at this stage would add reasonable confidence that intermediate wave (2) may be over.
Minute wave ii within intermediate wave (3) may not move beyond the start of minute wave i above 1,794.94.
Minute wave ii may have continued sideways today as a double combination: zigzag – X – flat. The subdivisions of each part of this structure have a much better fit than the same piece of price movement for the bullish wave count.
The next wave down for this bearish wave count is expected to be a third wave at intermediate, primary and cycle degrees. This is a very bearish wave count. A strong increase in downwards momentum may be expected.
ALTERNATE HOURLY CHART
This alternate wave count was invalidated.
TECHNICAL ANALYSIS
WEEKLY CHART
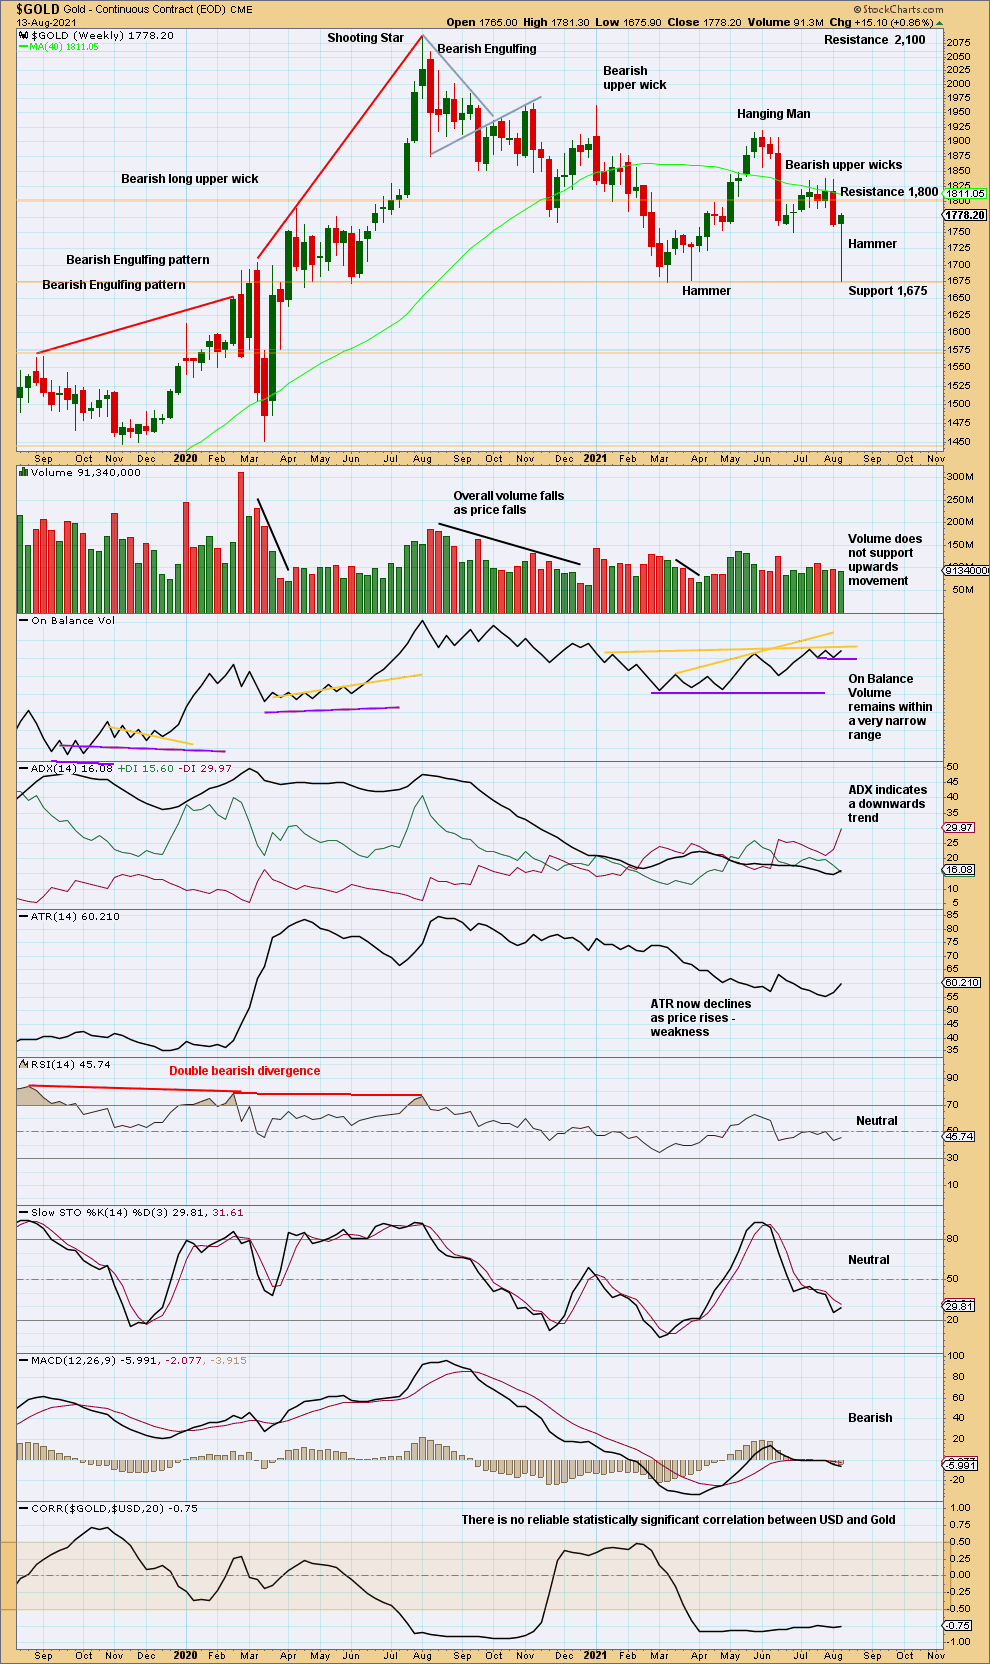
Click chart to enlarge. Chart courtesy of StockCharts.com.
Price has reached next support about 1,675 and bounced up strongly, completing a very bullish Hammer reversal pattern. However, ADX gives a strong bearish signal this week and volume has not supported upwards movement.
DAILY CHART
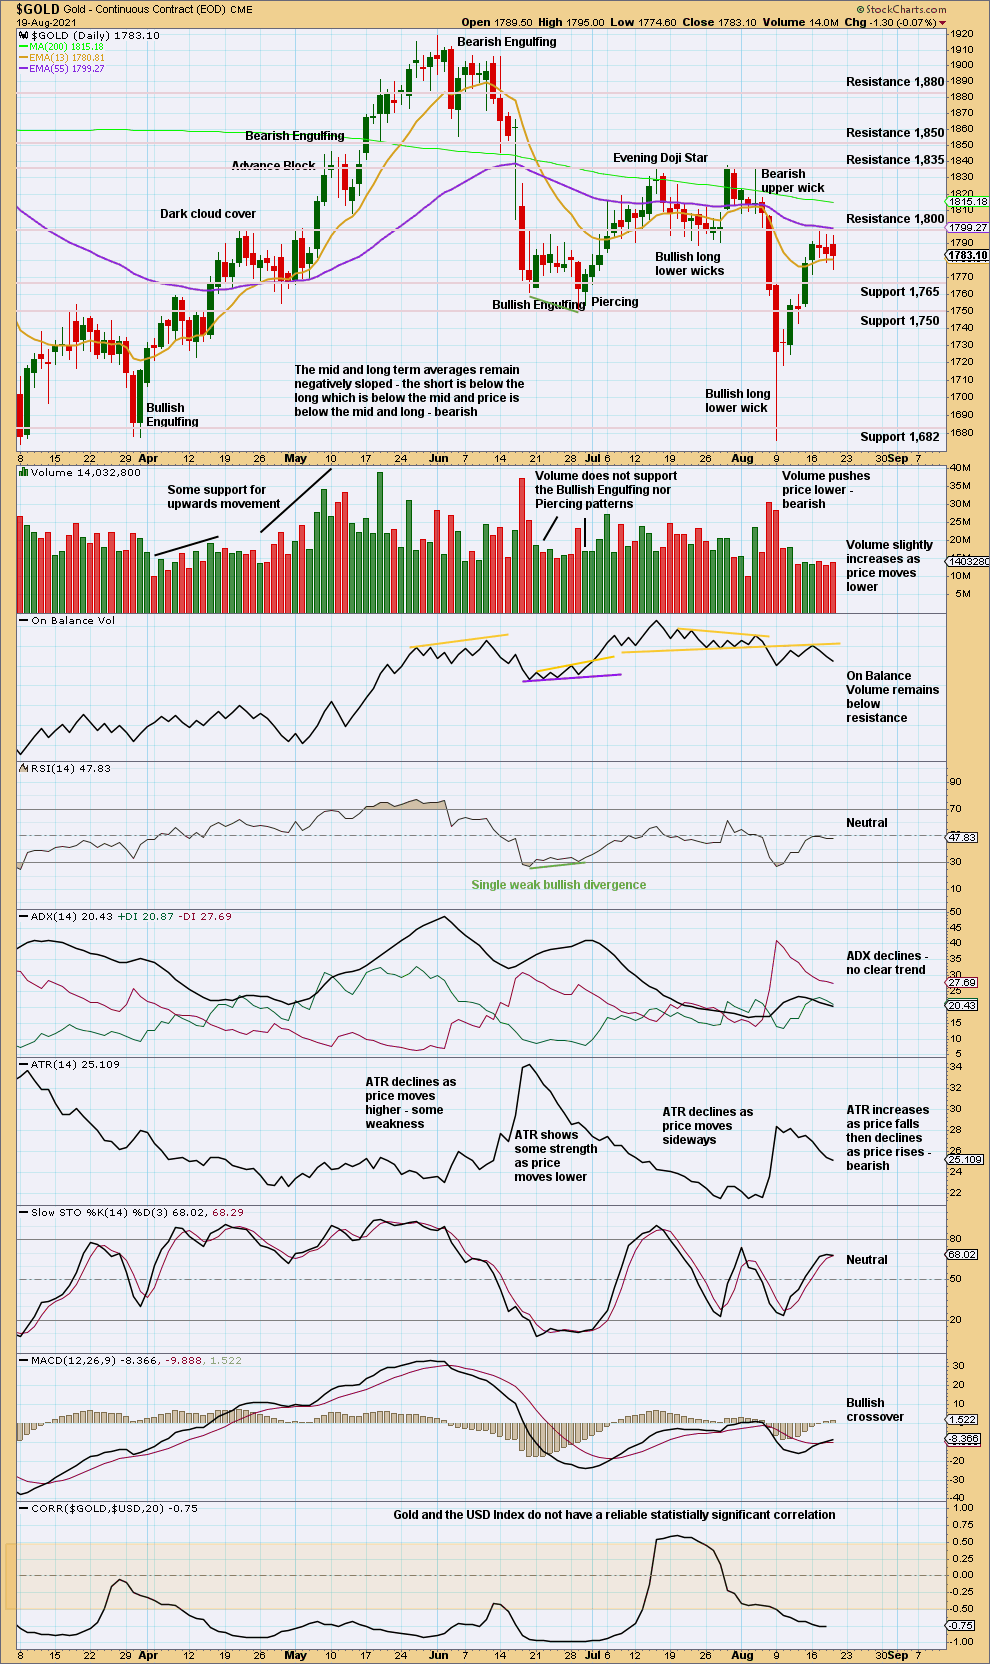
Click chart to enlarge. Chart courtesy of StockCharts.com.
Price is bouncing with weak volume and declining ATR.
Resistance at 1,800 continues to hold, but the last two sessions look like a small consolidation below resistance within an ongoing upwards bounce. If price does close above 1,800, then the next area of resistance would be about 1,835. However, a slight increase in today’s volume and On Balance Volume remaining bearish suggest a high may be in place. Sometimes new waves for Gold can start out slowly.
GDX WEEKLY CHART
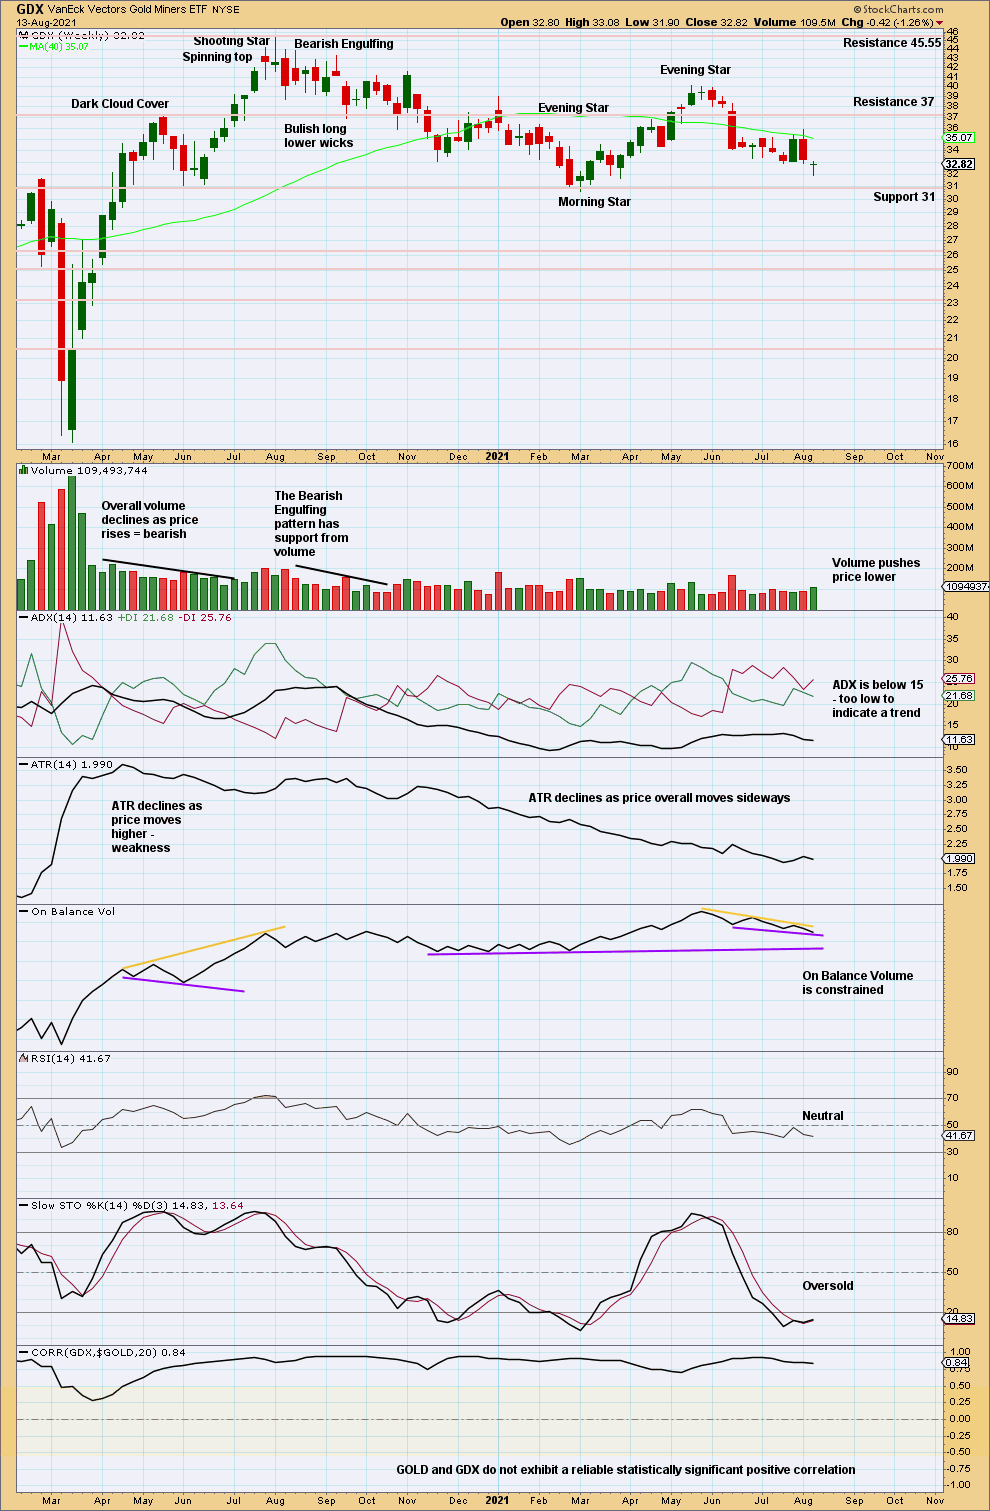
Click chart to enlarge. Chart courtesy of StockCharts.com.
There is still no clear trend at this time frame. Price is range bound.
GDX DAILY CHART
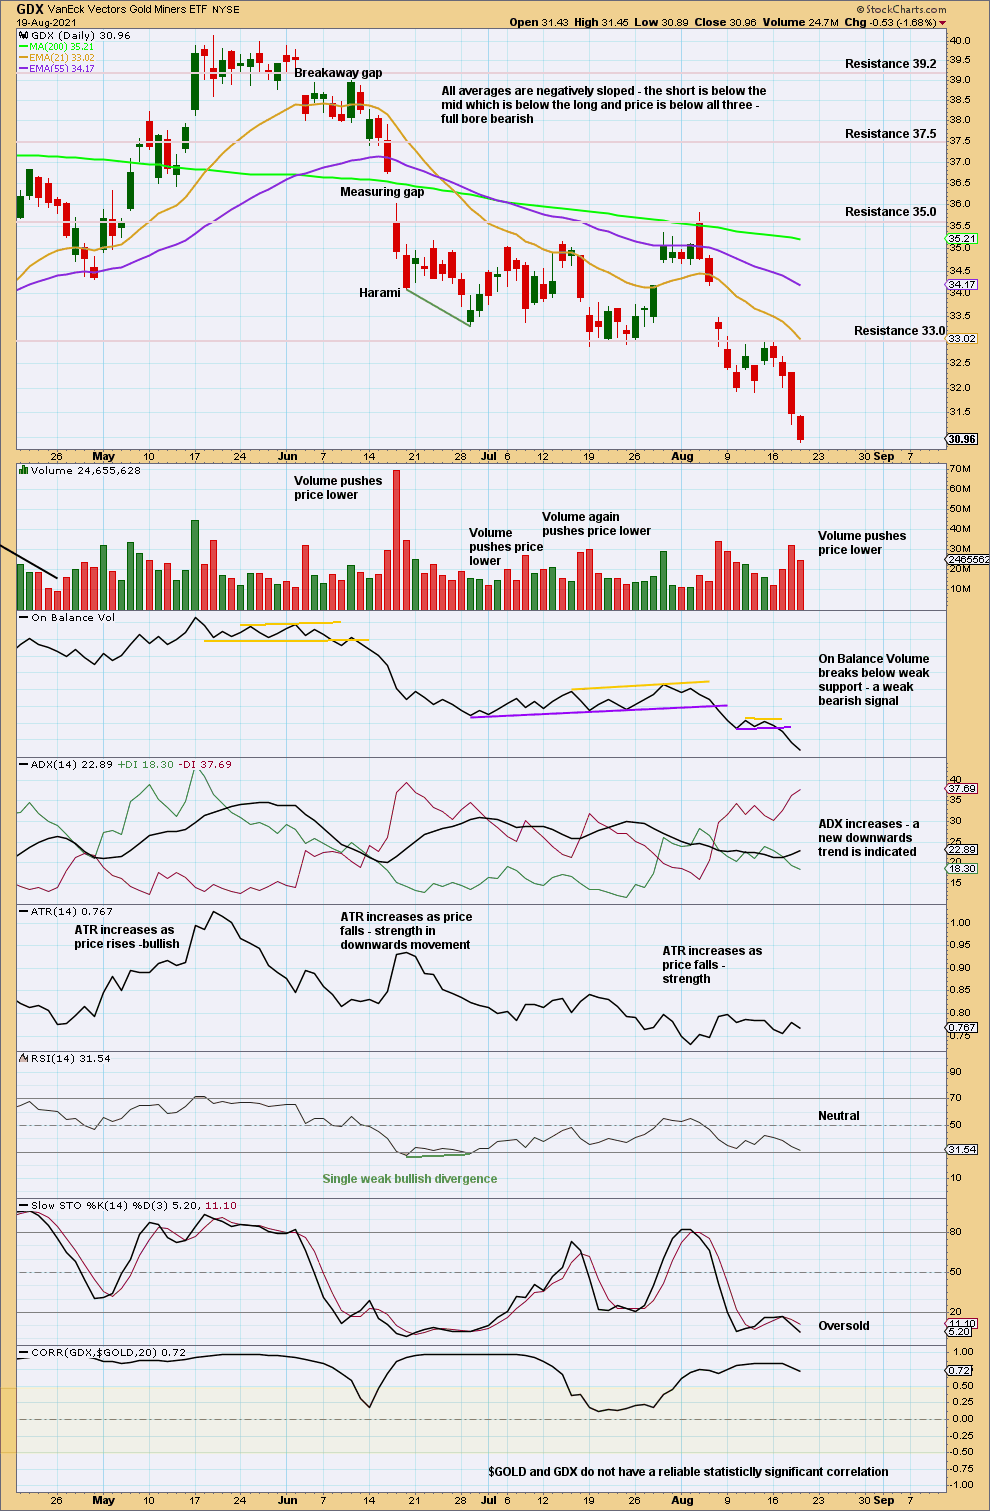
Click chart to enlarge. Chart courtesy of StockCharts.com.
Volume and ADX suggest more downwards movement. Look for next support 26.5.
Published @ 06:38 p.m. ET.
—
Careful risk management protects your trading account(s).
Follow my two Golden Rules:
1. Always trade with stops.
2. Risk only 1-5% of equity on any one trade.
—
New updates to this analysis are in bold.
—