A slight new low below 20.42 is enough to invalidate the alternate Elliott wave count. For GDX I now have only one Elliott wave count.
Click charts to enlarge.
GDX does not appear to have sufficient volume for Elliott wave analysis of this market to be reliable. It exhibits truncations readily, and often its threes look like fives while its fives look like threes. I will let my Gold analysis lead GDX, and I will not let GDX determine my Gold analysis for this reason.
I have learned the hard way, specifically with AAPL, that in a market with insufficient volume (even at a monthly chart level) if a movement looks like a three or a five that this apparent clear structure may not be relied upon.
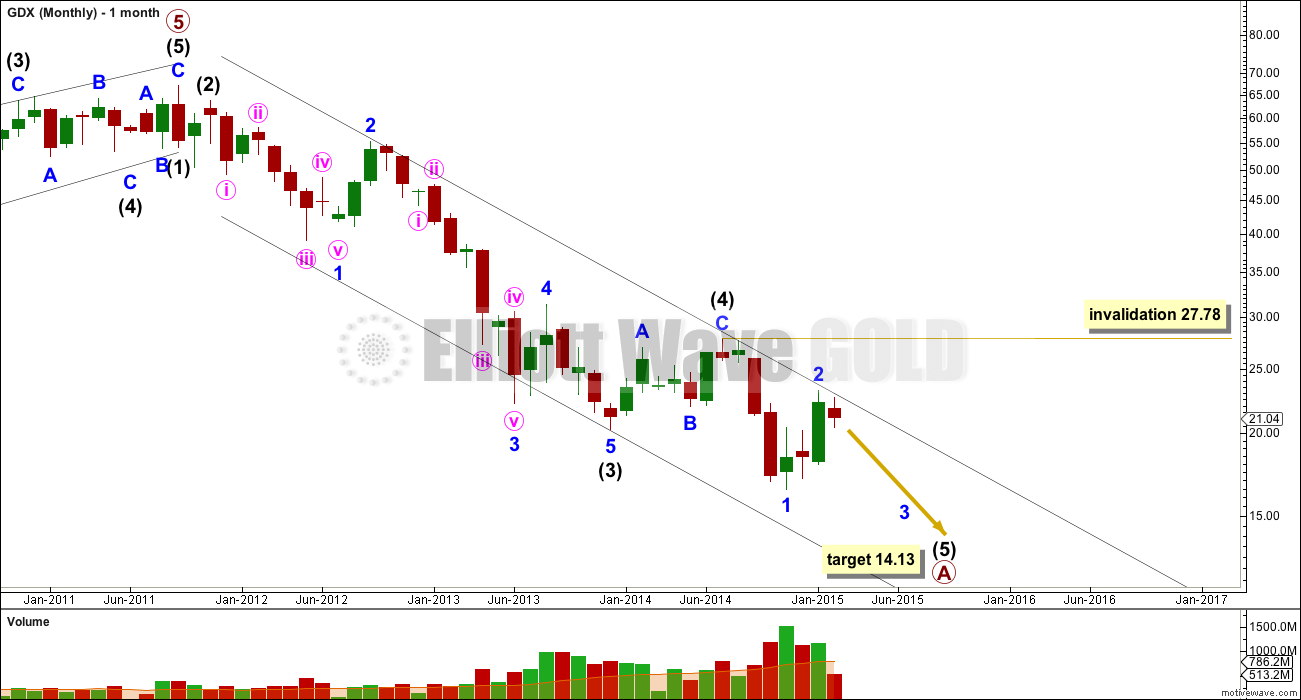
For GDX this downwards movement looks like a developing five as an impulse. The final fifth wave for intermediate wave (5) looks like it is underway.
The channel drawn here is a best fit. The upper edge has recently provided resistance again.
At 14.13 intermediate wave (5) would reach equality in length with intermediate wave (1). However, so far in my analysis of GDX I have noticed it does not reliably exhibit Fibonacci ratios between its actionary waves. This makes target calculation with any reliability impossible for this market. The target at 14.13 is indicative only of a somewhat likely point for downwards movement to end.
Within intermediate wave (5) minor wave 2 may not move beyond the start of minor wave 1 above 27.78.
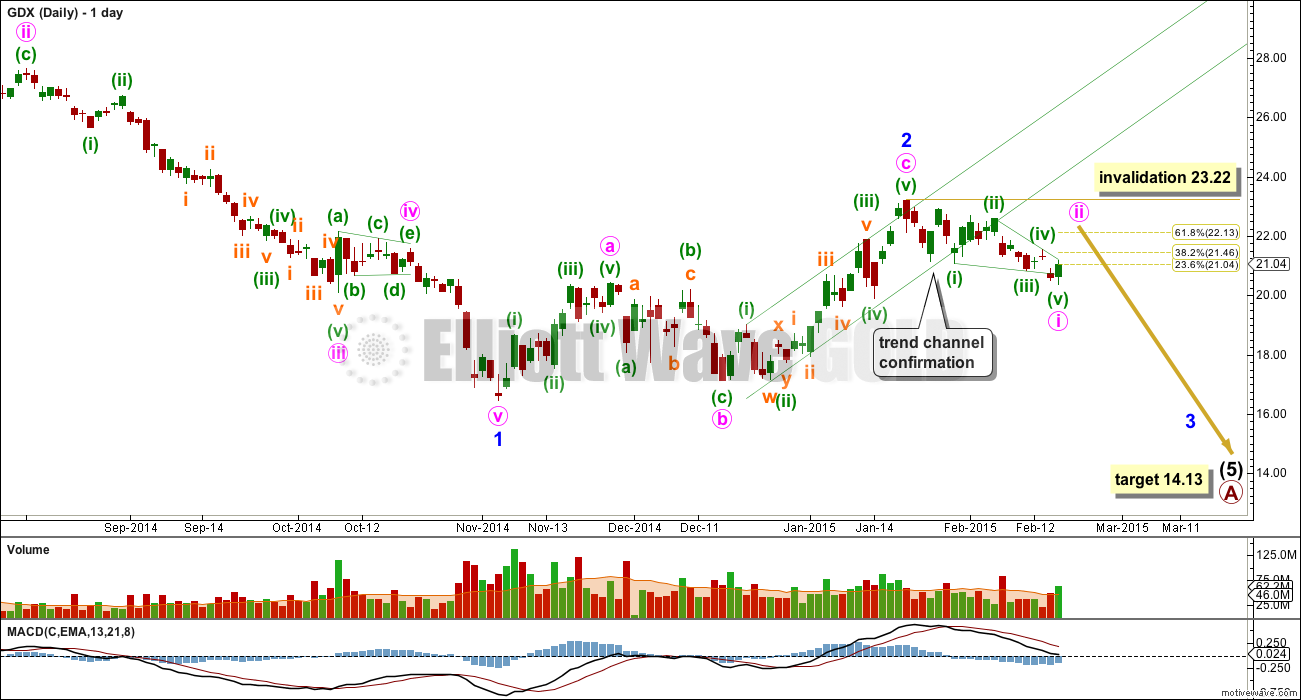
So far within the new downwards movement of minor wave 3, I have tried to see this as either a series of overlapping first and second waves or a completed diagonal. The diagonal has a better fit.
This wave count expects some upwards movement for minute wave ii. Second wave corrections following leading diagonals in first wave positions are often quite deep, at least to the 0.618 Fibonacci ratio and sometimes deeper. I would expect minute wave ii to move higher to 22.13 or above.
Minute wave ii may not move beyond the start of minute wave i above 23.22.


Hi Lara, GDX closed exactly at 20.42 today. This is fascinating!!
Is this a major inflection point, or key support level?
Wondering if you could comment on how this number was derived through your EW/fib calculations with respect to this particular instrument.
Lara, thanks a lot for GDX and Silver analysis added fFree bonuses from your valuable time. It is great to see these fresh analysis.
You are the BEST!
You’re welcome!
Dear Lara,
it seems as the numbered ((ii)) in pink on upper left corner of daily chart, is instead a (4) black, as mentioned on the monthly.
Regards