The data for this market has many gaps, and the structures are not entirely typical looking Elliott wave structures. Although there are some Fibonacci ratios, they are not as prevalent as ratios within Gold. I am only able to import daily data, and I cannot check subdivisions on lower time frames.
While I expect my analysis of GDX will be useful to you, please note that it may not have as good an accuracy rate as what I can achieve for Gold.
Overall the structures and the wave count will be quite different from Gold. Although it looks these two markets have major turns together, the subdivisions within each are quite different.
Click on the charts below to enlarge.
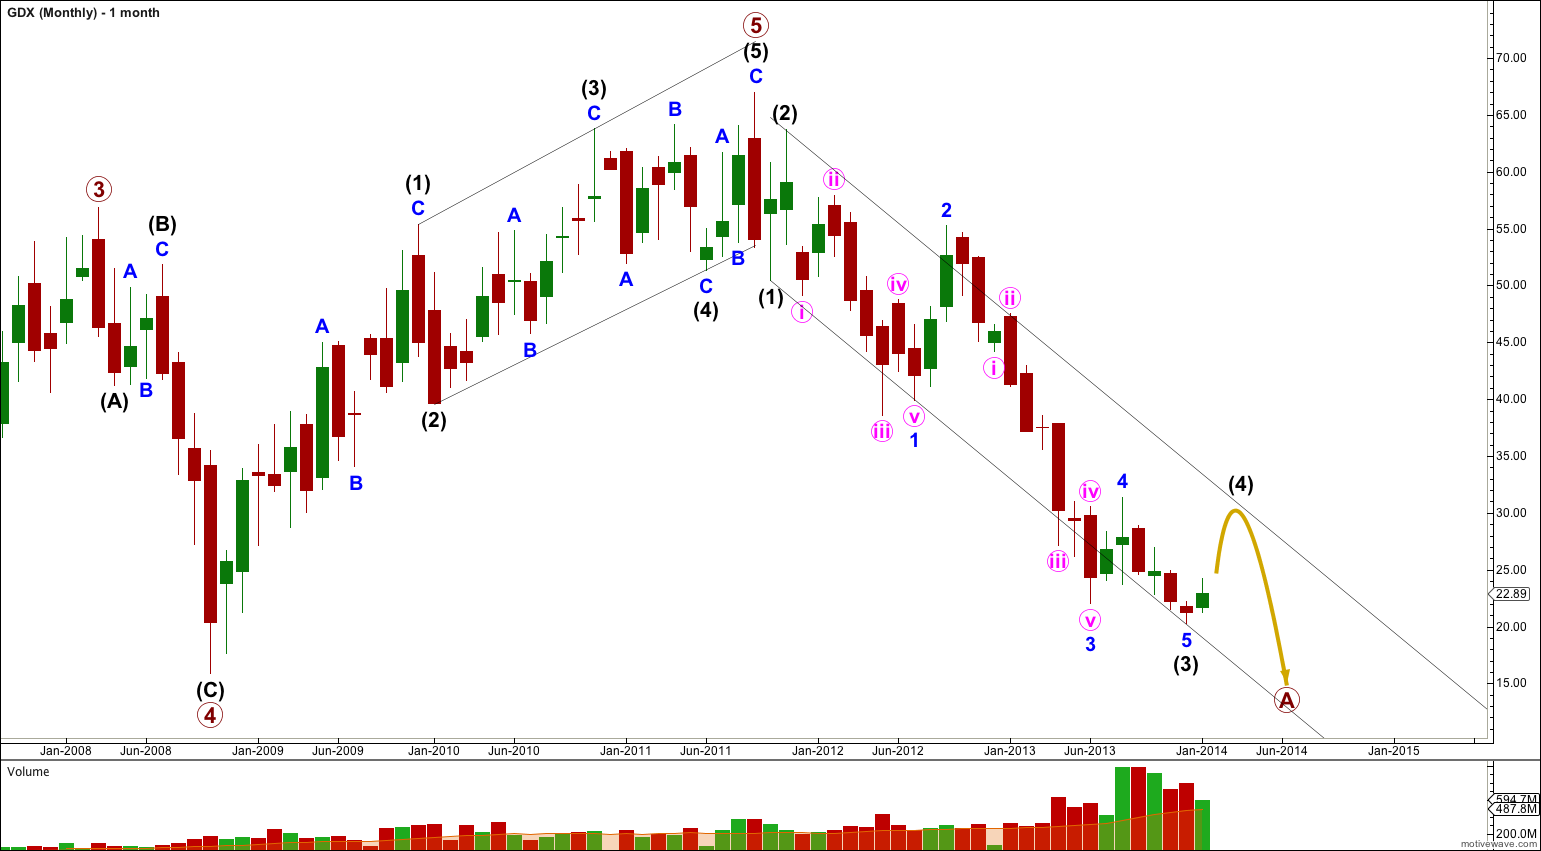
The clearest piece of movement is the downwards movement from the high. This looks most like a first, second and third wave. This may be the start of a larger correction.
Intermediate wave (3) is 10.59 points longer than 2.618 the length of intermediate wave (1).
Within intermediate wave (3) there are no Fibonacci ratios between minor waves 1, 3 and 5.
Ratios within minor wave 1 of intermediate wave (3) are: minute wave iii has no Fibonacci ratio to minute wave i, and minute wave v is 21.90 longer than 0.618 the length of minute wave i.
Ratios within minor wave 3 of intermediate wave (3) are: minute wave iii has no Fibonacci ratio to minute wave i, and minute wave v is 68.72 longer than 0.382 the length of minute wave iii.
Draw a parallel channel about this downwards movement. Draw the first trend line from the lows of intermediate waves (1) to (3), then place a parallel copy upon the high of intermediate wave (2). I would expect intermediate wave (4) to find resistance at the upper edge of the channel, and it may end there.
Intermediate wave (4) should last one to a few months. It may end about the terminus of the fourth wave of one lesser degree at 31.35.
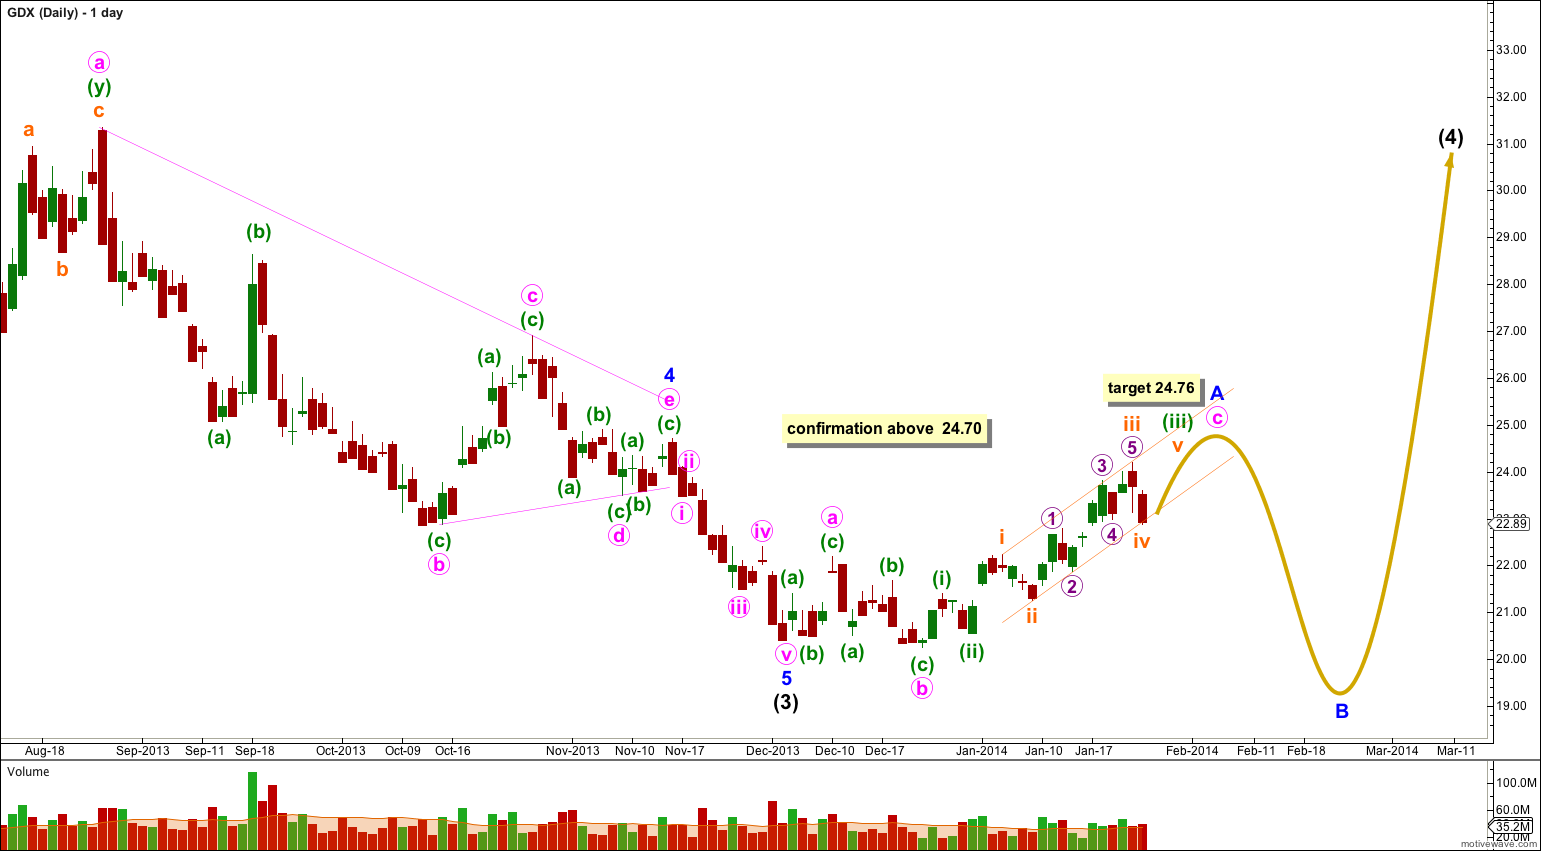
So far within intermediate wave (4) the first wave upwards was a three wave structure, and the next wave down was also a three and made a slight new low. This indicates that a flat correction may be unfolding.
If intermediate wave (4) is a flat correction then within it minor wave A must be a three wave structure. Minor wave A may be unfolding as a flat.
Within this possible flat correction minute wave b is a 113% correction of minute wave a. Minute wave c has passed 1.618 the length of minute wave a and the structure is incomplete. The next target calculation is where minute wave c would reach 2.618 the length of minute wave a at 24.76.
Within minor wave A minuette wave (iv) to come may not move into minuette wave (i) price territory. This wave count is invalidated with movement below 21.40.
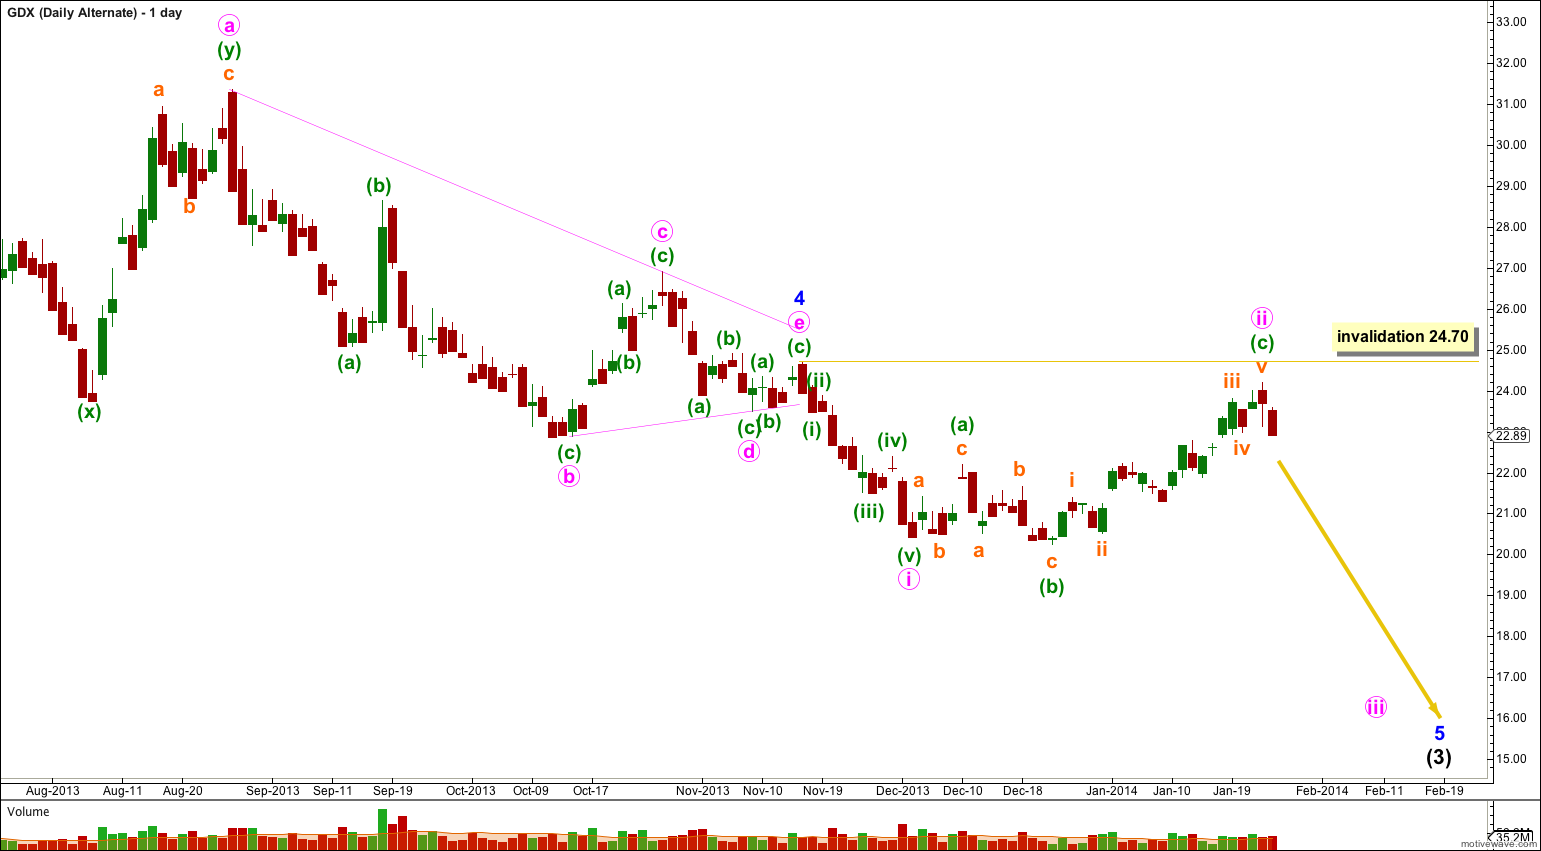
If the degree of labeling within minor wave 5 is moved down one degree then only minute wave i may be complete.
This wave count is now an alternate because the structure within minute wave ii does not fit well. Minute wave ii would have to be over and there is almost no room left for upwards movement. Within minute wave ii the problem is within minuette wave (c).
Subminuette wave iii within minuette wave (c) does not subdivide correctly as an impulse: its fourth wave would overlap back into its first wave price territory, and it’s third wave would be the shortest. It may be that because I cannot see the subdivisions clearly on any time frame lower than daily that there is a solution to these problems, but this is unlikely.
For this reason this alternate has a very low probability. I would expect movement above 24.70 to invalidate this alternate within a few days to two weeks.


I’ve just spent hours on SPX analysis.
No more today.
I have a bunch of TA reading to do tomorrow so probably no GDX tomorrow either.
Maybe Monday (your Sunday).
Hi Lara , thank you for the GDX count . Today is the 28 Feb 2014 and GDX has gone to almost 27 . It looks like it is following Gold , with a top, pink circled ii in sight or done . It is also following your above second chart , the Daily Main count . Will appreciate to know if you have any further thoughts on this ..The bulls have gone over bullish on Gold and GDX , without suspecting a possible deep B wave down in both Gold and GDX . You may have nailed it , we ‘ll see .
I also want to say “Thanks” for the GDX chart. The extra effort is really appreciated!
your’re welcome!
You’re welcome.
Love this GDX analysis as I only play significant swings on Gold and Silver Miner ETFs. Thank you Lara, as usual you are the Best Elliott Wave analyst!