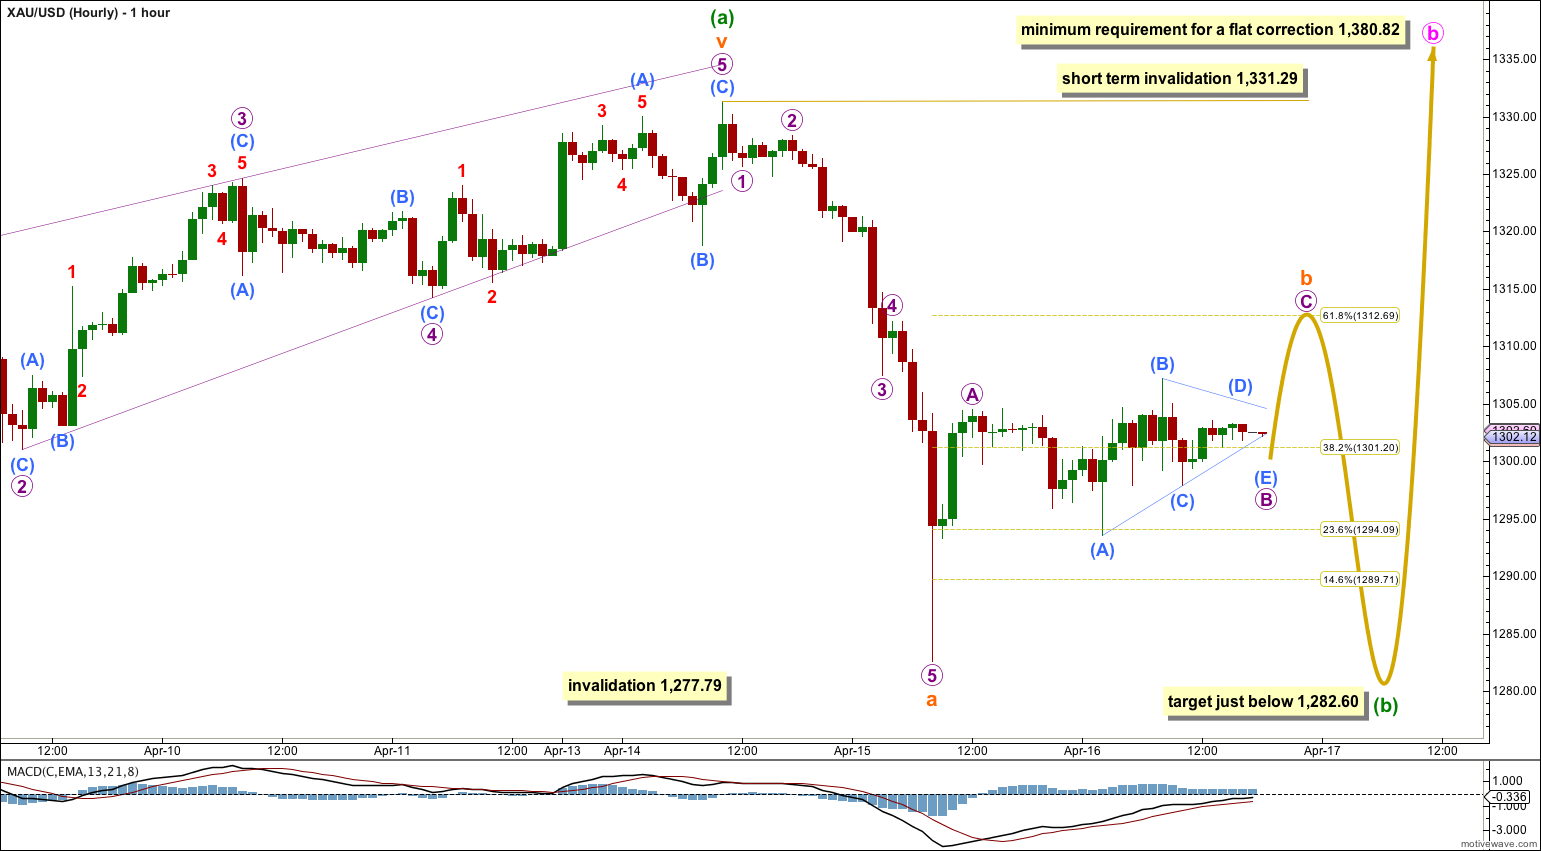
Yesterday’s analysis expected a little upwards movement before a new low below 1,282.60, but not below 1,277.79. Price has moved sideways in a small range to complete a small red doji candlestick.
The wave count remains valid and the same.
Summary: This downwards movement is still an incomplete correction against the current short term upwards trend. In the very short term I expect a little more upwards movement to about 1,313, to be then followed by a slight new low below 1,282.60 but not below 1,277.79.
This analysis is published about 8:45 p.m. EST. Click on charts to enlarge.
Gold is still within a large fourth wave correction at primary wave degree which is incomplete.
Primary wave 2 was a rare running flat. Primary wave 4 is unlikely to be a flat correction because it is likely to show structural alternation with primary wave 2.
Primary wave 4 is most likely to be completing as a double combination: zigzag – X – second structure. The second structure labeled intermediate wave (Y) is most likely to be a flat correction. Within the flat correction minor wave B must reach a minimum 90% the length of minor wave A at 1,201.98.
Overall the structure for primary wave 4 should take up time and move price sideways, and the second structure should end about the same level as the first at 1,434. Primary wave 4 may not move into primary wave 1 price territory. This wave count is invalidated with movement above 1,532.90.
Within intermediate wave (Y) minor wave B downwards is an incomplete corrective structure: either a flat correction (main hourly wave count) or a double zigzag (alternate hourly wave count). Minor wave B should continue for a few more weeks and may make a new low below 1,180, and is reasonably likely to do so in coming weeks.
This main wave count follows the idea that minor wave B may be unfolding as a flat correction. Within the flat correction minute wave a subdivides as a single zigzag. Minute wave b within the flat must reach a minimum of 90% the length of minute wave a at 1,380.82.
Minute wave b is most likely to subdivide as a single or double zigzag in order to reach 1,380.82.
Within a zigzag minuette wave (a) must subdivide as a five wave structure. It fits best as a complete impulse.
Minuette wave (a) may have lasted nine days. I would expect minuette wave (b) to last at least three days, and maybe up to eight or nine days. So far it has lasted three days and the structure is incomplete.
So far minuette wave (b) looks like it is completing as a zigzag. Within it subminuette wave a subdivides best as an impulse. Subminuette wave b upwards is still incomplete. The sideways movement for Wednesday’s session may be a triangle completing as micro wave B within subminuette wave b, or it may yet morph into a double combination for micro wave B within subminuette wave b. When this sideways movement is complete I would expect price to break out of this range for a short upwards thrust. Subminuette wave b may end about 1,312.69, the 0.618 Fibonacci ratio of subminuette wave a.
When subminuette wave b is complete then subminuette wave c downwards should make a new low below subminuette wave a at 1,282.60 to avoid a truncation.
If the upper invalidation point is breached within the next one or two days (before we see a new low below 1,282.60) then my analysis of subminuette wave a down as a five wave impulse is incorrect. It could be a completed three which may be minuette wave (b) in its entirety, or may only be subminuette wave a of a flat correction or double combination for minuette wave (b).
Minuette wave (b) may not move beyond the start of minuette wave (a) below 1,277.79.
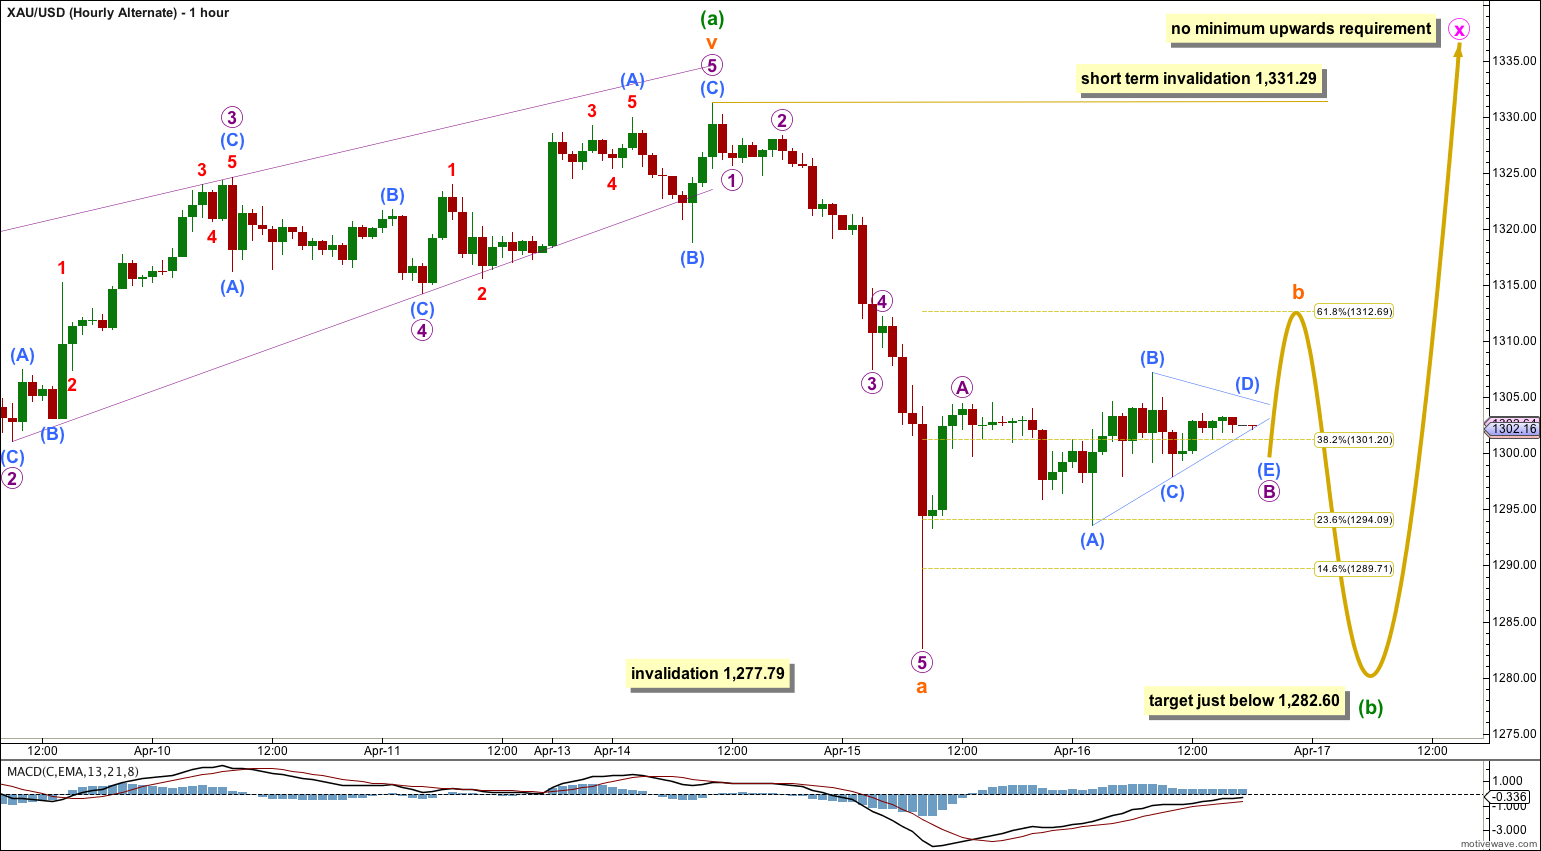
Alternate Hourly Wave Count.
This alternate wave count follows the idea that minor wave B downwards may be unfolding as a double zigzag. The first zigzag downwards is labeled minute wave w. The double should be joined by a “three” in the opposite direction which may subdivide as any corrective structure labeled minute wave x.
At this stage this alternate wave count is again the same as the main wave count with the sole exception of minute wave x not requiring a minimum upwards length.
Minuette wave (b) may not move beyond the start of minuette wave (a) below 1,277.79.
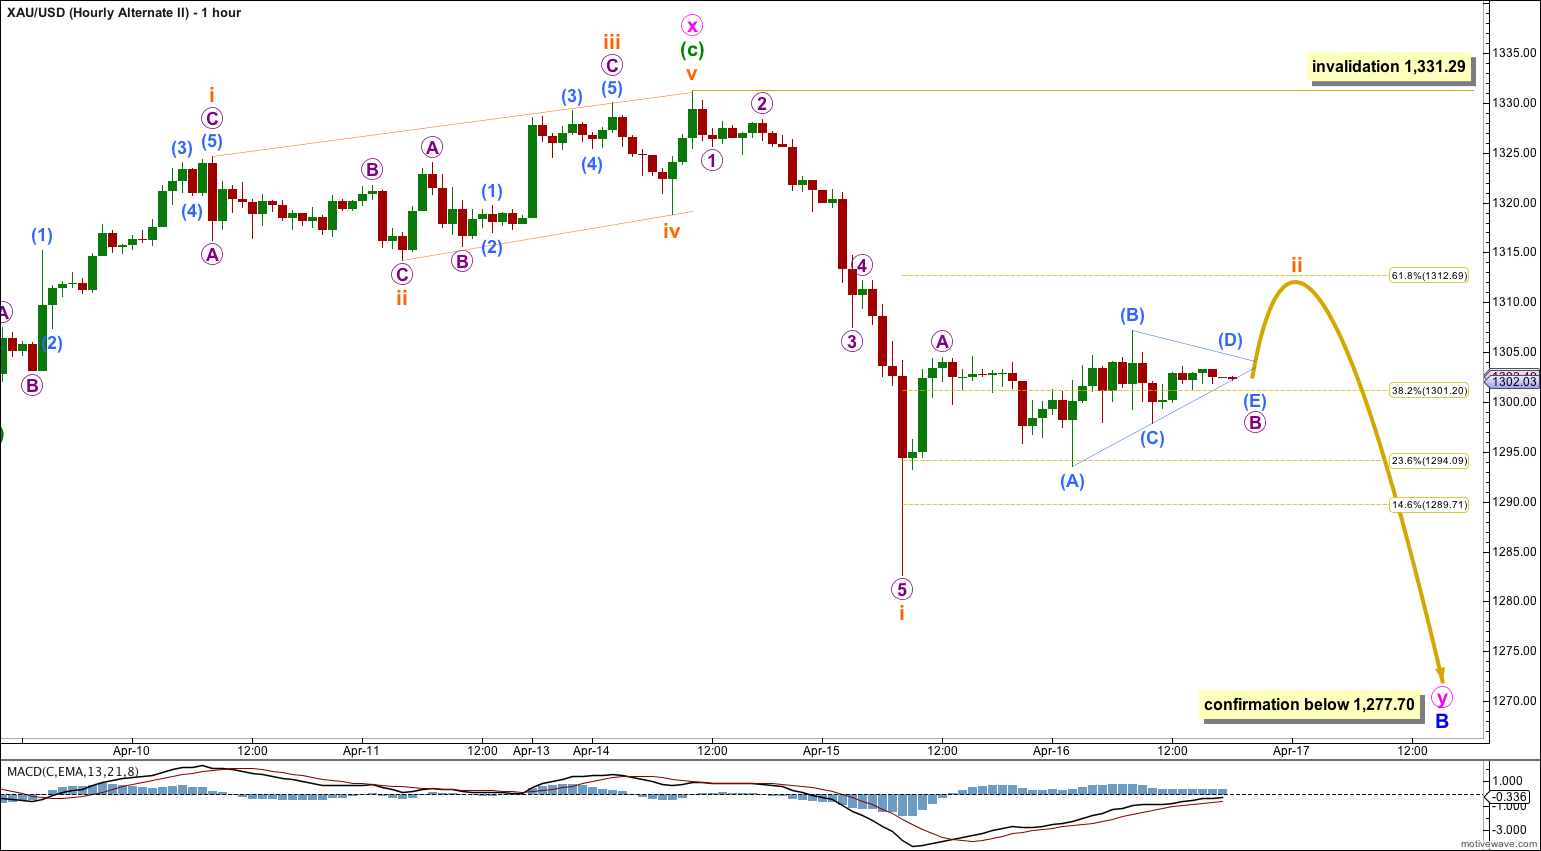
I want to consider the idea that my analysis of minuette wave (a) upwards as a five wave impulse could be wrong. I want to look at the possibility that this upwards wave may be a three wave structure, in which case it may fit best as a single zigzag. If it is a zigzag then it may be a complete minute wave X within a larger double zigzag down for minor wave B.
In trying to see upwards movement as a three wave structure there has to be an ending diagonal for minuette wave (c) which has to begin at 1,301.02 as labeled. This diagonal does not have the “right look”; it is neither expanding nor contracting. Within the diagonal the fourth wave is longer than the second, but the fifth wave is shorter than the third which is shorter than the first. The trend lines are mostly parallel, with only a very slight convergence.
The problem of the wave lengths within this possible ending diagonal reduce the probability of this wave count significantly. It is possible, but it is very unlikely.
If minute wave X is a completed zigzag then minute wave y downwards has begun. Minute wave y must subdivide as a single zigzag. Within it subminuette wave ii may not move beyond the start of subminuette wave i above 1,331.29.
If price moves below 1,277.70 in the next few days this is the wave count I would use.


That’s interesting. I rarely look at other EW counts from other Ellioticians. I find it removes my objectivity. So I had no idea I was one of the few predicting new highs.
I’ll hold to that though. It’s not impossible that I’m wrong (of course, sometimes I am wrong) but at this stage I have some confidence we should see new highs because no matter how I analyse that last upwards movement of minuette wave (a) is subdivides so nicely as a five, and does not fit as well as a corrective structure.
I hope I’m right.
Lara once Gold drops to $1,282.60 – 1,277.79 in 1 to 5 days, Gold will have formed a recent double bottom as well as Sentiment lows for both Gold and Silver. Your forecast shows almost $100 from there up to $1,380.82 b circle. I just bought a miners ETF at it’s lowest price in April and looking to hold it and sell it at 1,380.82.
Lara, you are one of the very few actually forecasting a rally may happen and you have forecasted the $1,380.82 target all month so you must be very confident of it!
very complex, best way to trade this correction is stay away, trade after clearity emerge in wave counts, i am trying to subscribe your service, meanwhile any important counts please post here, and oblige me
I agree. Which is why I’ve been trying to make it clear that this is a correction against the trend, and as it’s a B wave there is a huge amount of variation in how it may unfold.
The trend is your friend. Trying to trade against the trend does not usually end well.
Lara, at what level do you consider a trend safe to trade? There are trends within trends / waves within waves. At what level is the trend established?