Sideways movement continues. The short term picture at the hourly chart level is now changed with changing market conditions. With the high remaining in place, the main wave count is the same at the daily chart level.
Summary: The main wave count expects a trend change to a new bear market to last one to several years, and the target is 470.
Full confidence may be had in the new bear market if price can make a new low below 1,236.54 in the next few weeks.
An alternate expects overall upwards movement from here. It would be confirmed if price makes a new high reasonably above 1,357.09.
New updates to this analysis are in bold.
Last historic analysis with monthly charts is here. Video is here.
Another alternate monthly chart is here.
Grand SuperCycle analysis is here.
MAIN ELLIOTT WAVE COUNT
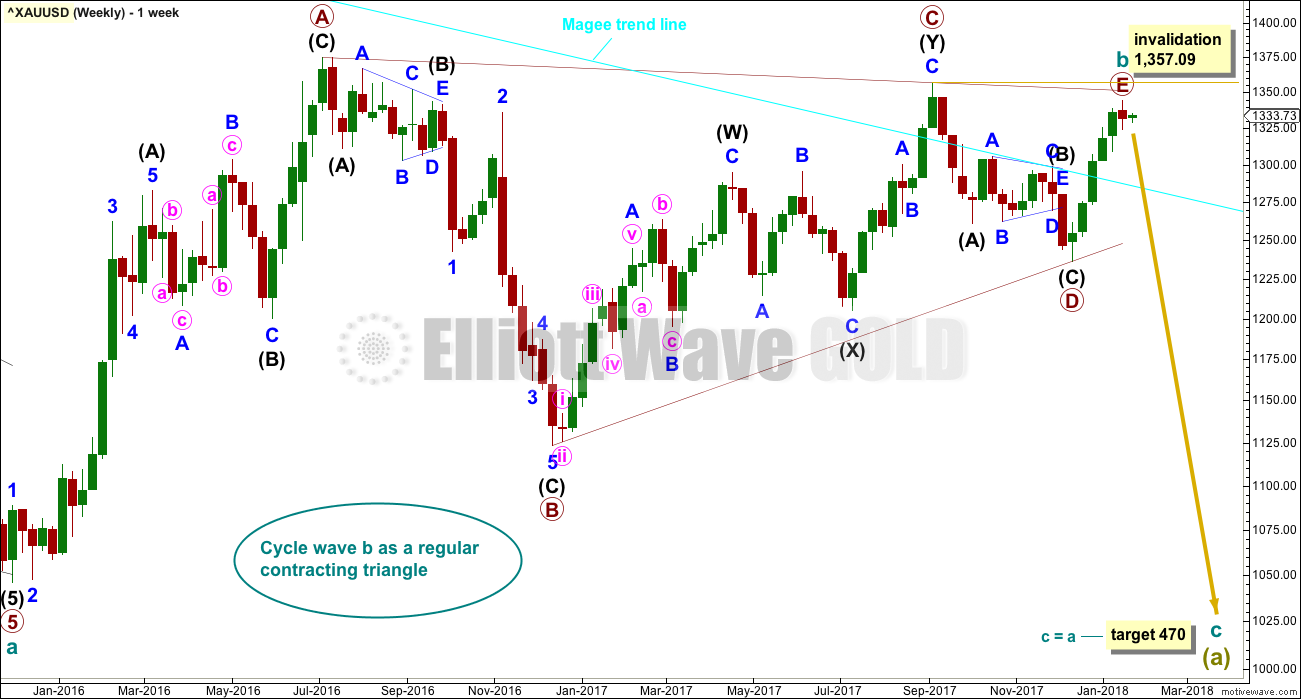
WEEKLY CHART
All main wave counts expect that Gold completed a large five down from the all time high in November 2011 to the low of December 2015, which is seen on the left hand side of weekly charts.
If this analysis is correct, then the five down may not be the completion of the correction. Corrective waves do not subdivide as fives; they subdivide as threes. The five down is seen as cycle wave a within Super Cycle wave (a).
Cycle wave b began in December 2015.
This wave count looks at cycle wave b to be most likely a regular contracting triangle.
All sub-waves must subdivide as threes within an Elliott wave triangle, and four of the five sub-waves must be zigzags or multiple zigzags, and the most common sub-wave to be a multiple is wave C. Only one sub-wave may be a more complicated multiple. This triangle meets all these rules and guidelines; all subdivisions fit perfectly at all time frames. It is the main wave count for these reasons, and thus is judged to have the highest probability.
The triangle trend lines have a normal looking convergence.
While primary wave E should also most likely look like an obvious three wave structure at the weekly and daily chart levels, it does not have to do this. It is possible that primary wave E could be over, falling reasonably short of the A-C trend line and being relatively quick. E waves of triangles can be the quickest of all triangle waves.
DAILY CHART
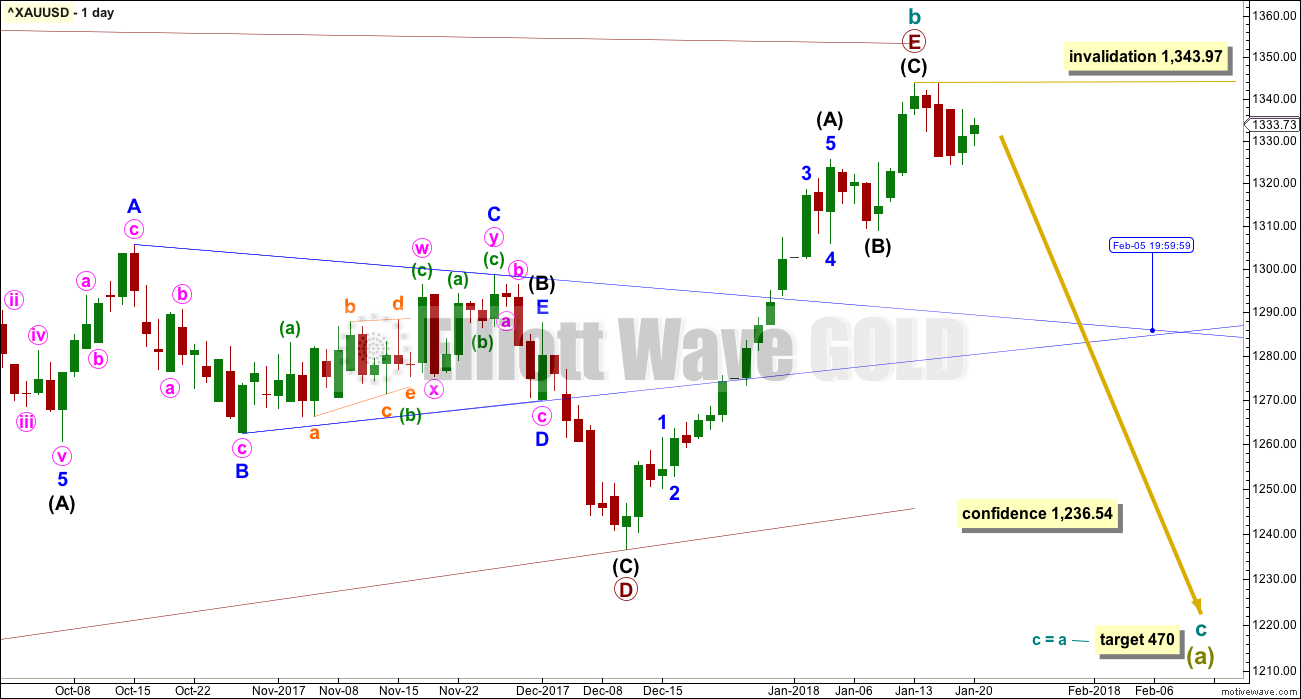
This first daily chart follows on directly from the weekly chart above. The triangle for cycle wave b may have just recently completed.
Primary wave E fits as a completed zigzag and falls reasonably short of the A-C trend line, the most common point for E waves of Elliott triangles to end.
If this wave count is correct, then price needs to move strongly lower next week. Within the new trend, no second wave correction may move beyond the start of its first wave above 1,343.97.
The target for cycle wave c to end assumes the most common Fibonacci ratio to cycle wave a.
A new low below 1,236.54 would invalidate weekly alternate wave counts and provide a high level of confidence in this main wave count.
HOURLY CHART
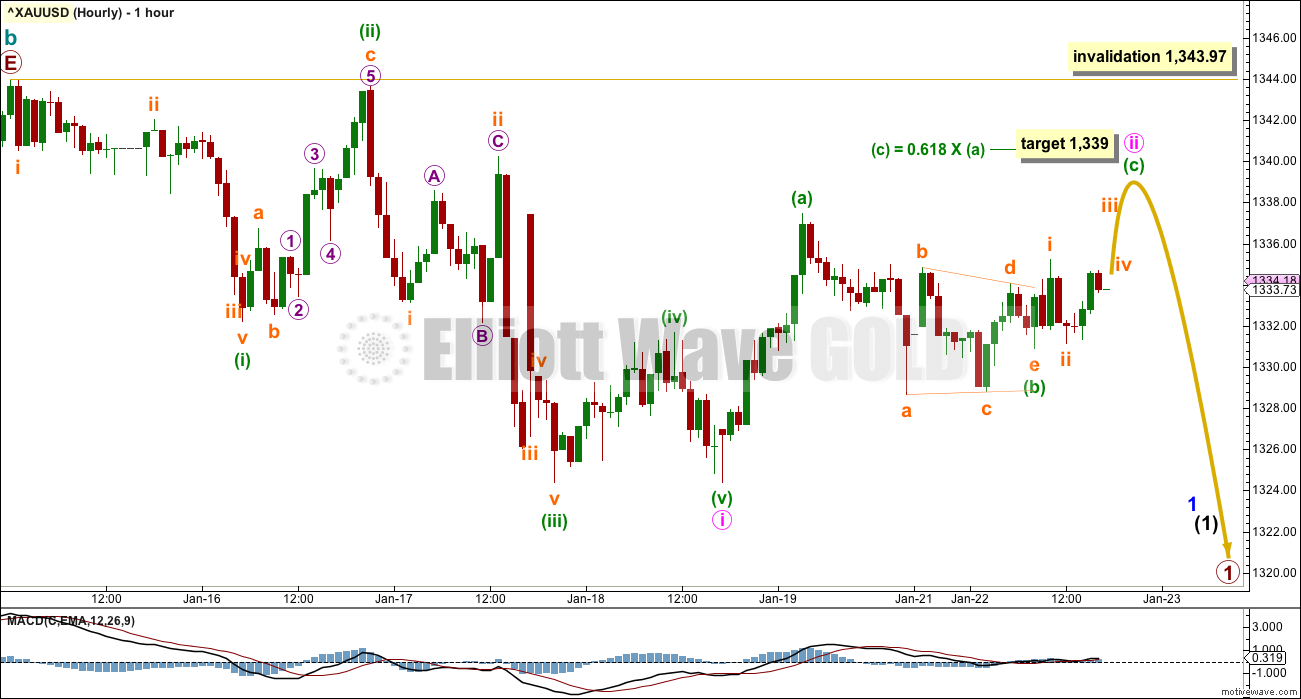
The duration of current sideways movement now looks to be too large to be a lower degree correction. Analysis of recent movement from the last high is changed today.
There may have been a first wave down complete at the last small swing low labelled minute wave i.
Current sideways movement may be part of minute wave ii.
Gold very commonly exhibits very deep second wave corrections for a new trend. Minute wave ii is already deeper than the 0.618 Fibonacci ratio of minute wave i and the structure is incomplete. If minuette wave (c) were to reach equality in length with minuette wave (a), then minute wave ii would break the Elliott wave rule stating it may not move beyond the start of minute wave i above 1,343.97. The target calculated for minuette wave (c) uses the next likely Fibonacci ratio.
When minute wave ii is a complete zigzag, then the next wave down for minute wave iii would be expected to exhibit an increase in downwards momentum.
SECOND WAVE COUNT
WEEKLY CHART
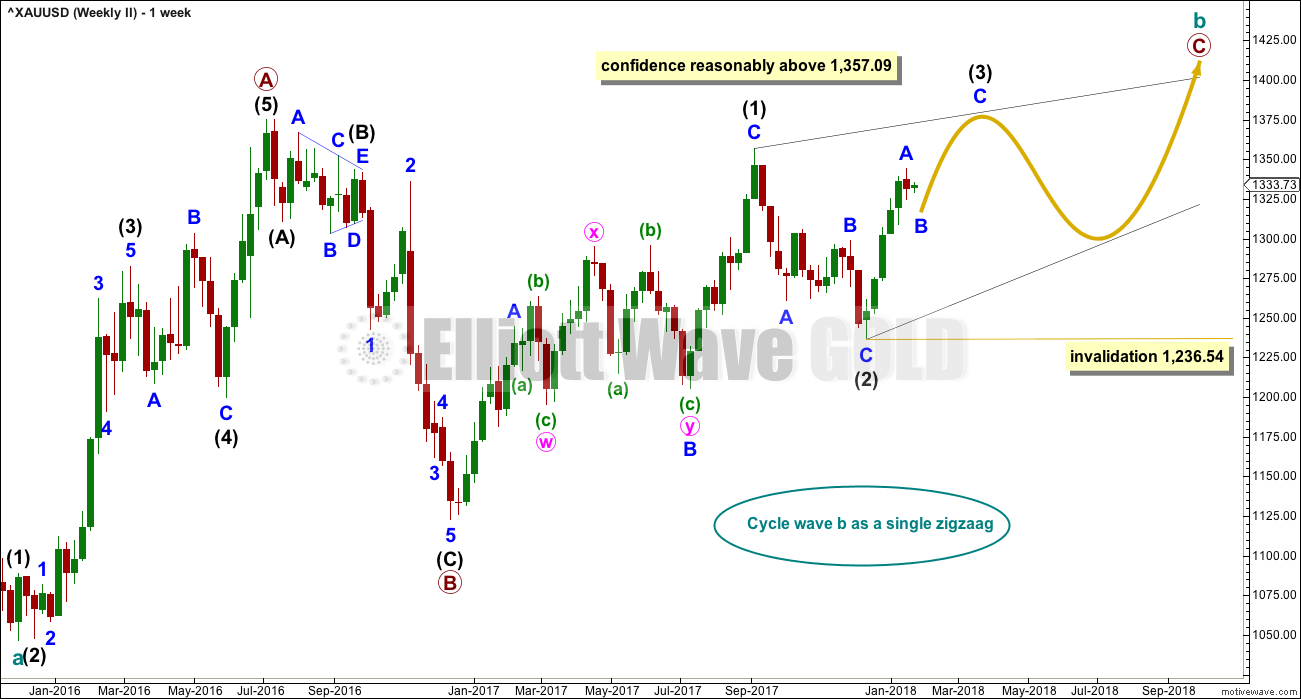
If cycle wave b is a single zigzag, then the upwards wave labelled here primary wave A must be seen as a five wave structure. But this is problematic because (within primary wave A) intermediate wave (4) lasted 12 weeks whereas intermediate wave (2) only lasted 2 weeks. While disproportion between corrective waves does not violate any Elliott wave rules, it does give a wave count the wrong look.
Gold is typical of commodities in that it often exhibits swift strong fifth waves, leading to blowoff tops in bull markets and selling climaxes in bear markets. This tendency is most often seen in Gold’s third waves. When this happens the strong fifth wave forces the fourth wave correction that comes before it to be more brief and shallow than good proportion to its counterpart second wave would suggest. When this happens the impulse has a curved three wave look to it at higher time frames.
It is acceptable for a wave count for a commodity to see a curved impulse which has a more time consuming second wave correction within it than the fourth wave correction.
The impulse has a more time consuming fourth wave than the second in this case though, giving the wave the look of a zigzag. This is unusual, and so the probability of this wave count is low.
Low probability does not mean no probability, so this wave count is possible; when low probability outcomes do occur, they are never what was expected as most likely.
Primary wave C must subdivide as a five wave structure, either an impulse or an ending diagonal. Because the upwards wave of intermediate wave (1) fits as a zigzag and will not fit as an impulse, an ending diagonal is considered.
Ending diagonals require all sub-waves to subdivide as zigzags.
Within intermediate wave (1), to see this wave as a zigzag, minor wave B is seen as a double flat correction. In my experience double flats are extremely rare structures, even rarer than running flats. The rarity of this structure further reduces the probability of this wave count.
Intermediate wave (3) must move beyond the end of intermediate wave (1) above 1,357.09.
Intermediate wave (3) must subdivide as a zigzag. Within the zigzag, minor wave B may not move beyond the start of minor wave A below 1,236.54. At this stage, the last four days of sideways movement look like a correction within an ongoing upwards trend which would favour this alternate wave count. Minor wave B may last from just a few days to a few weeks.
THIRD WAVE COUNT
WEEKLY CHART
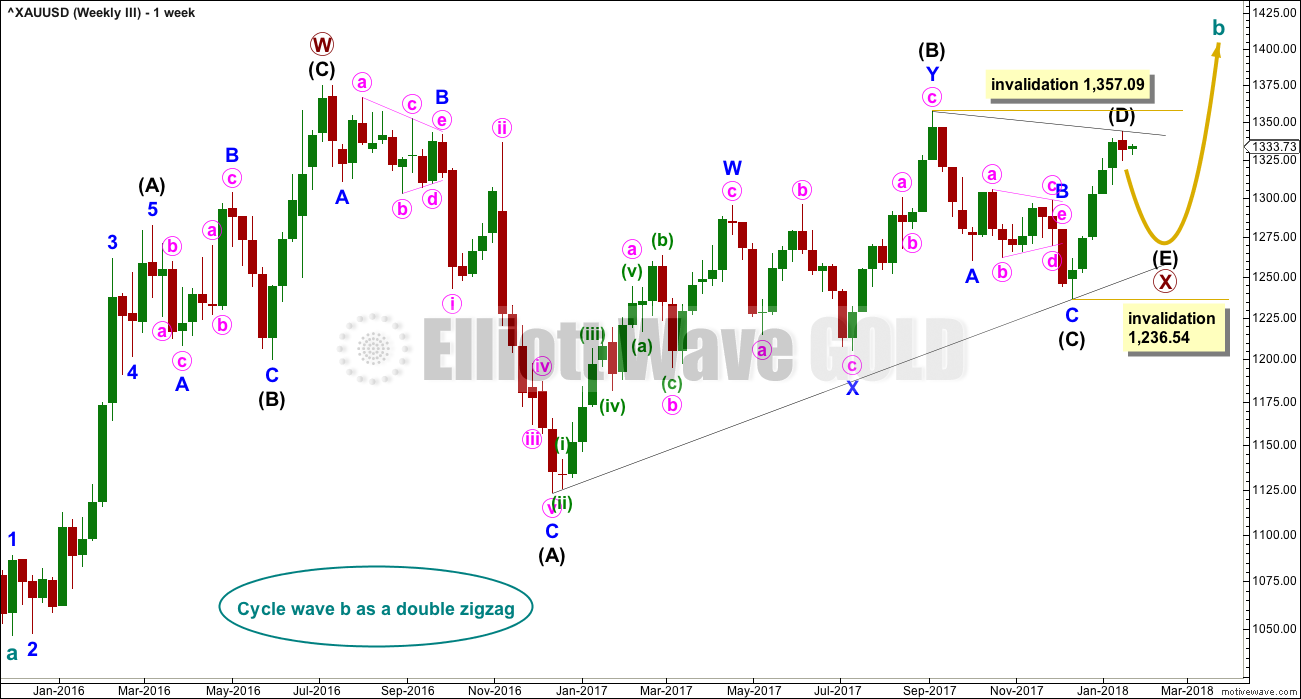
Cycle wave a is still seen as a completed five wave structure. This third wave count looks at cycle wave b as a possible double zigzag.
A triangle may be completing as an X wave within a double zigzag for cycle wave b.
Now the upwards wave labelled here primary wave W is seen as a zigzag. This has a better fit than the first alternate.
Within the triangle for primary wave X, intermediate waves (A) through to (C) may be complete. Intermediate wave (D) may also be complete, but there is room for it to still move higher. If the triangle for primary wave X is a regular contracting triangle, then intermediate wave (D) may not move beyond the end of intermediate wave (B) above 1,357.09. If the triangle is a barrier triangle, then intermediate wave (D) should end about the same level as intermediate wave (B), so that the (B)-(D) trend line remains essentially flat. In practice, this means that intermediate wave (D) may end slightly above 1,357.09 and this wave count would remain valid.
This is why a new high reasonably above 1,357.09 only would invalidate this wave count. This invalidation point is not black and white.
The final sub-wave of intermediate wave (E) may have now begun. Intermediate wave (E) may not move beyond the end of intermediate wave (C) below 1,236.54. This invalidation point is black and white. A new low by any amount at any time frame would invalidate this wave count.
TECHNICAL ANALYSIS
WEEKLY CHART
Click chart to enlarge. Chart courtesy of StockCharts.com.
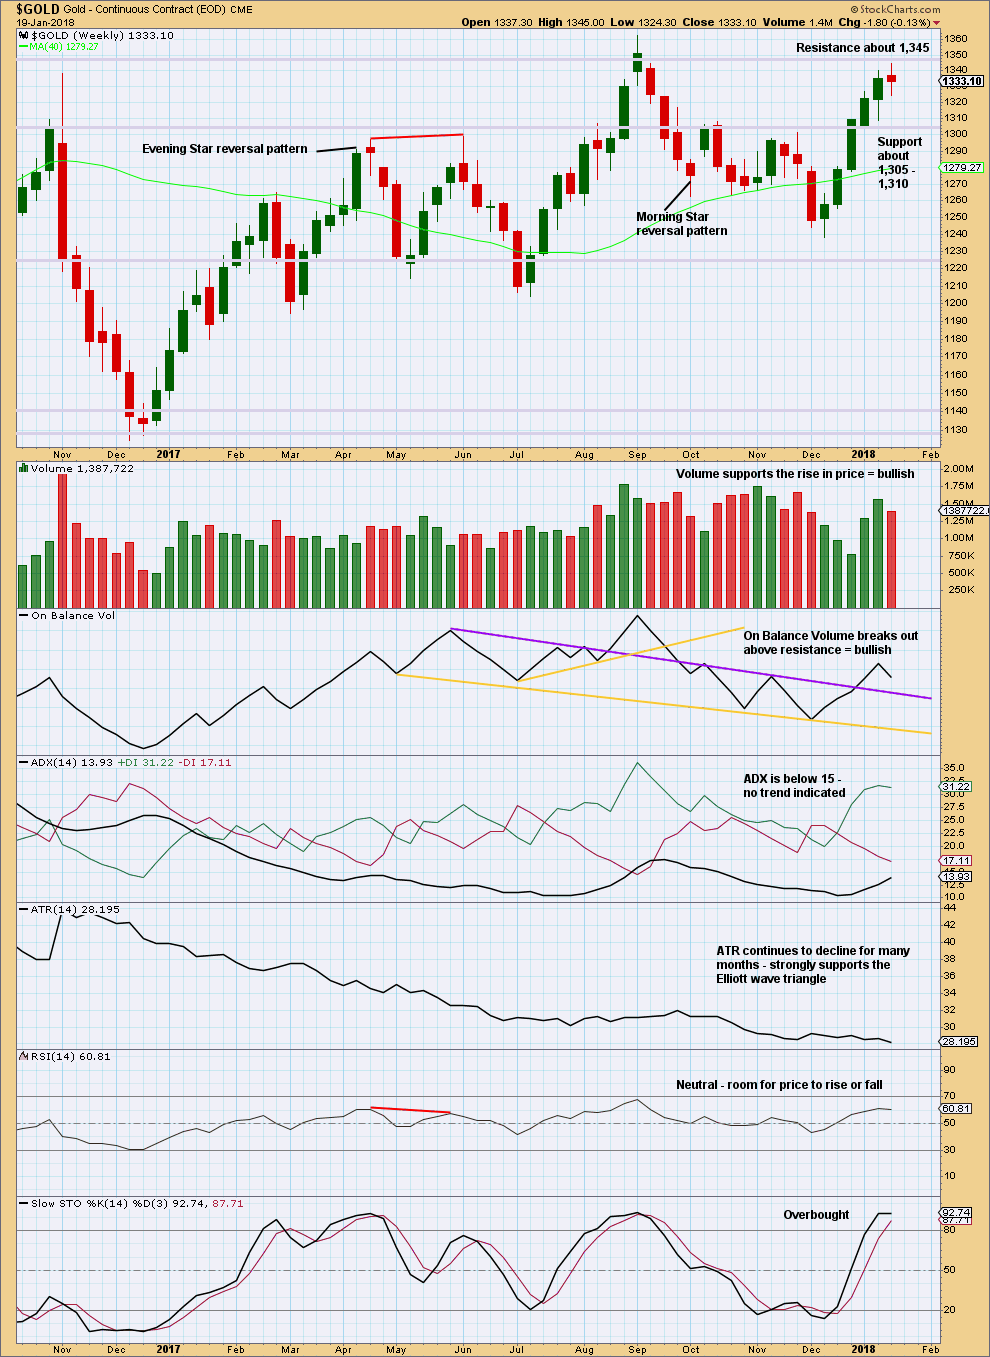
Price found resistance last week, at about 1,345.
The small spinning top candlestick and decline in volume suggest a pause within an upwards trend, or a weak end to the upwards trend.
Stochastics may move further into overbought territory before price turns.
DAILY CHART
Click chart to enlarge. Chart courtesy of StockCharts.com.
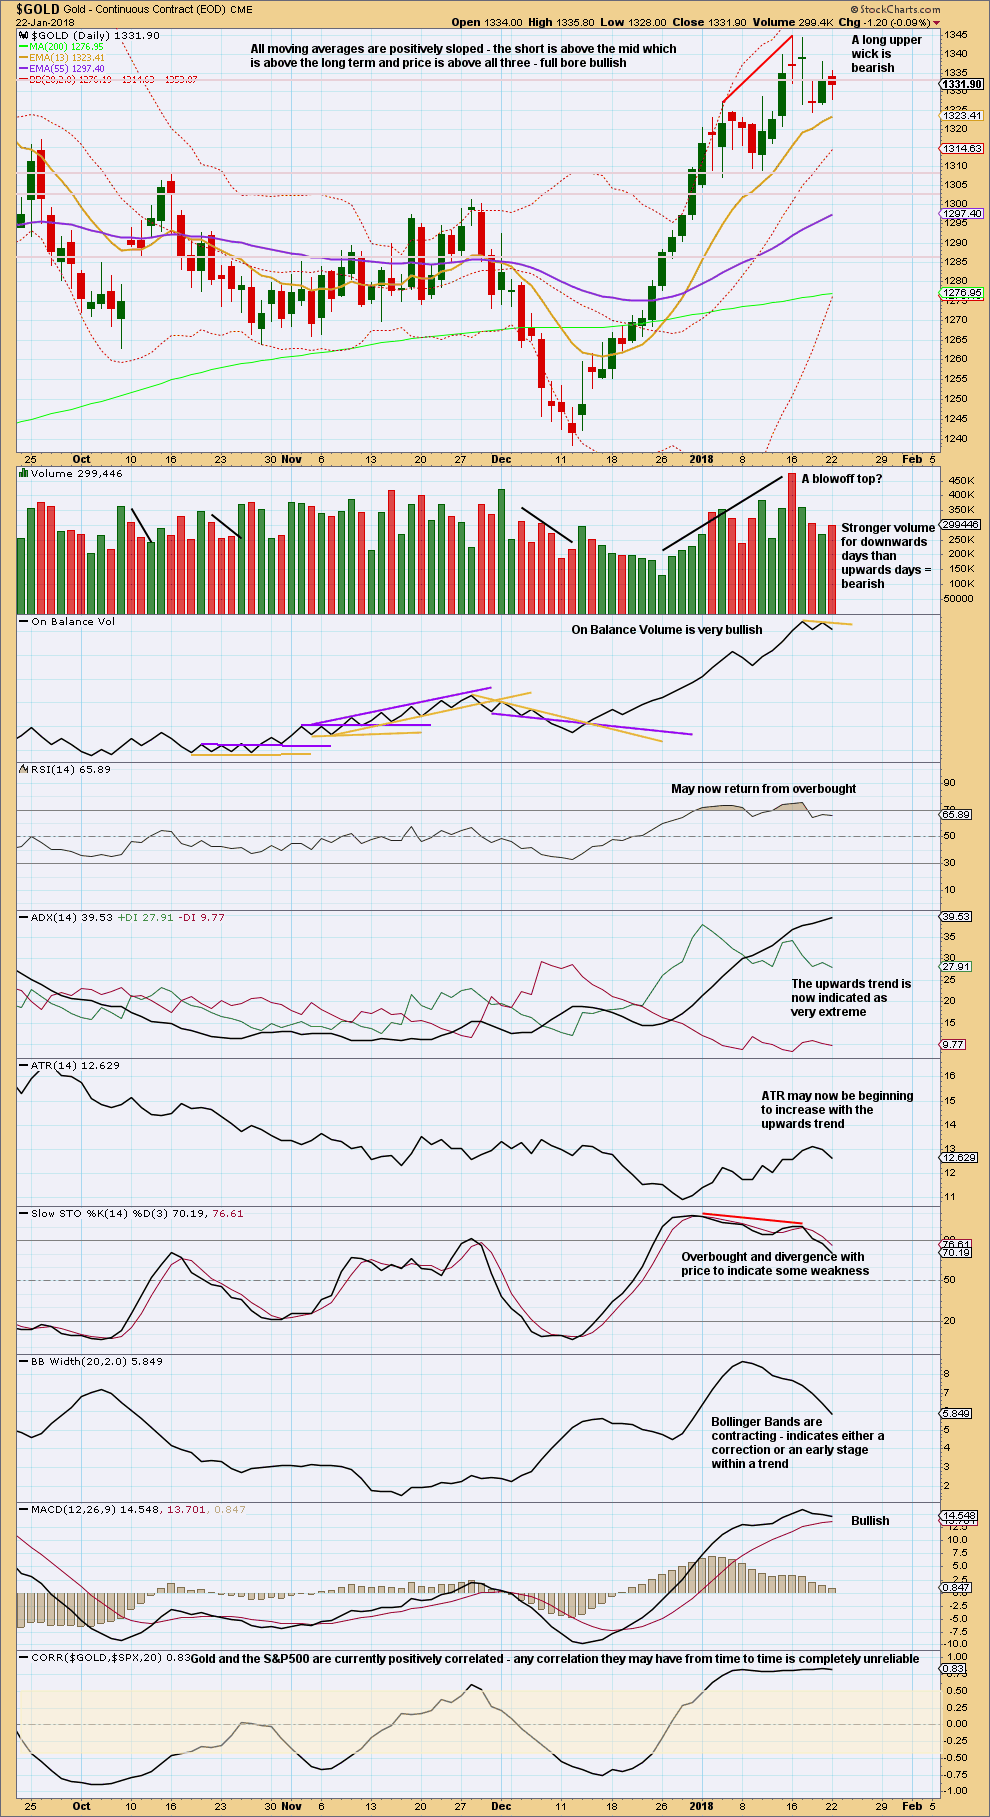
The very short term volume profile now looks a little more bearish, with some increase in volume for the last downwards session and reasonable volume for the first downwards session.
It still looks like a small flag pattern may be forming though. Flag patterns are continuation patterns, and this view would favour the second weekly chart, which is bullish.
GDX DAILY CHART
Click chart to enlarge. Chart courtesy of StockCharts.com.
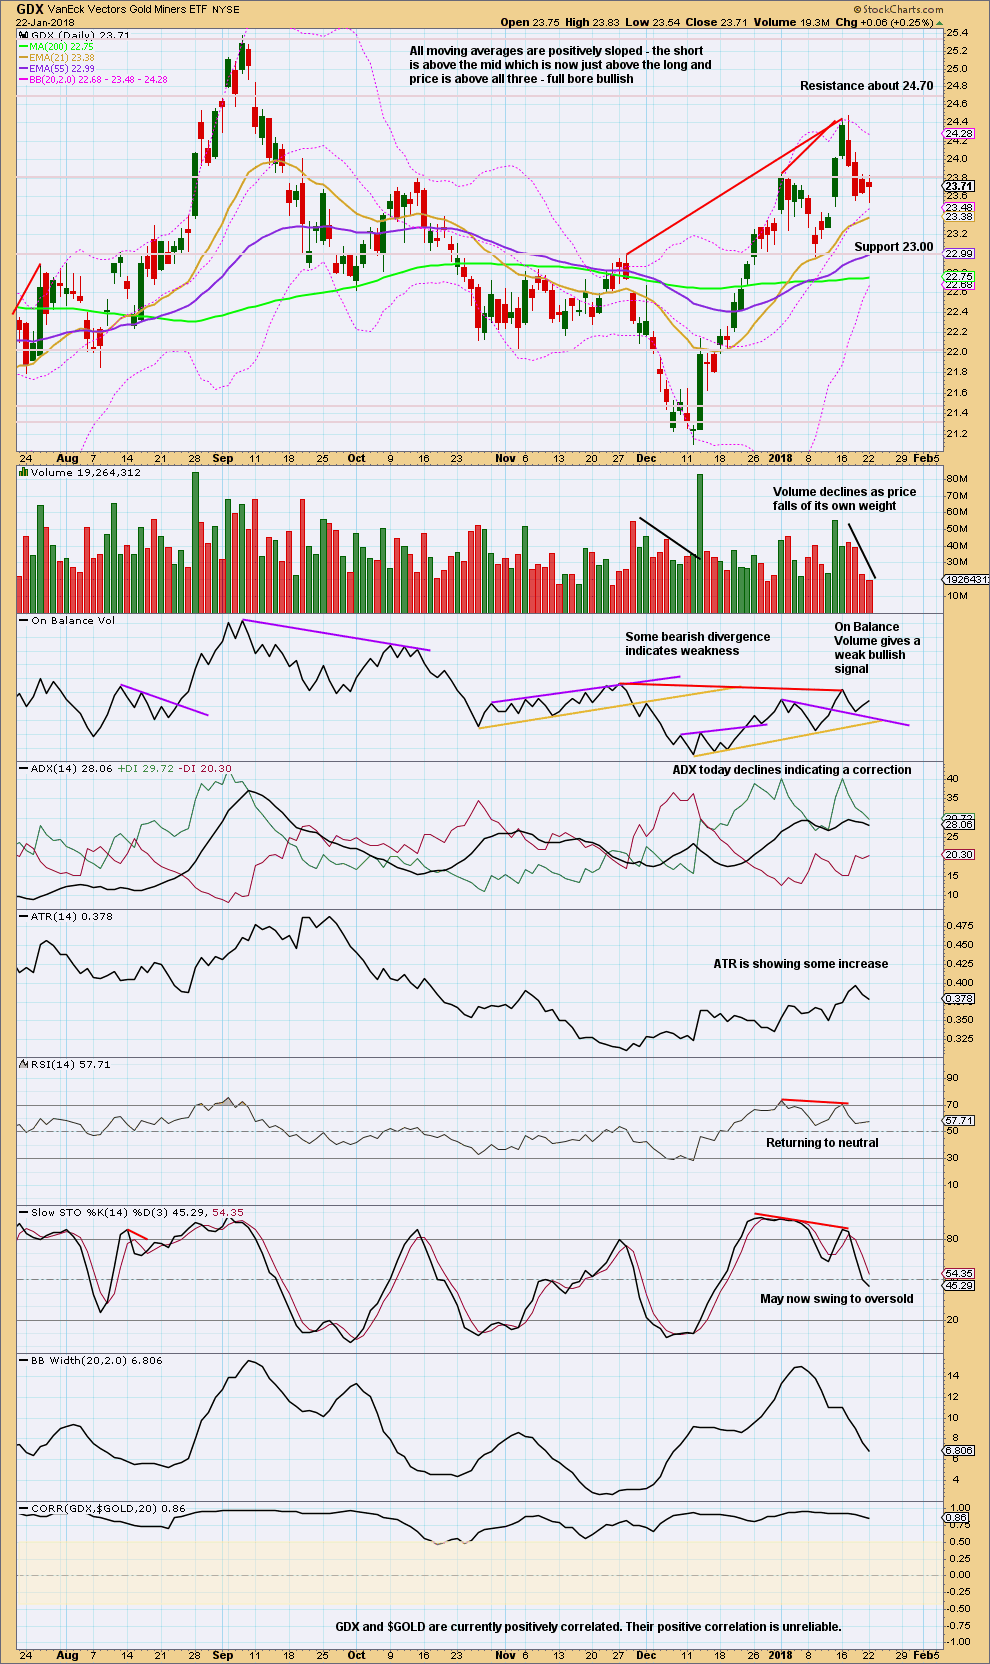
It looks like price may have turned for GDX. Look for price to move lower to support while Stochastics moves lower towards oversold. Look for next support about 22.00.
Published @ 06:24 p.m. EST.

Hi Lara,
something on the setup has changed, where can I find the Oil update?
Thanks Ursula
The “Categories” list on the right hand side was changed into a drop down box. All of the categories, including US Oil are still there.
I updated Oil early, at the end of the week and put it within the new trial for a once a week update.
I’ll update it again at the end of this week.
IMO that would be better for traders as I can then analyse a full weekly candlestick, rather than doing it part way through the week.
So far so good…. an ending diagonal for minuette (c) and the target almost hit so a Fibonacci ratio between minuette waves (a) and (c)
When the best fit channel is breached by downwards movement we may have confidence minute ii is over and a third wave is underway
Hi Lara,
In the Elliott Wave Principle (10th edition) it states on p.37 that all the waves in a diagonal are all “threes”, but then goes on to illustrate on the same page an ending diagonal clearly showing a 5-wave wave 5. How do we square this and are all the subminuette waves in minuette (c) above three waves?
I think you’re referring to the diagrams on page 37?
The diagonals shown are all in fifth wave positions.
And for both the bull and bear diagonal examples, in the diagrams, all their sub-waves are threes.
I think you may be confusing the five wave impulse with the diagonal? The diagonals in the diagrams are only the fifth waves.
Each diagram shows an entire impulse, and within that impulse each fifth wave is a diagonal.
Got you! Thanks.
Most excellent 🙂
A possible, cruel-social-mood, bull-trap scenario – Primary E overshoots just a tiny bit, raising hopes of a bullish run before turning around just short of the invalidation point of 1357.09 beginning the deep dive?
Clear divergences seen in oscillators.
a strong thrust taking place atm
Hi. Got to agree with you – Gold price remains highly bullish with the daily/weekly/monthly stochastic continues in bullish territory. The drop today barely made it to the pivot. With 1325 holding and Gold price coasting above 1332, a break above 1341 for 1349 could happen. Let’s wait and see if as per Lara’s analysis a third wave kicks in soon! 🙂 IMO it’s probably now down to which is the better probability: of Gold price reaching 1363/1391 or 1298/1278…..
Notice to members regarding Oil analysis:
This was done at the end of last week.
I will do it still once a week, but I’m shifting it slightly to end of week. This I think is better, as it gives me a completed weekly candlestick to analyse.
If anything changes during the week I’ll keep an eye on comments for the last Oil analysis and provide an updated daily chart as required.
Lara,
When a subscriber posts a question/comment, do you get an alert of some sort or do you see it only when you browse through?
I only see it when I browse. If it’s important and you’re worried I may miss it, then use the contact form to send me an email, or just email me admin@elliottwavegold.com
But I do browse through comments in my evening (the small hours EST) and then my early morning (early afternoon EST). At least. Often more.
So if there aren’t too many comments I’ll catch questions. Only if it gets to over 100 may I possibly miss something.
I’m usually here… lurking 🙂
Haha, lurking ey!!!
The reason I asked is, if you were getting alerts and a question goes unanswered, there must be a reason and it will be impolite to remind you.
If I miss something it’s certainly not impolite to remind me.