

S&P 500
Upwards movement has unfolded overall as expected for this week.
Summary: Overall, now expect a bounce to last about two to a few weeks. For the short term, the last open gap may offer support at 2,685.43.
A primary degree correction should last several weeks and should show up on the weekly and monthly charts. Primary wave 4 may total a Fibonacci 8, 13 or 21 weeks. Look for very strong support about the lower edge of the teal trend channel on the monthly chart.
Primary wave 4 should be expected to exhibit reasonable strength. This is the last multi week to multi month consolidation in this ageing bull market, and it may now begin to take on some characteristics of the bear market waiting in the wings.
The final target for this bull market to end remains at 3,616, which may be met in October 2019.
The biggest picture, Grand Super Cycle analysis, is here.
Last published monthly chart is here, video is here.
ELLIOTT WAVE COUNT
WEEKLY CHART
Click chart to enlarge.
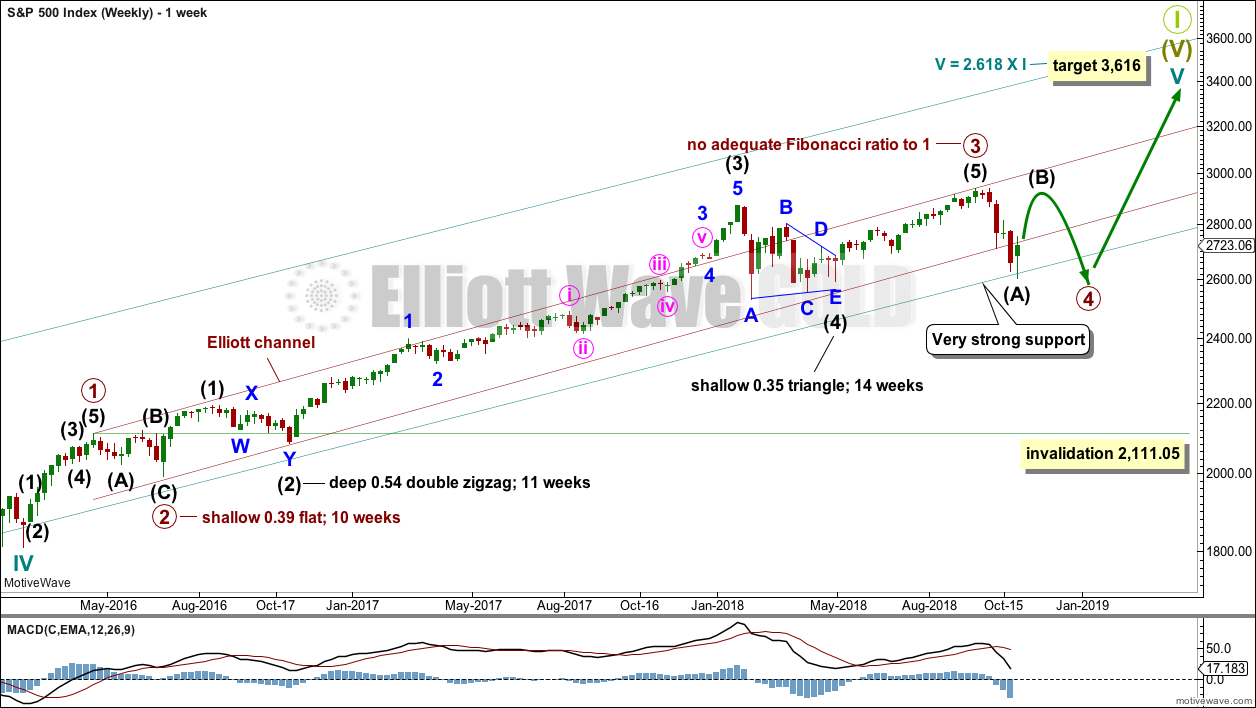
Cycle wave V must complete as a five structure, which should look clear at the weekly chart level and also now at the monthly chart level. It may only be an impulse or ending diagonal. It is clear it is an impulse.
Within cycle wave V, the third waves at all degrees may only subdivide as impulses.
Within primary wave 3, there is perfect alternation and excellent proportion between intermediate waves (2) and (4).
The channel is now drawn about primary degree waves. The first trend line is drawn from the ends of primary waves 1 to 3, then a parallel copy is placed upon the low of primary wave 2. The overshoot of the upper edge of this channel by the end of intermediate wave (3) looks typical. For the S&P, its third waves are usually the strongest portion of an impulse; they often exhibit enough strength to overshoot channels.
Primary wave 4 now has an overshoot on the lower edge of the channel. This is acceptable; fourth waves are not always neatly contained within channels drawn using this technique.
Primary wave 4 may find very strong support about the lower edge of the teal channel, and it looks like this is from where price may be bouncing. This channel is copied over from the monthly chart and contains the entire bull market since its beginning in March 2009. While Super Cycle wave (V) is incomplete, this channel should not be breached at the weekly chart level.
Primary wave 4 may not move into primary wave 1 price territory below 2,111.05.
When primary wave 4 may be complete, then the final target may be also calculated at primary degree. At that stage, the final target may widen to a small zone, or it may change.
At this stage, the expectation is for the final target to be met in October 2019. If price gets up to this target and either the structure is incomplete or price keeps rising through it, then a new higher target would be calculated.
DAILY CHART
Click chart to enlarge.
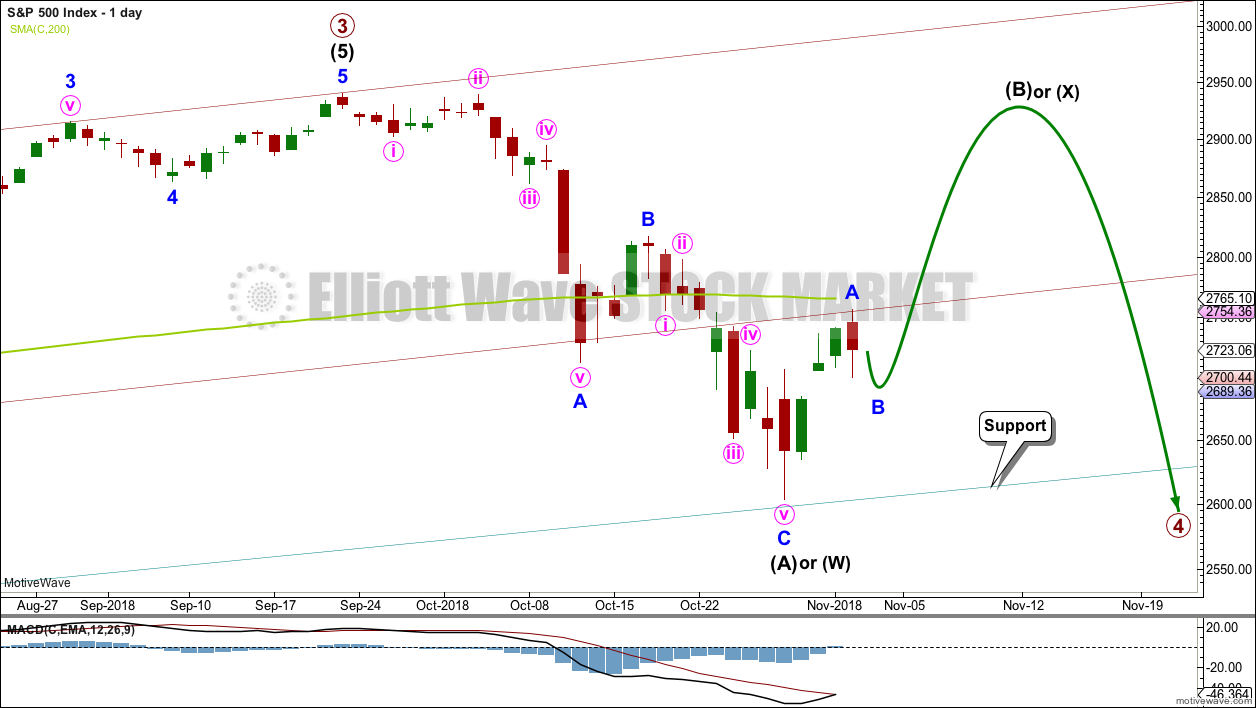
Primary wave 4 would most likely end somewhere within the price territory of the fourth wave of one lesser degree. Intermediate wave (4) has its price territory from 2,872.87 to 2,532.69. Within this range sit the 0.236 Fibonacci ratio at 2,717 and the 0.382 Fibonacci ratio at 2,578.
The 0.382 Fibonacci ratio would expect an overshoot of the teal channel. This may be too low; price may find support at the lower edge of the channel. However, as primary wave 4 should be expected to exhibit reasonable strength, it may be able to overshoot the channel and that would look reasonable. This possibility is now more seriously considered.
Primary wave 2 unfolded as a shallow regular flat correction lasting 10 weeks.
The two wave counts are swapped over at the end of this week.
Intermediate wave (A) may be seen as a complete zigzag. A zigzag down to start primary wave 4 may also be labelled intermediate wave (W).
If intermediate wave (A) or (W) subdivide as a zigzag, then primary wave 4 may unfold as a double zigzag, double combination, flat or triangle. Of all these possible structures a flat correction would be least likely as that would not offer structural alternation with the flat correction of primary wave 2.
A double zigzag would also be less likely as that would require a very large overshoot of the teal trend channel, and it would also see a very brief primary wave 4.
A triangle would be fairly likely even though intermediate wave (4) was a triangle. This does not reduce the probability of primary wave 4 also subdividing as a triangle.
A double combination should always be considered if a triangle is possible, and this would also offer reasonable alternation with primary wave 2.
All structural options (except a double zigzag) which begin with a zigzag down would expect a high bounce for intermediate wave (B) or (X). Intermediate wave (B) or (X) would most likely subdivide as a zigzag.
Within a triangle for primary wave 4, intermediate wave (B) would most likely be about 0.8 to 0.85 the length of intermediate wave (A) giving a target range from 2,873.54 to 2,890.38. Intermediate wave (B) of a running triangle may make a new high above the start of intermediate wave (A).
Within a double combination for primary wave 4, intermediate wave (W) may be the first complete structure in a double. Intermediate wave (X) may be a very high bounce and may make a new high above the start of intermediate wave (W). There is no minimum requirement for the length of intermediate wave (X), and no maximum limit
ALTERNATE WAVE COUNT
DAILY CHART
Click chart to enlarge.
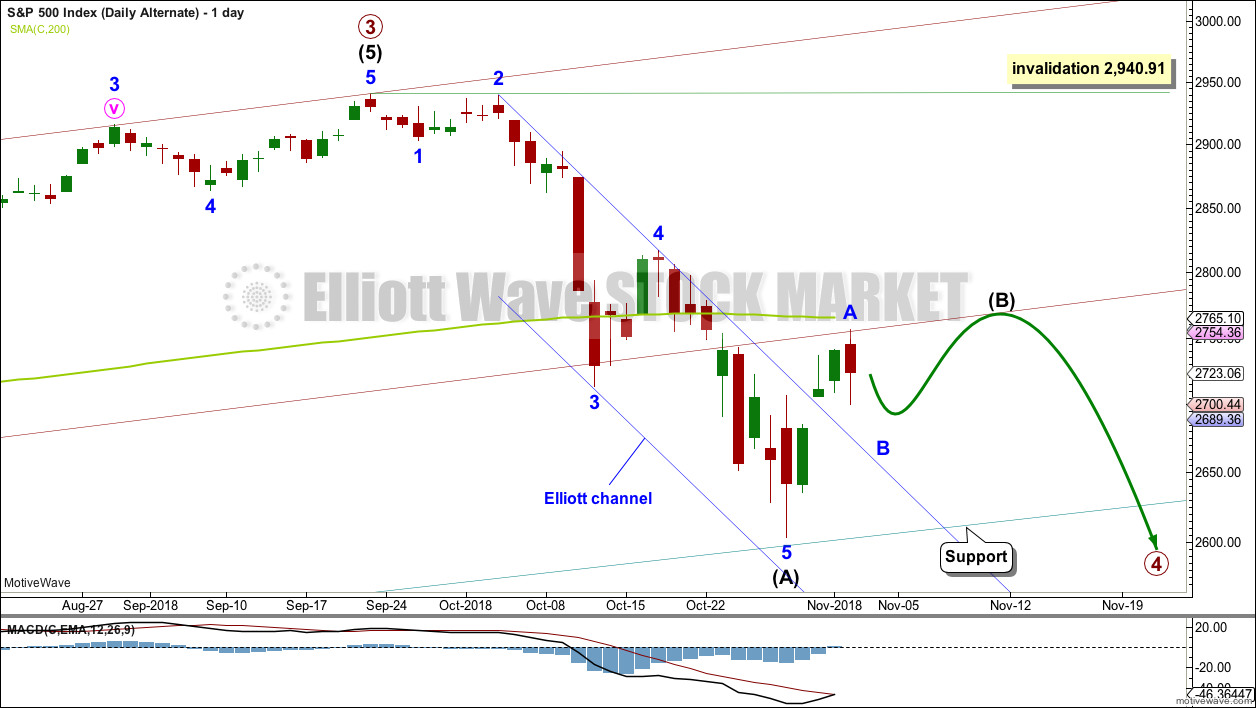
It is also possible to see the downwards wave labelled intermediate wave (A) as a complete impulse. If intermediate wave (A) is a five wave structure, then intermediate wave (B) may not move beyond its start above 2,940.91.
Primary wave 4 may be a zigzag to provide structural alternation with the flat correction of primary wave 2; intermediate wave (A) within a zigzag must subdivide as a five wave structure.
Primary wave 4 may not move into primary wave 1 price territory below 2,111.05.
This wave count would expect to see at its end a large overshoot of the teal channel for the end of primary wave C, so that it moves below the end of primary wave A and avoids a truncation. This looks less likely; this is one reason why this wave count today is judged to have a lower probability and is labelled as an alternate.
TECHNICAL ANALYSIS
WEEKLY CHART
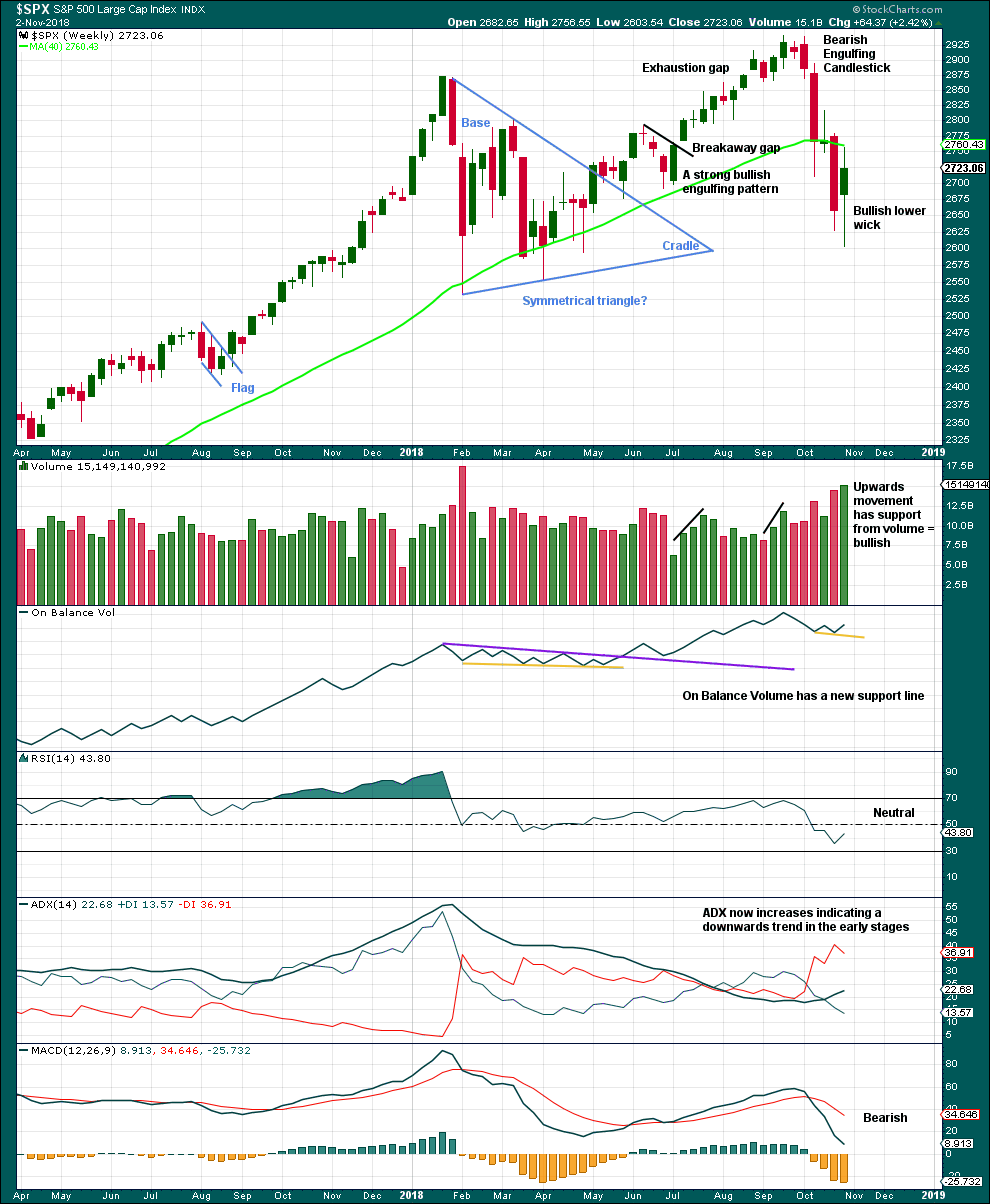
Click chart to enlarge. Chart courtesy of StockCharts.com.
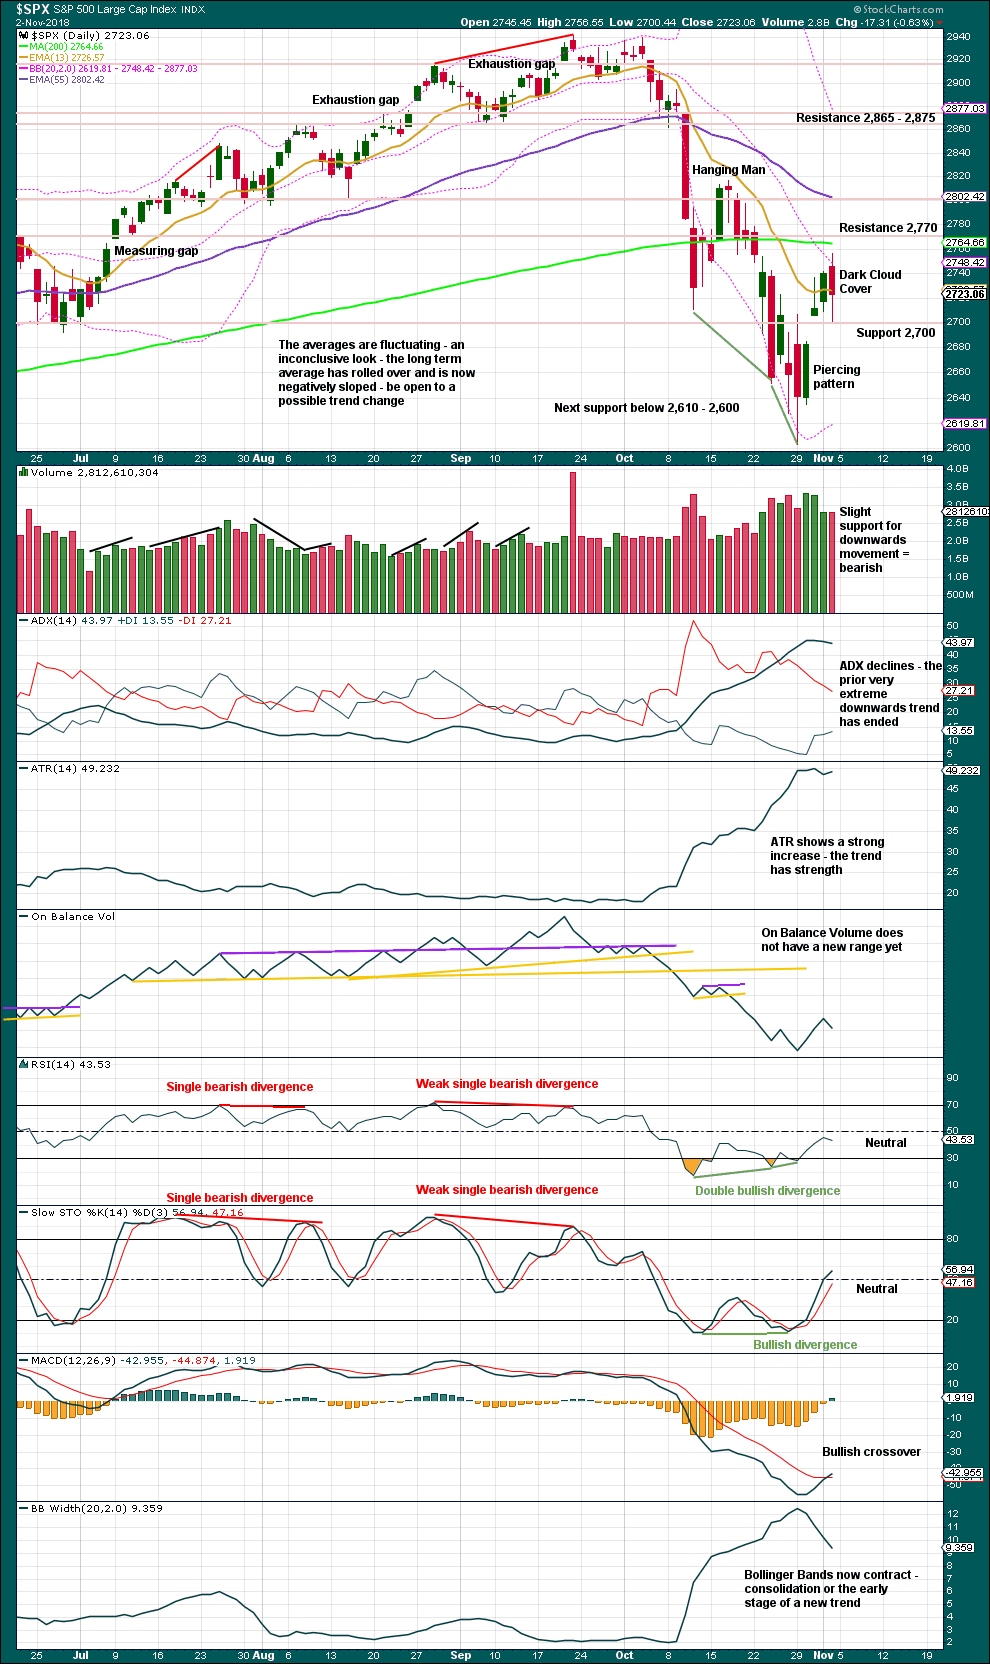
Another long lower wick and support from volume this week looks bullish again.
The support line for On Balance Volume is removed and redrawn.
DAILY CHART
Click chart to enlarge. Chart courtesy of StockCharts.com.
For the short term, expect support about 2,700 and just below that at the last open gap at 2,685.43.
A bearish candlestick reversal pattern and support from volume for a day with the balance of volume downwards suggest next week may begin with more downwards movement. Price may be finding resistance here about the 200 day moving average.
BREADTH – AD LINE
WEEKLY CHART
Click chart to enlarge. Chart courtesy of StockCharts.com.
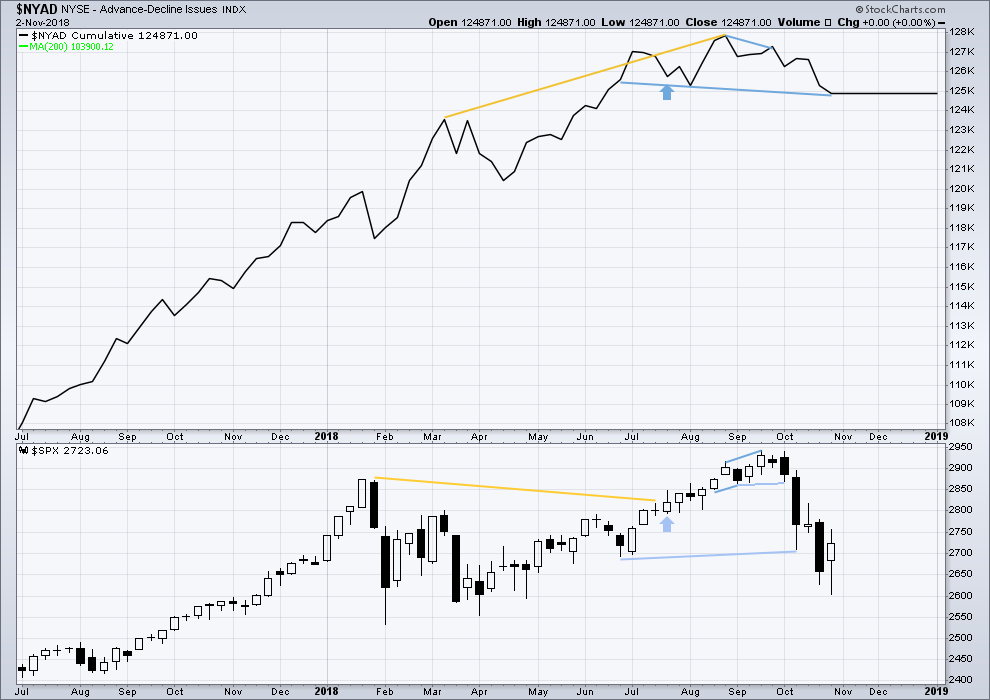
Falling price has support from a decline in market breadth. Breadth is falling in line with price. There is no divergence either way.
DAILY CHART
Click chart to enlarge. Chart courtesy of StockCharts.com.
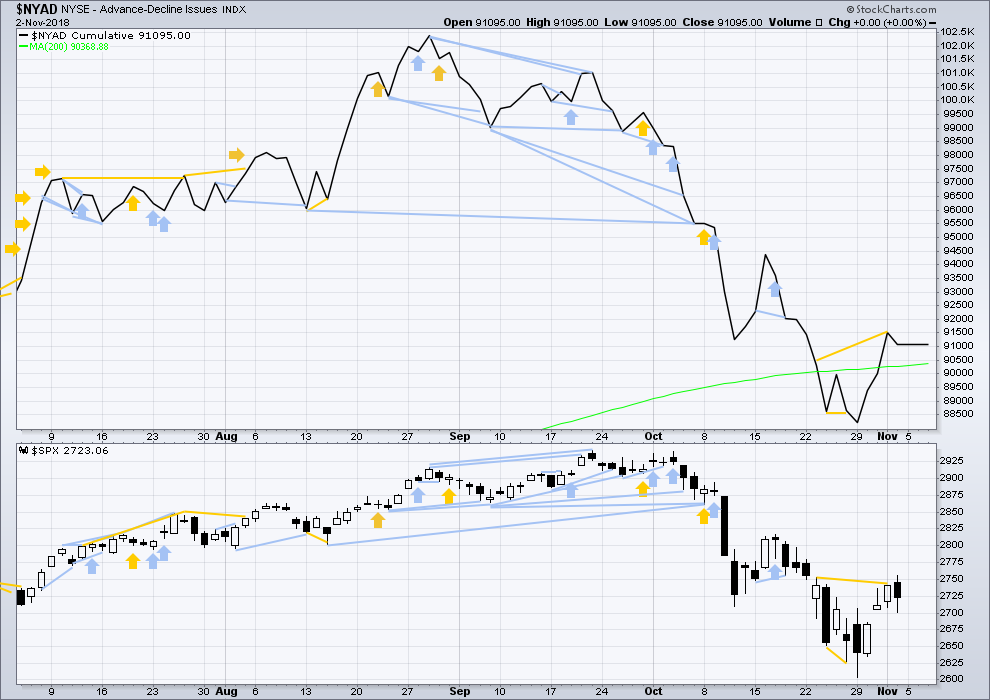
There is normally 4-6 months divergence between price and market breadth prior to a full fledged bear market. This has been so for all major bear markets within the last 90 odd years. With no longer term divergence yet at this point, any decline in price should be expected to be a pullback within an ongoing bull market and not necessarily the start of a bear market. New all time highs from the AD line on the 29th of August means that the beginning of any bear market may be at the end of December 2018, but it may of course be a lot longer than that. My next expectation for the end of this bull market may now be October 2019.
Breadth should be read as a leading indicator.
For Friday price moved mostly sideways and the AD line is flat. There is no new divergence. Most recent divergence remains bullish.
VOLATILITY – INVERTED VIX CHART
WEEKLY CHART
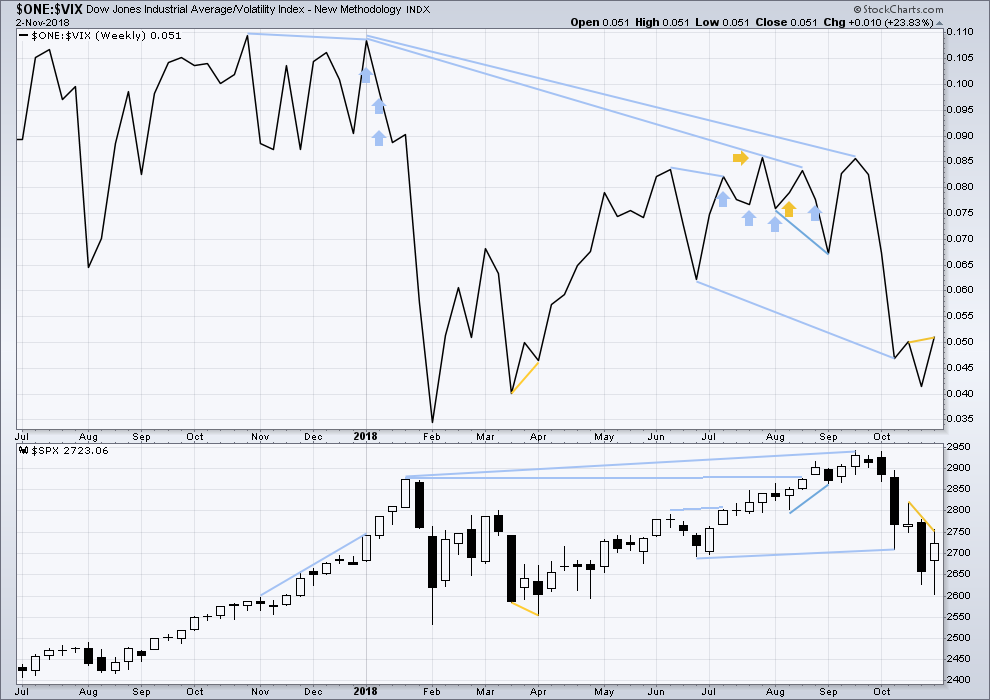
Click chart to enlarge. Chart courtesy of StockCharts.com. So that colour blind members are included, bearish signals
will be noted with blue and bullish signals with yellow.
This week inverted VIX has made a new high above the prior swing high two weeks ago, but price has not. This divergence is bullish.
DAILY CHART
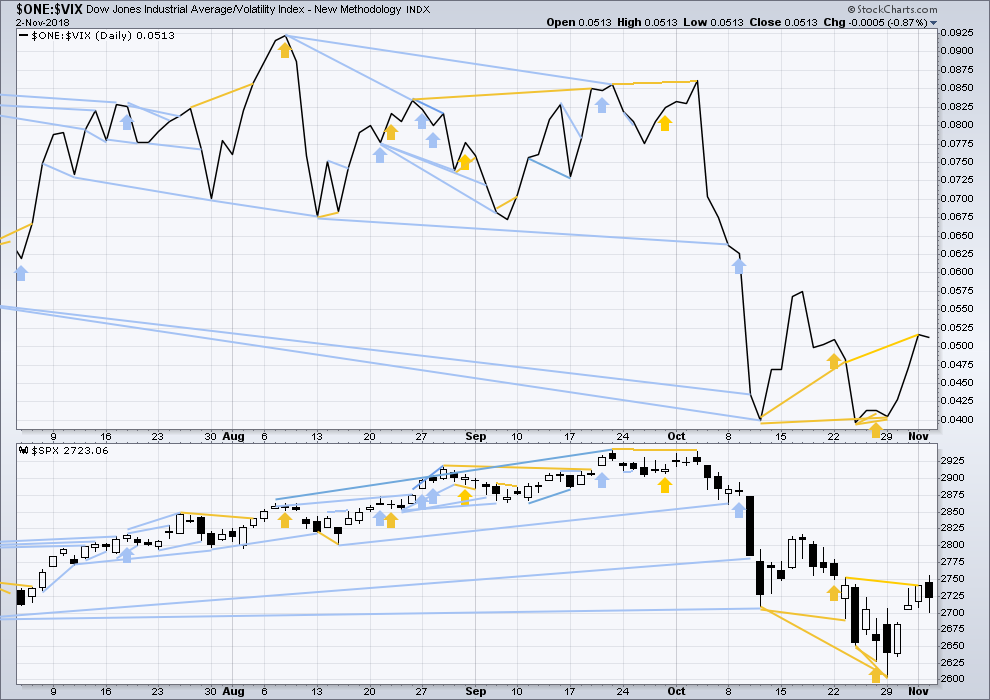
Click chart to enlarge. Chart courtesy of StockCharts.com. So that colour blind members are included, bearish signals
will be noted with blue and bullish signals with yellow.
Normally, volatility should decline as price moves higher and increase as price moves lower. This means that normally inverted VIX should move in the same direction as price.
Downwards movement during Friday’s session has support from a normal slight increase in VIX. There is no new divergence.
DOW THEORY
The following lows need to be exceeded for Dow Theory to confirm the end of the bull market and a change to a bear market:
DJIA: 23,344.52.
DJT: 9,806.79.
S&P500: 2,532.69.
Nasdaq: 6,630.67.
ANALYSIS OF INTERMEDIATE WAVE (4)
TECHNICAL ANALYSIS
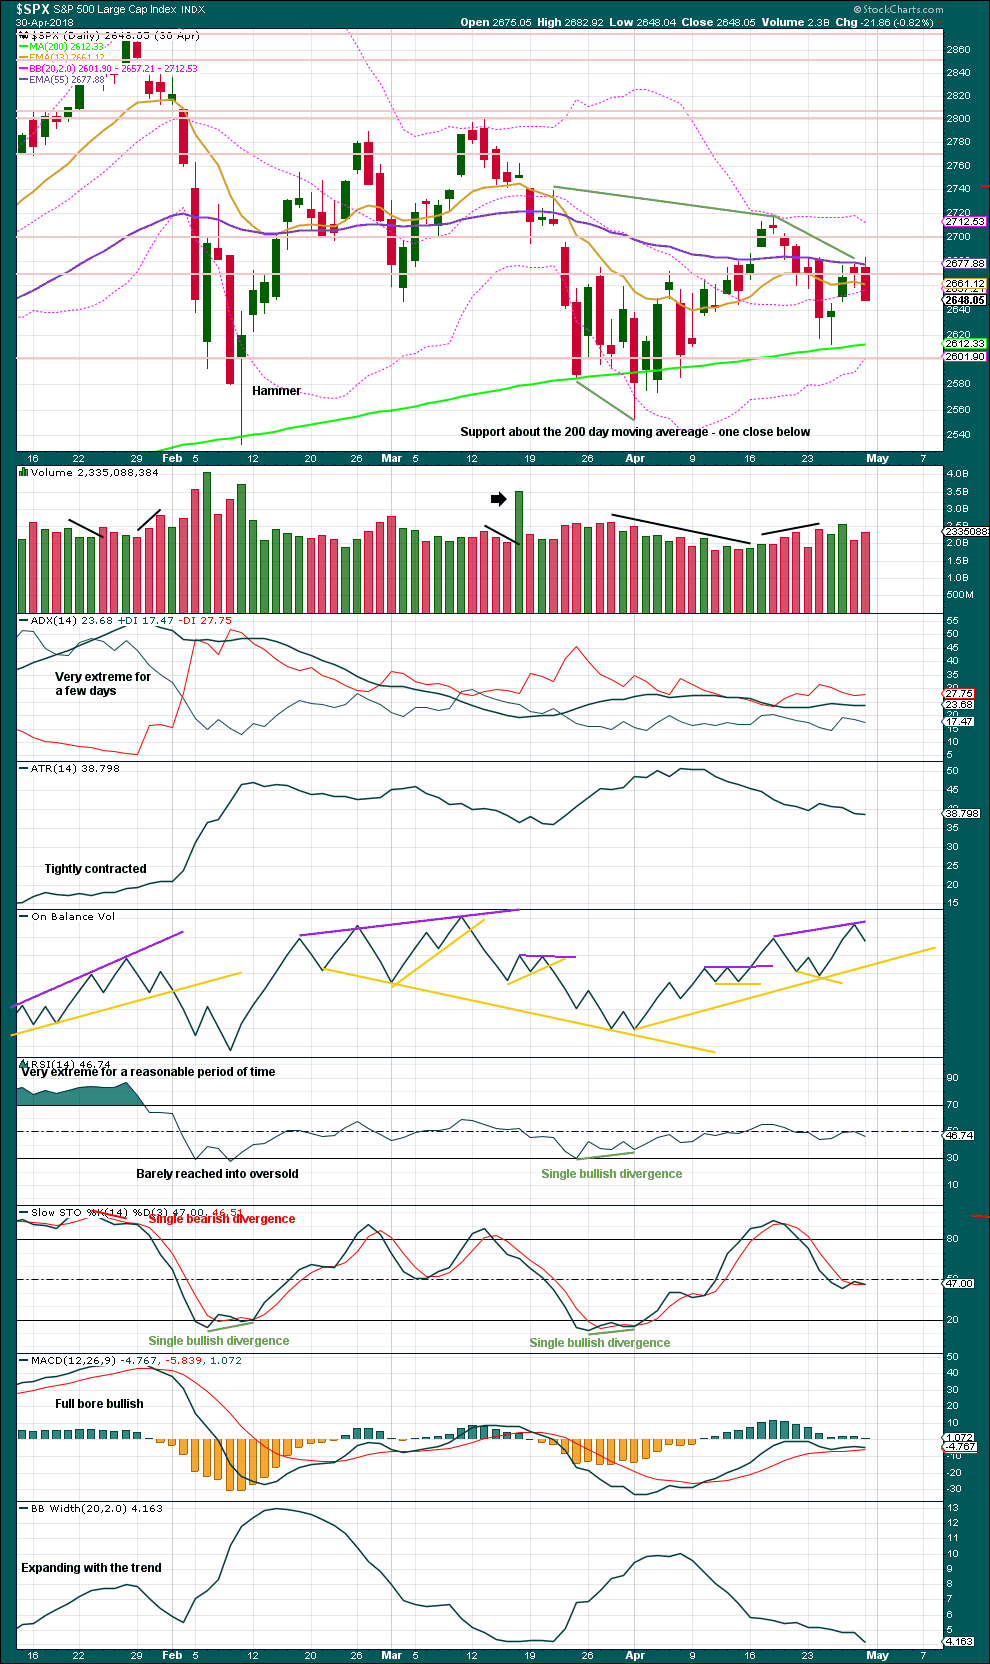
Click chart to enlarge. Chart courtesy of StockCharts.com.
Intermediate wave (4) was a large symmetrical triangle. The deepest wave was the first wave. At its low there was a clear candlestick reversal pattern and bullish divergence between price and Stochastics.
RSI barely managed to reach into oversold.
The current correction for primary wave 4 may behave differently, but there should be some similarities.
It is expected that primary wave 4 may be stronger than intermediate wave (4).
VIX
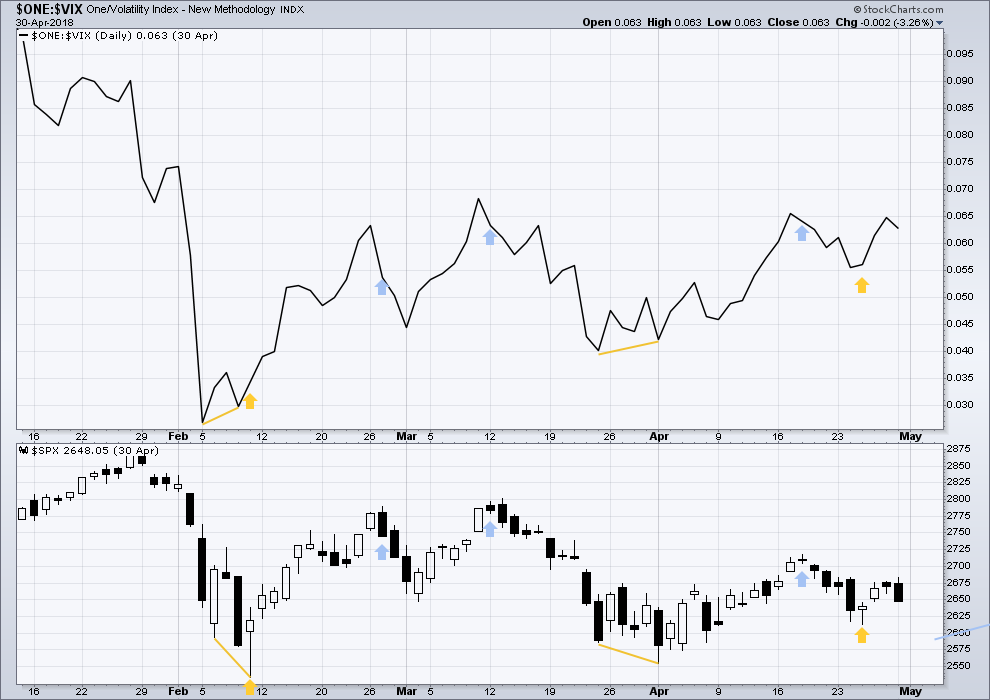
Click chart to enlarge. Chart courtesy of StockCharts.com.
This is a daily chart.
At the two major lows within intermediate wave (4), inverted VIX exhibited single short term bullish divergence.
At highs within intermediate wave (4), inverted VIX exhibited one single day bullish divergence with price.
AD LINE
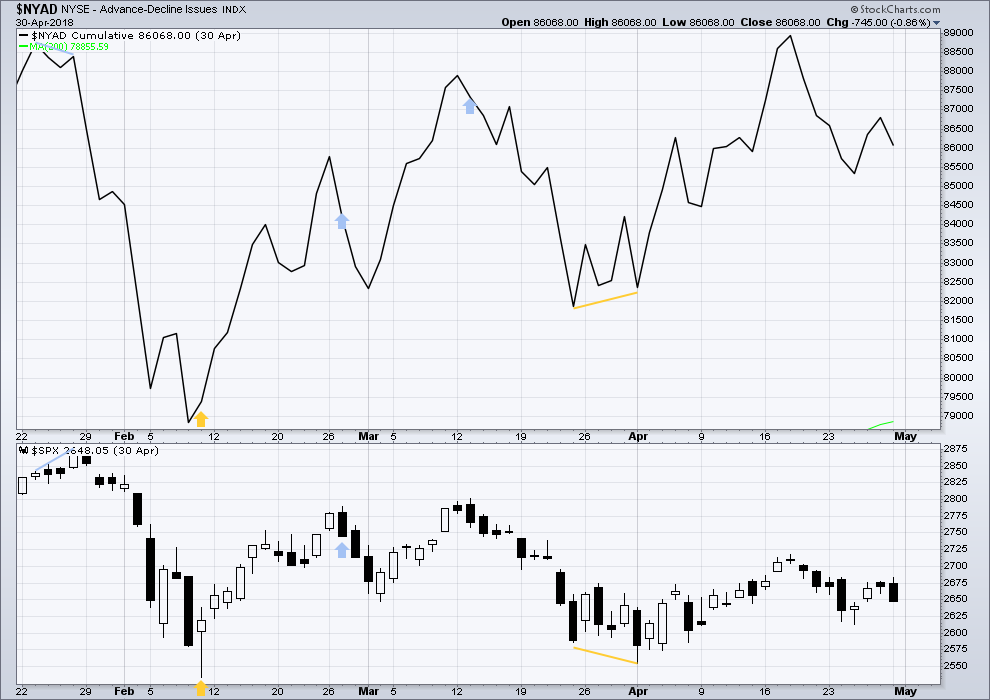
Click chart to enlarge. Chart courtesy of StockCharts.com.
This is a daily chart.
At the two major lows within intermediate wave (4), there was bullish divergence between price and the AD line. At the two major highs within intermediate wave (4), there was each one instance of single day bearish divergence.
GOLD
A small inside day leaves all Elliott wave counts unchanged.
Summary: A multi-week consolidation may continue, which may not move below 1,201.14.
Risk to any long positions here remains at 1,201.14.
Next week may see a downwards swing which could be the last swing within this consolidation.
Resistance is about 1,240 – 1,245. Support is about 1,215 – 1,220.
The final target for this bounce to end is at strong resistance about 1,305 – 1,310.
Grand SuperCycle analysis is here.
Last historic analysis with monthly charts is here.
There are four remaining weekly wave counts at this time for cycle wave b: a triangle, a flat, a combination, and a double zigzag.
At this stage, they will now be presented roughly in order of probability. The triangle and the double zigzag wave counts have about an even probability; the combination and flat wave counts now look less likely.
MAIN ELLIOTT WAVE COUNT
WEEKLY CHART – TRIANGLE
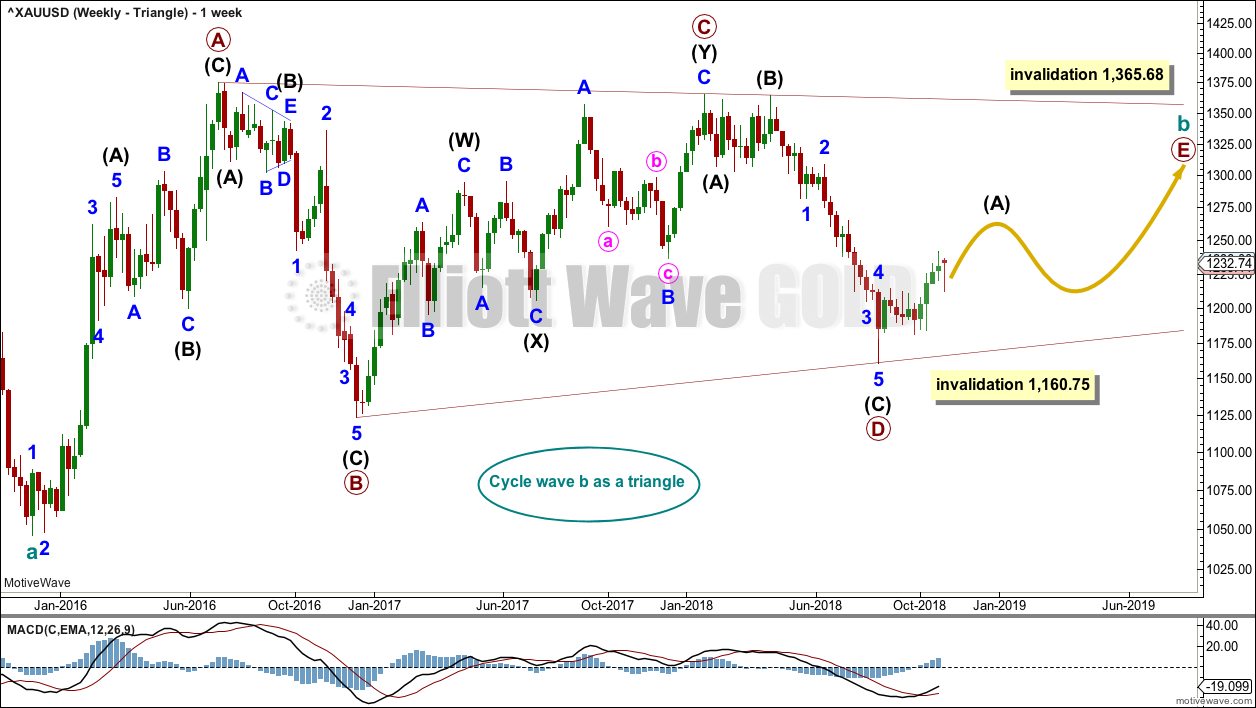
Click chart to enlarge.
Cycle wave b may be an incomplete regular contracting triangle. Primary wave E may not move beyond the end of primary wave C above 1,365.68. Within primary wave E, intermediate wave B may not move beyond the start of intermediate wave A below 1,160.75.
Four of the five sub-waves of a triangle must be zigzags, with only one sub-wave allowed to be a multiple zigzag. Wave C is the most common sub-wave to subdivide as a multiple, and this is how primary wave C for this example fits best. Primary wave E would most likely be a single zigzag. It is also possible that it may subdivide as a triangle to create a rare nine wave triangle.
There are no problems in terms of subdivisions or rare structures for this wave count. It has an excellent fit and so far a typical look.
Primary wave E may now continue higher as a large three wave structure.
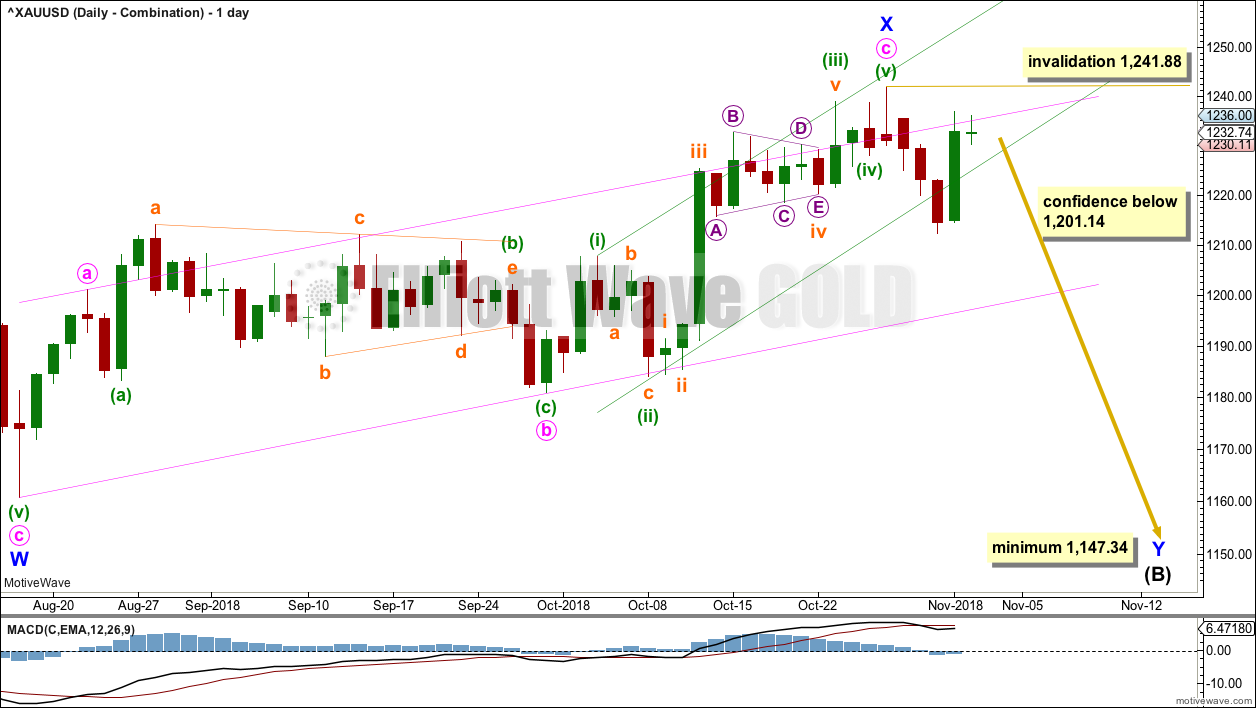
DAILY CHART – TRIANGLE
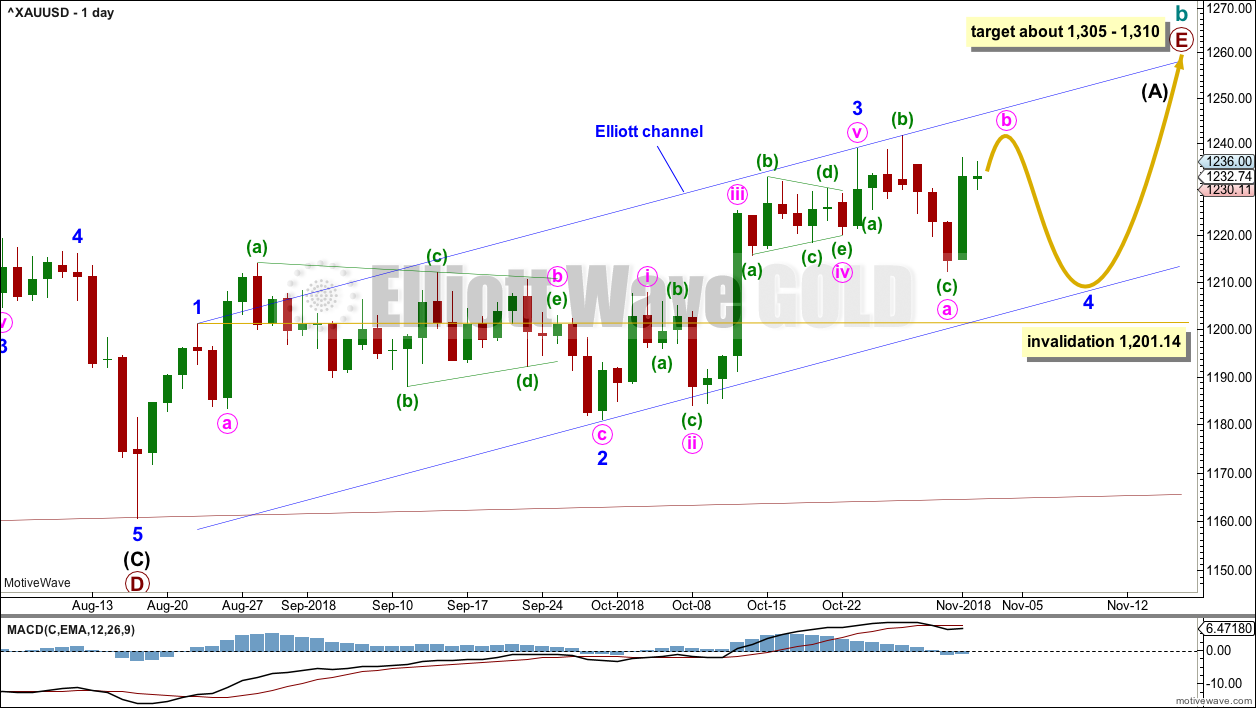
Click chart to enlarge.
Primary wave E should now be underway for this wave count.
Primary wave E should subdivide as a zigzag. Intermediate wave (A) should subdivide as a five wave structure.
Within intermediate wave (A), so far minor waves 1 through to 3 may now be complete. Minor wave 3 exhibits no Fibonacci ratio to minor wave 1. Minor wave 2 was a relatively shallow 0.497 flat correction.
Part of minor wave 4 has made a new price extreme beyond its start. Minor wave 4 may now not be unfolding as a zigzag. It may be unfolding as a flat, combination or triangle.
Minor wave 4 may not move into minor wave 1 price territory below 1,201.14.
Minor wave 2 lasted 27 sessions. Minor wave 4 may exhibit reasonable proportion to minor wave 2; it may last about a Fibonacci 21 or 34 sessions. So far it has lasted only 8 sessions, which looks too brief for it to be complete.
Draw the channel about intermediate wave (A) using Elliott’s first technique. Draw the first trend line from the ends of minor waves 1 to 3, then place a parallel copy on the end of minor wave 2. If it is time consuming enough, then minor wave 4 may find support about the lower edge of this channel. Upwards movement so far within minor wave 4 has found strong resistance about the upper edge of this channel.
A target for primary wave E is the strong zone of resistance about 1,305 to 1,310. Primary wave E is most likely to subdivide as a zigzag (although it may also subdivide as a triangle to create a rare nine wave triangle), and it should last at least a Fibonacci 13 weeks. It may also last a total Fibonacci 21 or 34 weeks. So far it has lasted only 8 weeks. Primary wave E may not move beyond the end of primary wave C above 1,365.68.
WEEKLY CHART – DOUBLE ZIGZAG
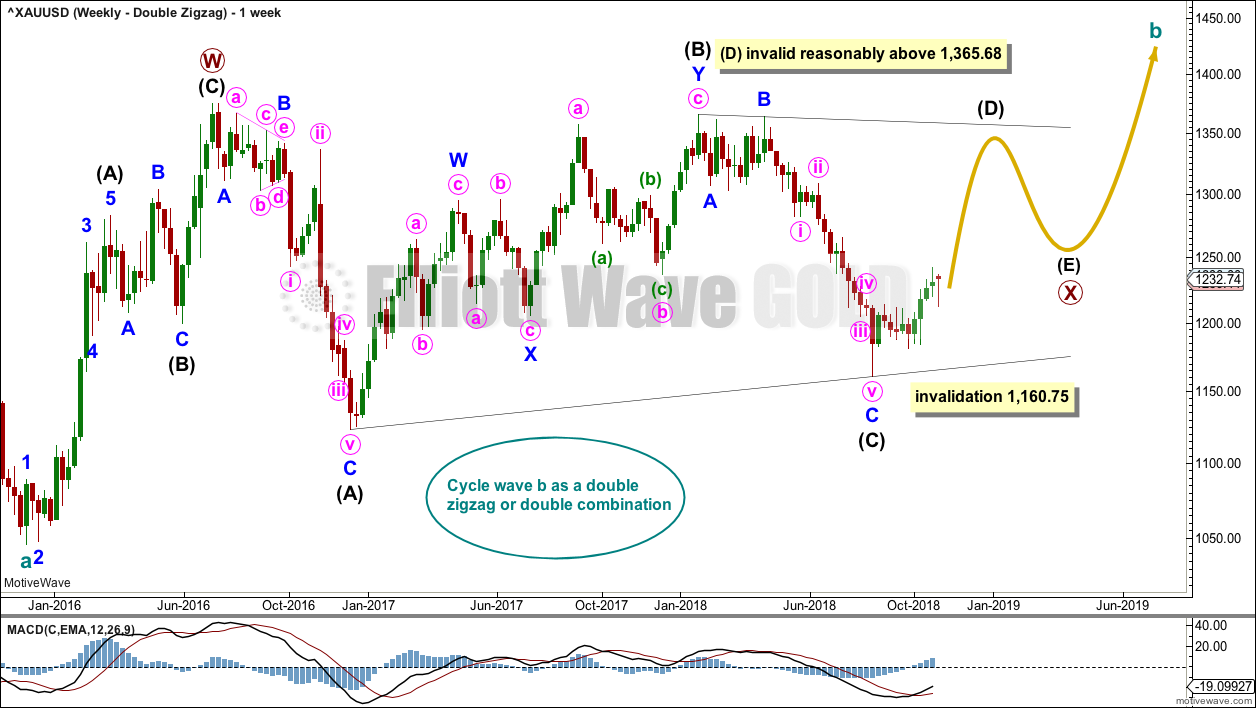
Click chart to enlarge.
It is also possible that cycle wave b may be a double zigzag or a double combination.
The first zigzag in the double is labelled primary wave W. This has a good fit.
The double may be joined by a corrective structure in the opposite direction, a triangle labelled primary wave X. The triangle would be about three quarters complete.
Within the triangle of primary wave X, intermediate wave (C) should be complete. Within intermediate wave (D), minor wave B may not move beyond the start of minor wave A below 1,160.75.
Intermediate wave (D) would most likely subdivide as a single zigzag. The subdivisions at the daily level for this wave count would be the same as for the first triangle wave count above; a zigzag unfolding higher would be labelled A-B-C.
This wave count may now expect choppy overlapping movement in an ever decreasing range for several more months.
Primary wave Y would most likely be a zigzag because primary wave X would be shallow; double zigzags normally have relatively shallow X waves.
Primary wave Y may also be a flat correction if cycle wave b is a double combination, but combinations normally have deep X waves. This would be less likely.
This wave count has good proportions and no problems in terms of subdivisions.
WEEKLY CHART – COMBINATION
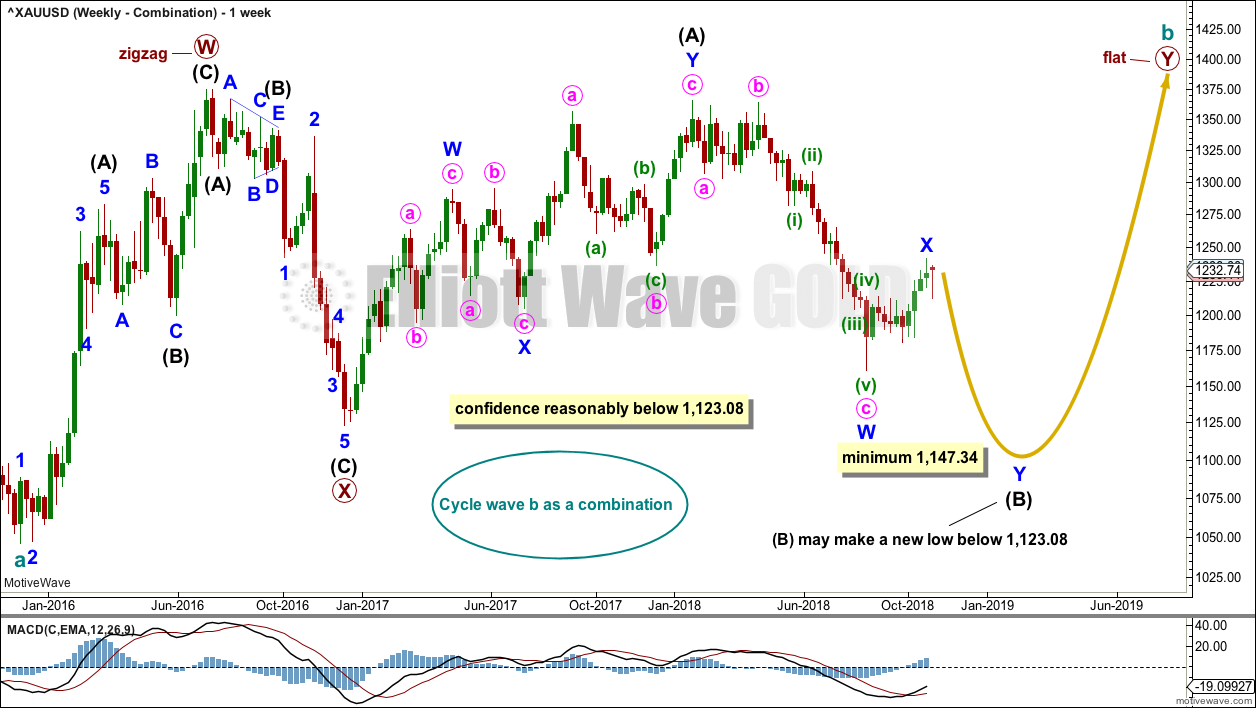
Click chart to enlarge.
If cycle wave b is a combination, then the first structure in a double may be a complete zigzag labelled primary wave W.
The double may be joined by a three in the opposite direction, a zigzag labelled primary wave X.
The second structure in the double may be a flat correction labelled primary wave Y. My research on Gold so far has found that the most common two structures in a double combination are one zigzag and one flat correction. I have found only one instance where a triangle unfolded for wave Y. The most likely structure for wave Y would be a flat correction by a very wide margin, so that is what this wave count shall expect.
Within a flat correction for primary wave Y, the current downwards wave of intermediate wave (B) may be a double zigzag. Intermediate wave (B) must retrace a minimum 0.9 length of intermediate wave (A) at 1,147.34. Intermediate wave (B) may move beyond the start of intermediate wave (A) as in an expanded flat.
Because the minimum requirement for intermediate wave (B) is not yet met, this wave count requires that intermediate wave (B) continues lower. This is the most immediately bearish of all four weekly wave counts.
When intermediate wave (B) is complete, then intermediate wave (C) would be expected to make at least a slight new high above the end of intermediate wave (A) at 1,365.68 to avoid a truncation. Primary wave Y would be most likely to end about the same level as primary wave W at 1,374.91, so that the whole structure takes up time and moves price sideways, as that is the purpose of double combinations.
While double combinations are very common, triples are extremely rare. I have found no examples of triple combinations for Gold at daily chart time frames or higher back to 1976. When the second structure in a double is complete, then it is extremely likely (almost certain) that the whole correction is over.
DAILY CHART – COMBINATION
Click chart to enlarge.
Minor wave X may again be complete.
Minor wave Y may be underway for this wave count to continue lower to a minimum at 1,147.34. Minor wave Y may last a few weeks.
WEEKLY CHART – FLAT
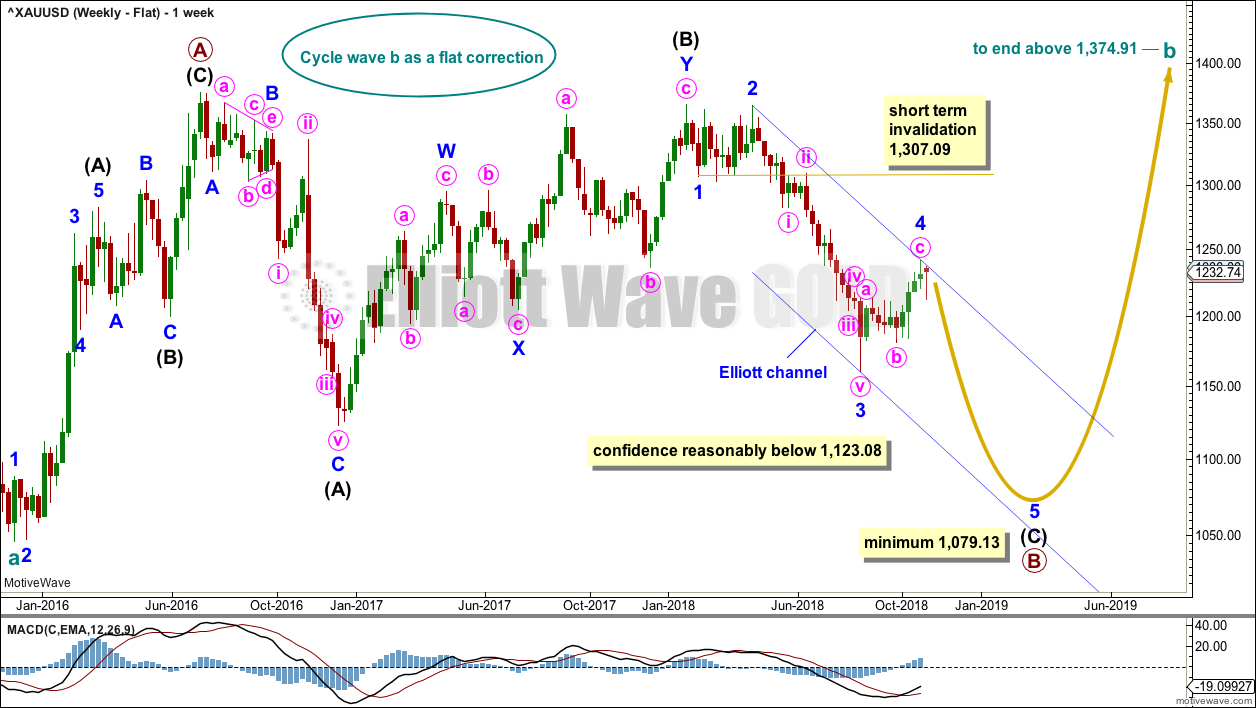
Click chart to enlarge.
It is possible that cycle wave b may be a flat correction. Within a flat correction, primary wave B must retrace a minimum 0.9 length of primary wave A at 1,079.13 or below. Primary wave B may make a new low below the start of primary wave A at 1,046.27 as in an expanded flat correction.
Only a new low reasonably below 1,123.08 would provide reasonable confidence in this wave count.
Intermediate wave (C) must subdivide as a five wave structure; it may be unfolding as an impulse. Within intermediate wave (C), minor waves 1 through to 4 may be complete. If it continues further, then minor wave 4 may not move into minor wave 1 price territory above 1,307.09.
The blue channel is drawn using Elliott’s second technique. Minor wave 5 may end at support about the lower edge of this channel.
Minor wave 2 was a double zigzag lasting nine weeks. Minor wave 4 exhibits little alternation as a single zigzag and reasonable proportion lasting ten weeks.
TECHNICAL ANALYSIS
WEEKLY CHART
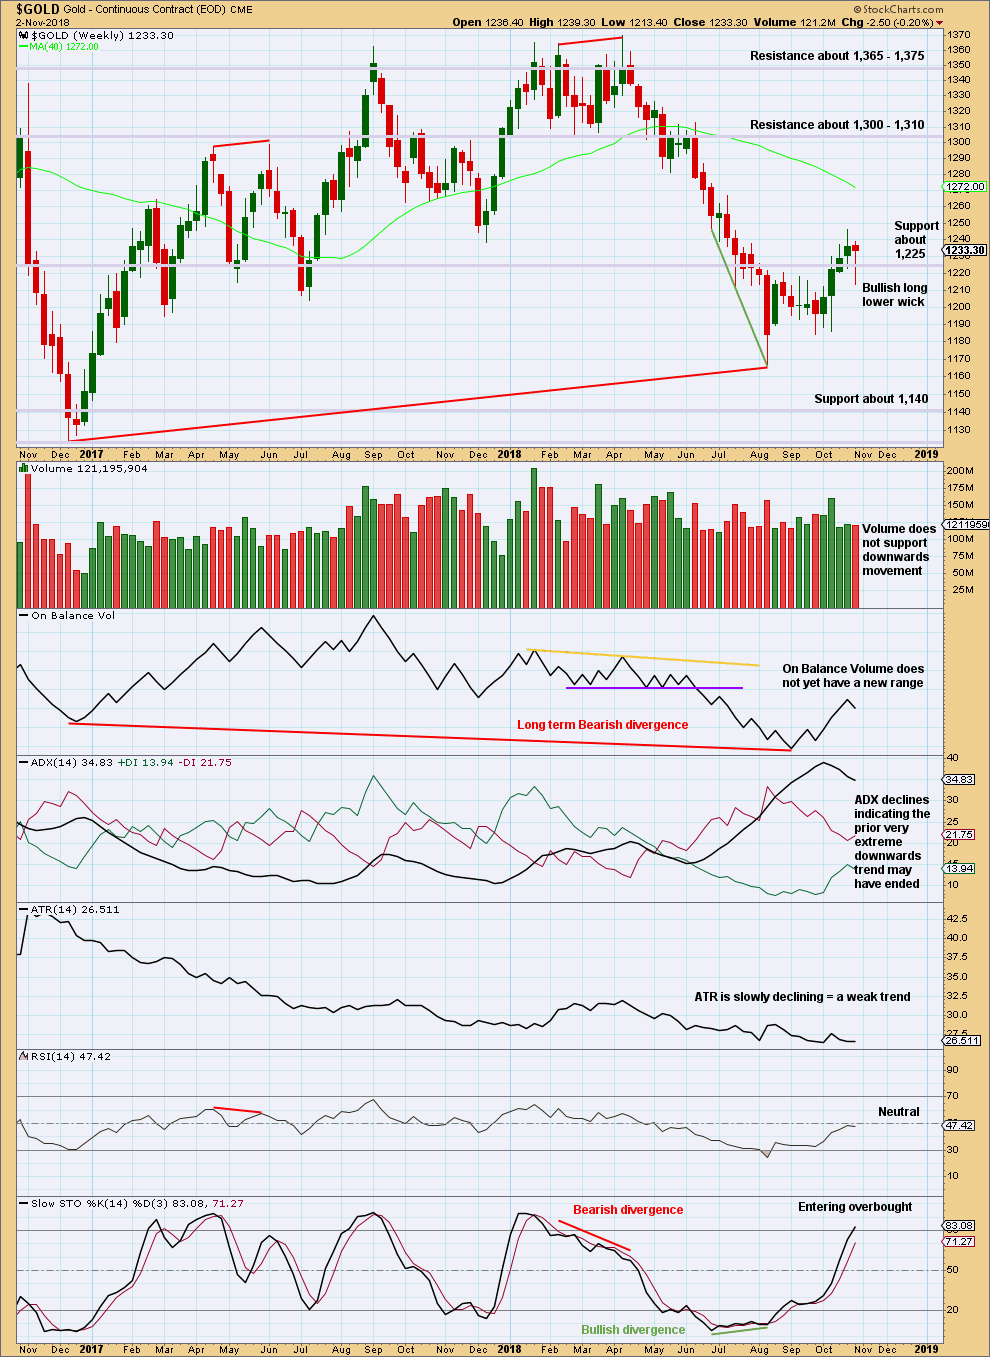
Click chart to enlarge. Chart courtesy of StockCharts.com.
On Balance Volume has made a lower low than its prior low at the end of November 2015. This divergence is extremely bearish but does not rule out a consolidation unfolding here; the divergence does strongly support the Triangle wave count, which expects a consolidation or bounce up to test resistance now and then a continuation of a major bear market. It could also support the flat wave count that allows for a new low below 1,046.27 in coming months.
This week completes a candlestick that may be a Hanging Man reversal pattern. However, the bullish implications of the long lower wick of a Hanging Man mean it requires bearish confirmation to be read as a reversal pattern, which essentially makes a Hanging Man a two candlestick reversal pattern. Prior to bearish confirmation, this candlestick should be read as bullish.
Upwards movement may now be a little limited as Stochastics is nearing overbought.
DAILY CHART
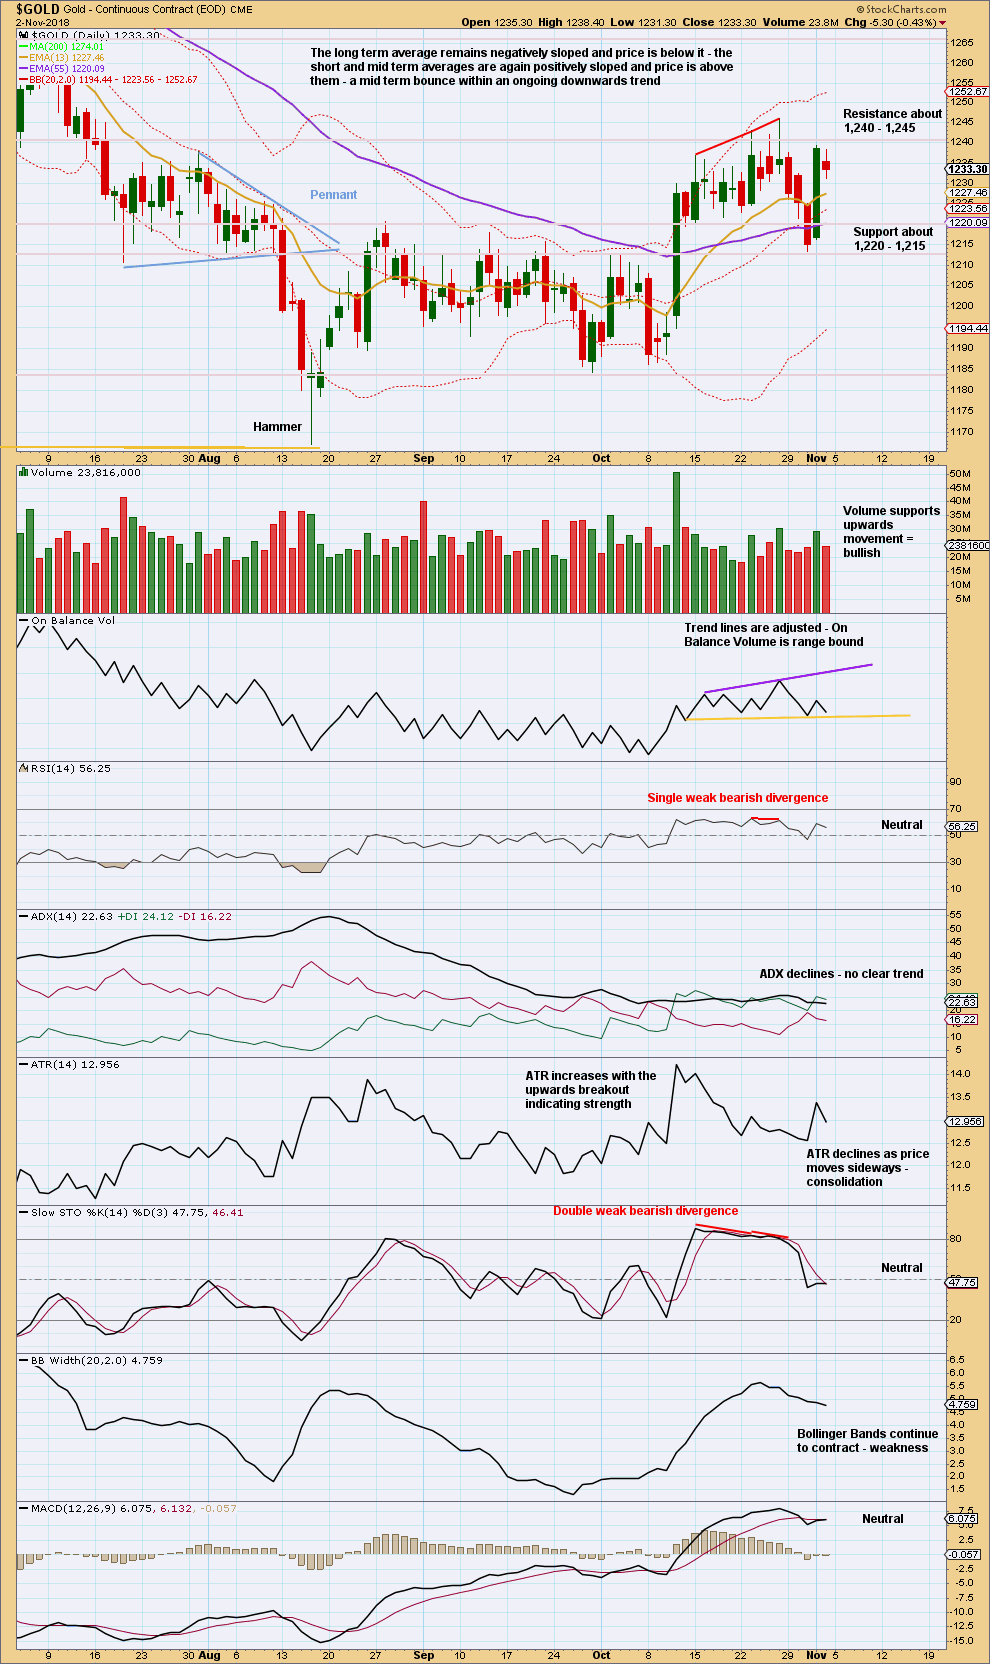
Click chart to enlarge. Chart courtesy of StockCharts.com.
Price remains range bound with resistance about 1,240 to 1,245 and support about 1,220 to 1,215.
The downwards day of the 12th of October remains with the strongest volume so far within this consolidation. However, the next three strongest days are all upwards days. It may also be noted that upwards days have greater range within the consolidation.
On Balance Volume is nearing support. This may halt the fall in price. A break below this support line would be a weak bearish signal.
GDX WEEKLY CHART
Click chart to enlarge. Chart courtesy of StockCharts.com.
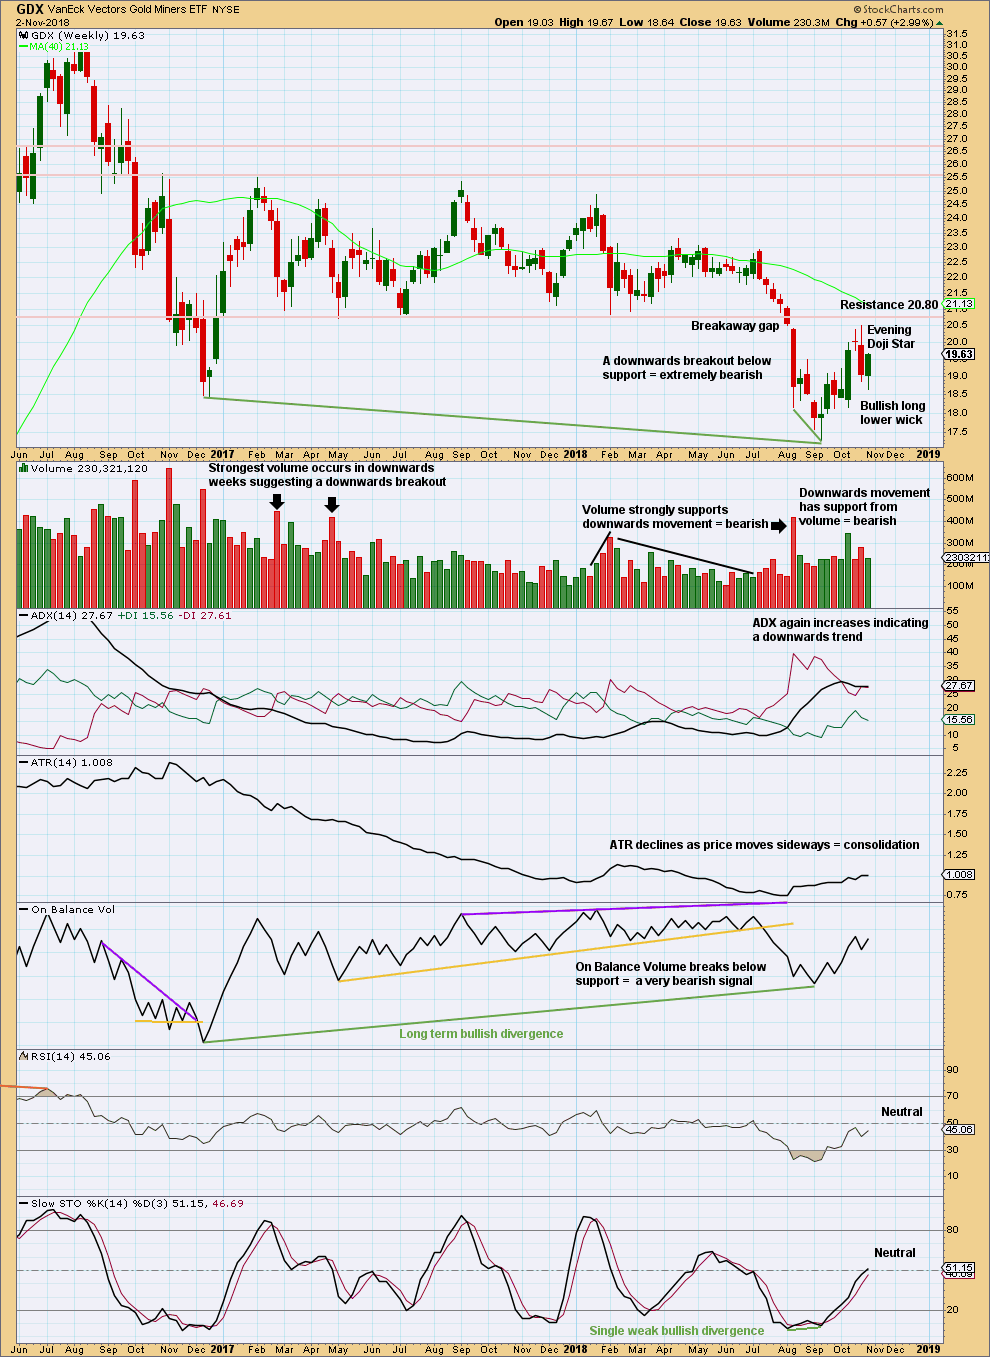
GDX had a large consolidation that lasted from January 2017 to August 2018. A downwards breakout below support at 20.80 in early August 2018 is highly significant. The breakout had support from volume, which adds confidence.
Upwards movement to the high last week now looks like a completed back test of resistance close to prior support at 20.80. The Evening doji star pattern indicates the bounce may be complete. The high last week at 20.51 is exactly the upper edge of the breakaway gap.
It would now be typical to see price move down and away. The target is at 16.02.
This week price moved lower, but the candlestick closed green and the balance of volume was upwards. A lack of support this week from volume for upwards movement still supports the idea the bounce may be complete.
GDX DAILY CHART
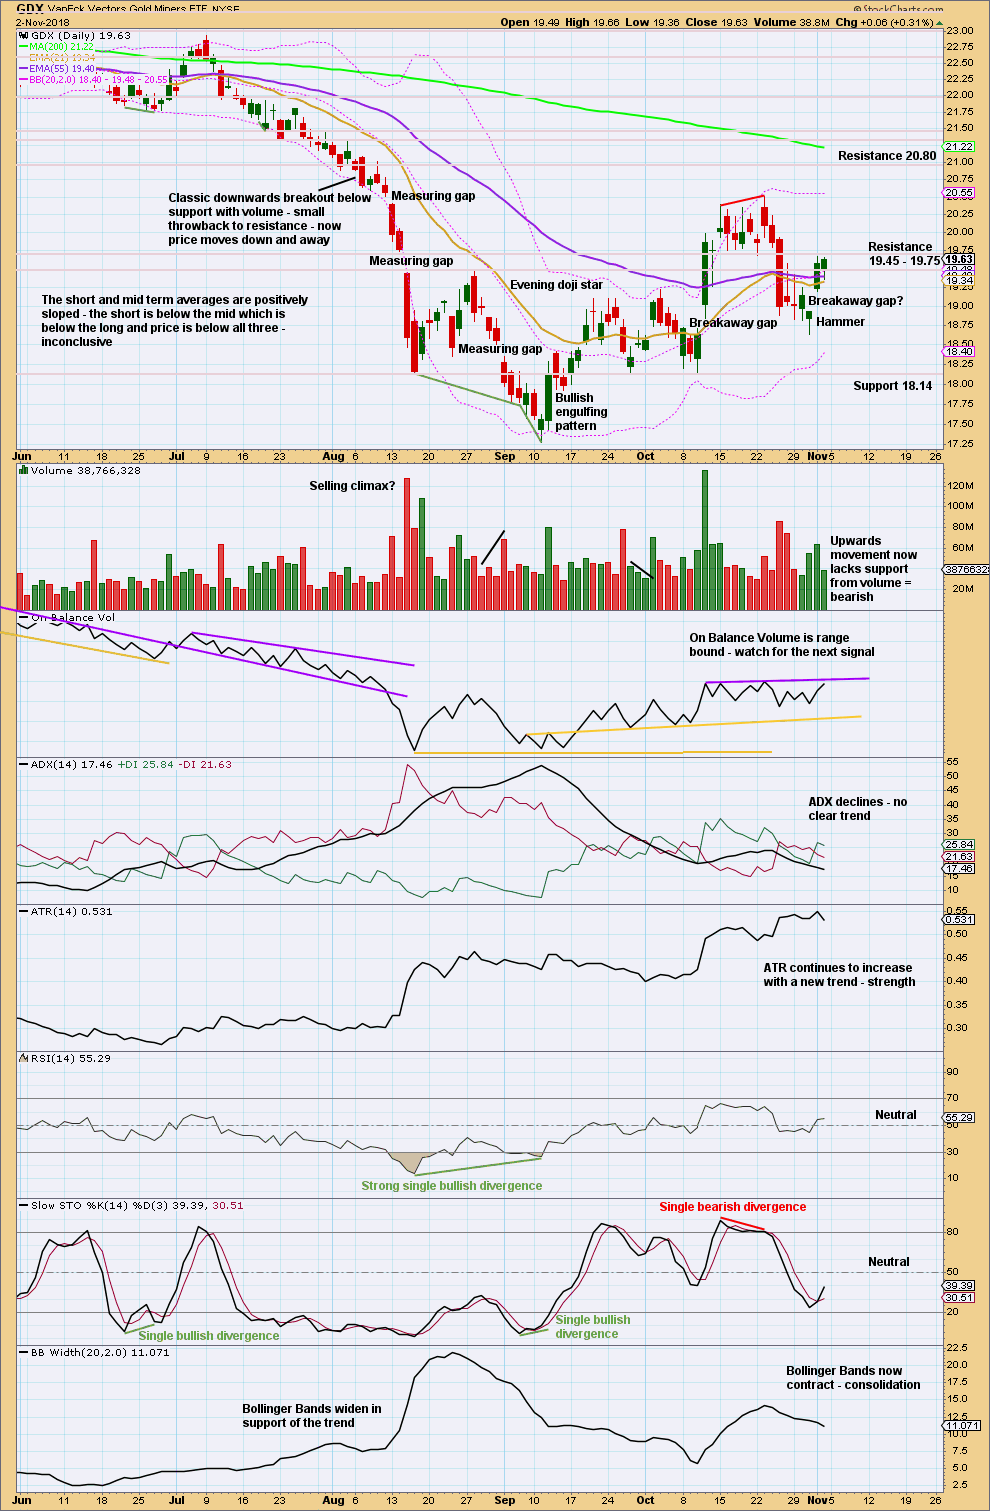
Click chart to enlarge. Chart courtesy of StockCharts.com.
Consider the bounce back up towards resistance at 20.80 now most likely complete.
However, if resistance at 19.75 can be overcome here, then the bounce may continue higher and may possibly move up to test 20.80.
So far price has been unable this week to close above resistance, and Friday shows some weakness now in upwards movement. Resistance is now close by for On Balance Volume; this may assist to halt a rise in price here.
US OIL
More downwards movement was expected as most likely for this week. The target at 63.60 was met and so far has been slightly passed.
Summary: The larger trend for Oil is up. Pullbacks offer opportunities to join the trend.
The current pullback may be complete here or very soon. A breach of the green best fit channel on the daily chart by a full daily candlestick above and not touching the trend line, preferably with clear and strong upwards movement, would add confidence that a low is in place.
The target is either at 78.47 to 80.63, or 104.08 to 106.25. The second target zone is preferred.
Risk to long positions here is at 55.24.
MAIN WAVE COUNT
MONTHLY CHART
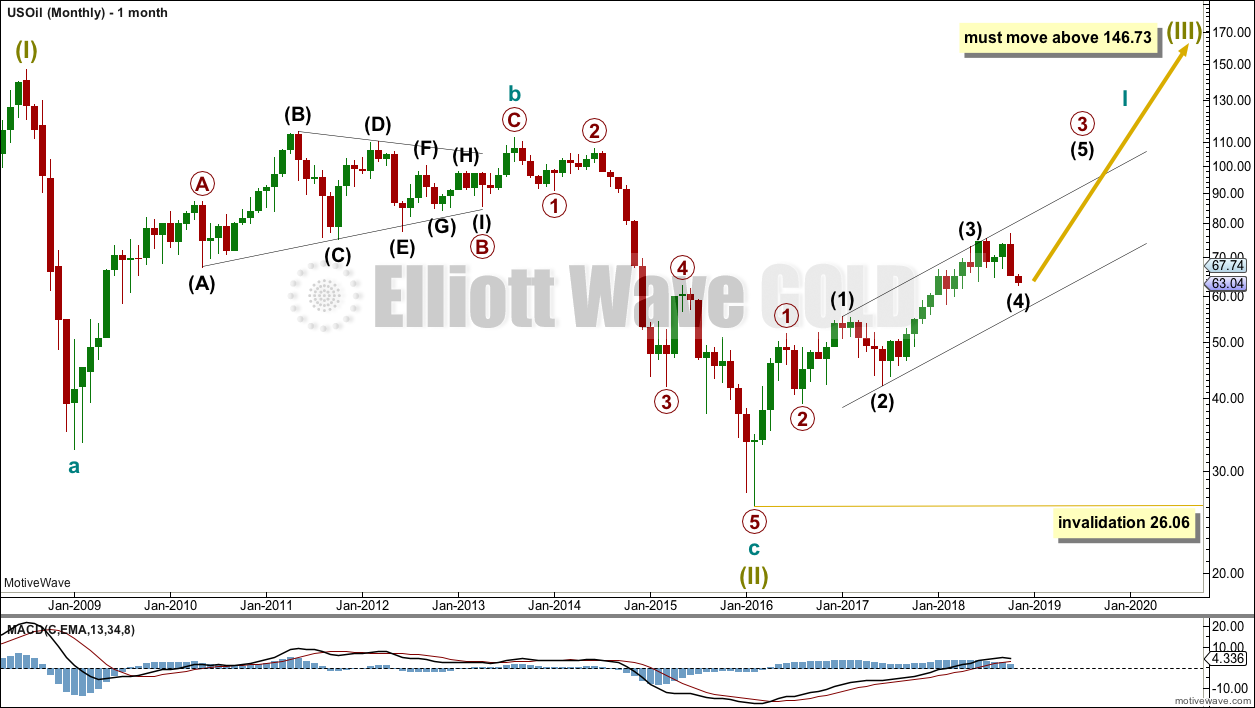
Click chart to enlarge.
The bear market for US Oil looks to be over and a new bull market looks to be in its early stages. The prior bearish wave count has been invalidated, leaving only this very bullish wave count.
A huge zigzag down to the last low may be complete and is labelled here Super Cycle wave (II).
Cycle wave b must be seen as complete in August 2013 for this wave count to work. It cannot be seen as complete at the prior major swing high in May 2011.
Cycle wave b is seen as a zigzag, and within it primary wave B is seen as a running contracting triangle. These are fairly common structures, although nine wave triangles are uncommon. All subdivisions fit.
Primary wave C moves beyond the end of primary wave A, so it avoids a truncation. But it does not have to move above the price territory of primary wave B to avoid a truncation, which is an important distinction.
If cycle wave b begins there, then cycle wave c may be seen as a complete five wave impulse.
Super Cycle wave (III) must move beyond the end of Super Cycle wave (I). It must move far enough above that point to allow room for a subsequent Super Cycle wave (IV) to unfold and remain above Super Cycle wave (I) price territory.
Cycle wave I may be incomplete. It may be unfolding as an impulse and may have now moved through the middle portion. Commodities have a tendency to exhibit swift strong fifth waves, and this tendency is especially prevalent for third wave impulses. Intermediate wave (5) to end primary wave 3 may be very swift and strong, ending with a blow off top.
When cycle wave I is complete, then cycle wave II may be a deep correction that may not move beyond the start of cycle wave I below 26.06.
Data from FXCM for USOil does not go back to the beginning of Super Cycle wave (I). Without an accurate known length of Super Cycle wave (I) a target cannot be calculated for Super Cycle wave (III) to end using Fibonacci ratios. The target for Super Cycle wave (III) may be calculated when cycle waves I, II, III and IV within it are complete. That cannot be done for many years.
WEEKLY CHART
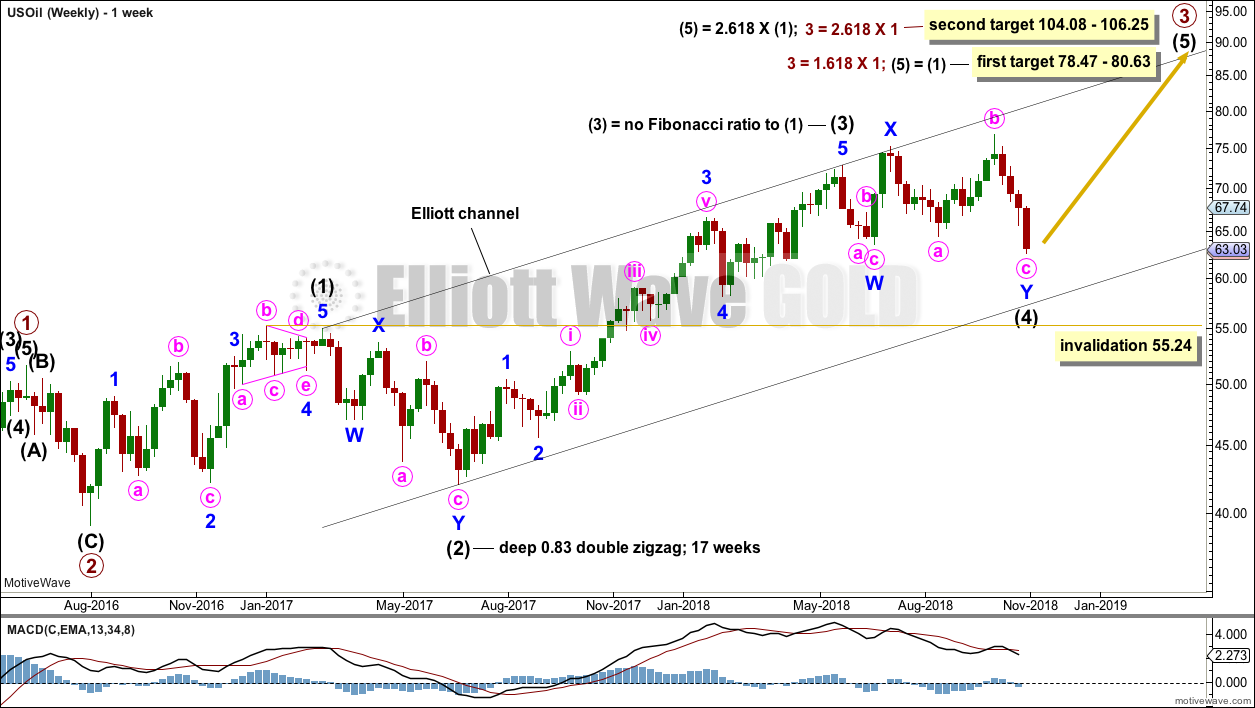
Click chart to enlarge.
Intermediate wave (3) is now complete. There is no Fibonacci ratio between intermediate waves (1) and (3), and intermediate wave (3) is longer than 1.618 the length of intermediate wave (1).
This wave count fits with classic technical analysis at the monthly and daily chart levels.
Intermediate wave (2) was a deep double zigzag. Intermediate wave (4) may now be a complete combination. While combinations are labelled W-X-Y, the same as double zigzags, they are very different structures. Zigzags and multiple zigzags are a separate family of structures to combinations. Combinations belong in the sideways family of corrections, which includes triangles and flats. There is alternation in structure here between intermediate waves (2) and (4).
If intermediate wave (4) continues lower, then look for final support at the lower edge of the black trend channel. This channel sits slightly differently on this weekly chart to the daily chart below, because this weekly chart is on a semi log scale and the daily is arithmetic.
DAILY CHART
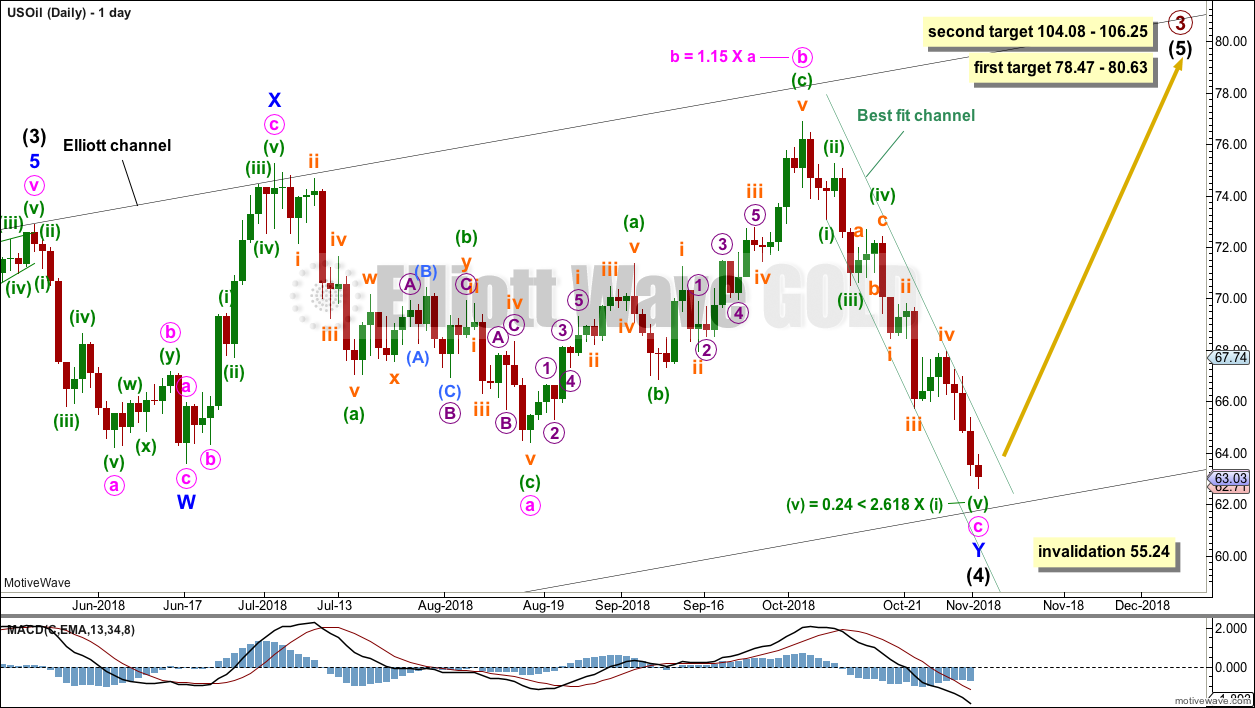
Click chart to enlarge.
Intermediate wave (4) may be now a complete double combination.
The first structure in a double combination may be a complete zigzag labelled minor wave W. There is a little disproportion within minute wave a between the corrections of minuette waves (ii) and (iv), but this is slight enough to be acceptable for this market.
The double is joined by a complete three in the opposite direction, a zigzag labelled minor wave X. X waves within combinations have no minimum nor maximum allowable length, and may make new price extremes beyond the start of wave W as this one does. The only guideline in terms of depth for X waves is that they are normally very deep.
The second structure in a double combination would most likely be a flat correction as the two most common structures in a double combination are one zigzag and one flat.
Within the flat correction of minor wave Y, minute waves a and b both subdivide best as zigzags. This wave count has a good fit and the right look for these waves.
Minute wave c has moved below the end of minute wave a, avoiding a truncation. Minor wave Y has now reached down to about the same level as minor wave W. Minute wave c subdivides as a completed five wave impulse.
Price remains within the narrow best fit channel. A breach of this channel is required for confidence that a low is in place. The breach should be by a full green daily candlestick above and not touching the upper edge of the channel.
If a candlestick reversal pattern appears at the low, that would also offer confidence that a low is in place.
While price remains within the channel, it must be accepted that price may continue to fall. Look for first support at the lower edge of the black channel, which is copied over from the weekly chart. On this daily chart, which is on an arithmetic scale, the trend line is now close by.
TECHNICAL ANALYSIS
MONTHLY CHART
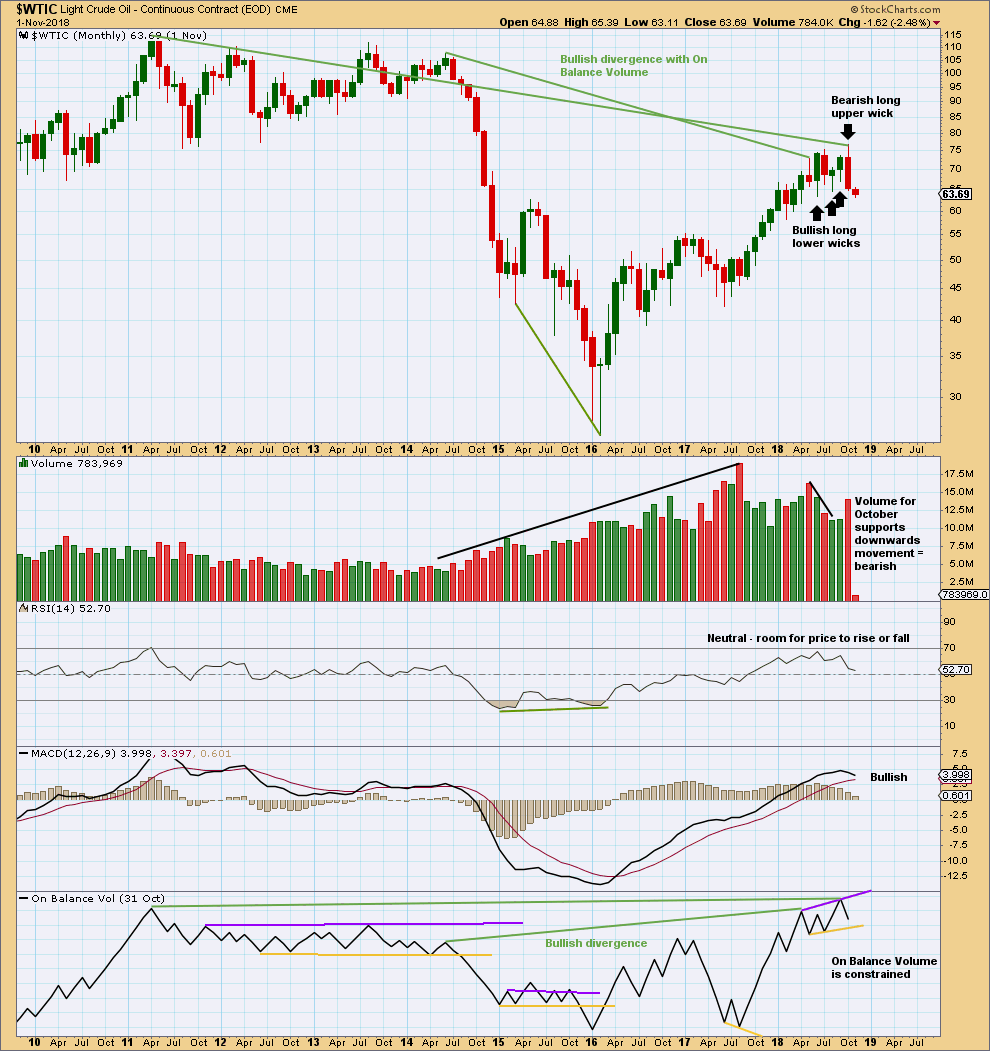
Click chart to enlarge. Chart courtesy of StockCharts.com.
The larger trend remains upwards.
With a long upper candlestick wick and support from volume, the last completed month of October is bearish. On its own, this is not an indication of the end of the upwards trend though; it is noted that August 2017 was similar yet price continued higher.
However, the month of October also completes a Bearish Engulfing candlestick pattern. This is a strong reversal pattern. This offers a warning that the Elliott wave count may be wrong. Members are advised to carefully manage risk if expecting price may continue upwards from here.
The resistance line on On Balance Volume is redrawn; it no longer held technical significance. Bullish divergence between price and On Balance Volume remains, and is still a strong technical indicator that price may continue upwards to make new highs.
WEEKLY CHART
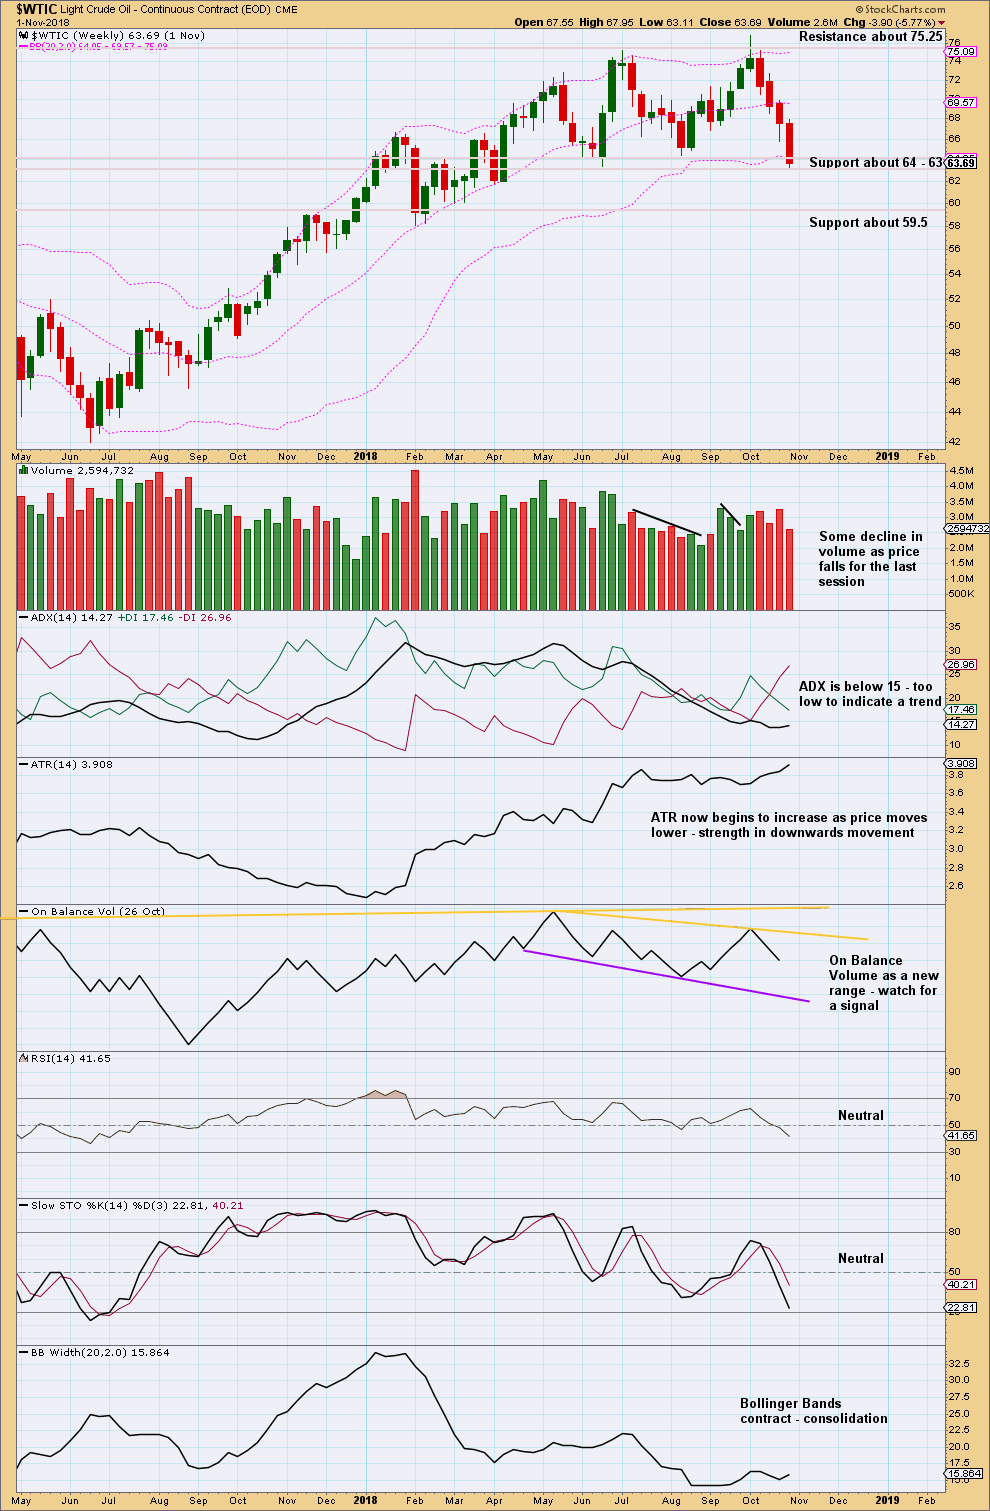
Click chart to enlarge. Chart courtesy of StockCharts.com.
It is upwards weeks during the consolidation that have strongest support from volume. This looks like a continuation pattern. The breakout would most likely be upwards.
Price is now at a strong zone of support. If it breaks below 63, then look for next support about 59.50. Stochastics is nearing oversold. There is a little room here for price to fall further.
DAILY CHART
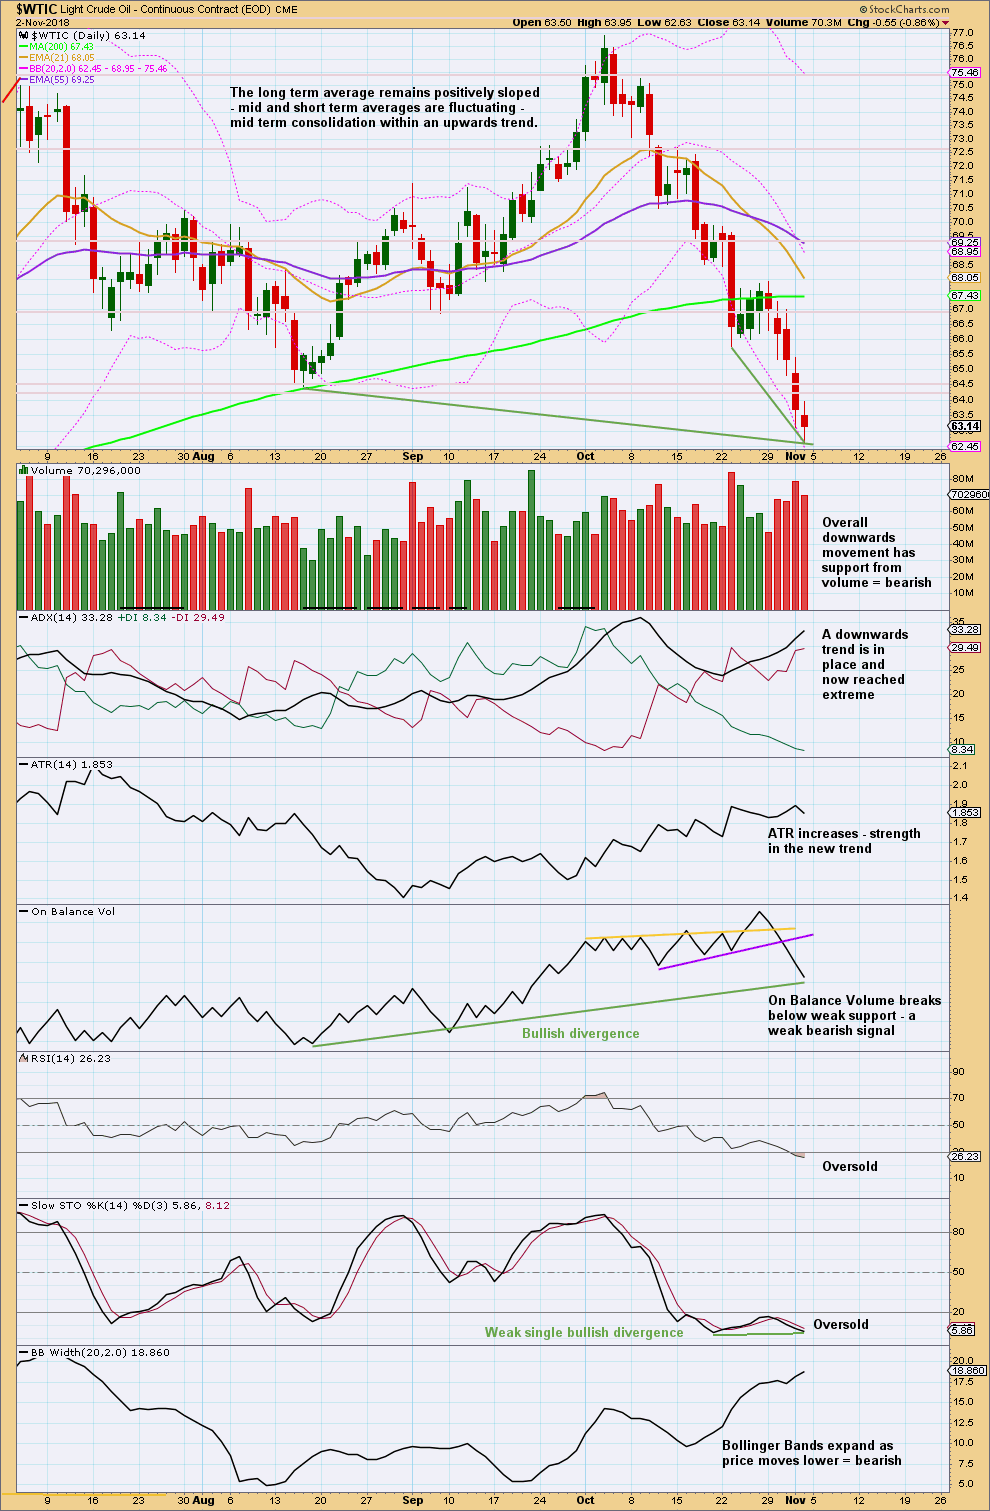
Click chart to enlarge. Chart courtesy of StockCharts.com.
RSI is now oversold and the trend is extreme. Look now for a reversal candlestick pattern to indicate a low in place. At this time, there is no reversal pattern. It is possible price may fall further before finding a low.
The signal from On Balance Volume is weak because the trend line had only two anchor points. Bullish divergence between price and On Balance Volume may be given more weight; this supports the Elliott wave count.
—
Always practice good risk management as the most important aspect of trading. Always trade with stops and invest only 1-5% of equity on any one trade. Failure to manage risk is the most common mistake new traders make.
Hi Laura, It would seem this SPX rally has moved too fast, to far and is due for a pullback. Any thoughts?
Larger count file
Hi Lara
The seemingly impulsive move down in Oil has been interesting. Yesterday Elliottwave international opened up their pro energy services to the world for 3 days. attached are a few reports that have a completely different chart than yours, would appreciate your thoughts on these
Thanks Baron for sharing these charts with us. Today’s (Friday) gap down in OIL sure could look like the 3rd, of a 3rd, of a 3rd etc. down to new lows. It is starting to make me wonder if $55 is going to hold.
Patience is a virtue especially in the markets. I have not opened any long positions in OIL. Yet.
Hi Lara, i have a question about the Elliott wave theory : the 3 wave with in an impulse always subdivides even if not the extended one?
A third wave must always subdivide as an impulse. Third waves are often extended.
There is only one exception to this rule: a third wave within an ending diagonal must always subdivide as a zigzag, within a leading diagonal is most often a zigzag but may also be an impulse.
I’ve answered what I think your question is asking, but I’m not too sure. Feel free to rephrase the question if you wish.
Oil is moving lower, there is still no reversal candlestick pattern and no breach of the green trend channel.
Today price is at the lower edge of the black channel when it is drawn on an arithmetic scale. When drawn on a semi-log scale there is still room here for price to fall further.
I’ll keep watching Oil daily and will post another updated daily chart if I see signs of a reversal.
For now, patience. Wait for a sign that a low is in place before entering long, that is a better approach to risk management. Any long positions entered already have risk still at 55.24.
When entering any position always reduce the size so that you are risking only 1-5% of equity on any one trade. Always use a stop!
Thank you for the update Lara much appreciated.
Well, it looks like OIL was not yet done with the move to the downside. Lara rightly repeats, in a downtrend, certainty of a bottom is elusive. We have little to no confidence until we see a full break above the upper, downward sloping, channel line. I am still waiting. My target for WTIU was $25. But we are falling beyond that. Any price from here down is a gift in my opinion. We need to look for non-confirmations of any and all new lows. Right now the daily MACD is hard down. That supports the continuing bearish case. Hourly MACD is showing some positive divergence right now. But it needs to turn back up in the next day or so other wise the positive divergence will disappear.
Let’s see what this week brings. Have a good one. As Lara resounds, “Manage Risk”, I might add, “Be patient.”