Sideways movement continued, although for less than one day. The breakout was expected to be upwards. The alternate hourly wave count target for sideways movement to end was at 1,311.44 which was met and exceeded by just 1.01.
Summary: Minor wave B is complete as a triangle. Minor wave C may be brief and is extremely likely to fall short of the (A)-(C) trend line on the daily chart. The target for it to end is at 1,343 in one or two days.
Click on charts to enlarge.
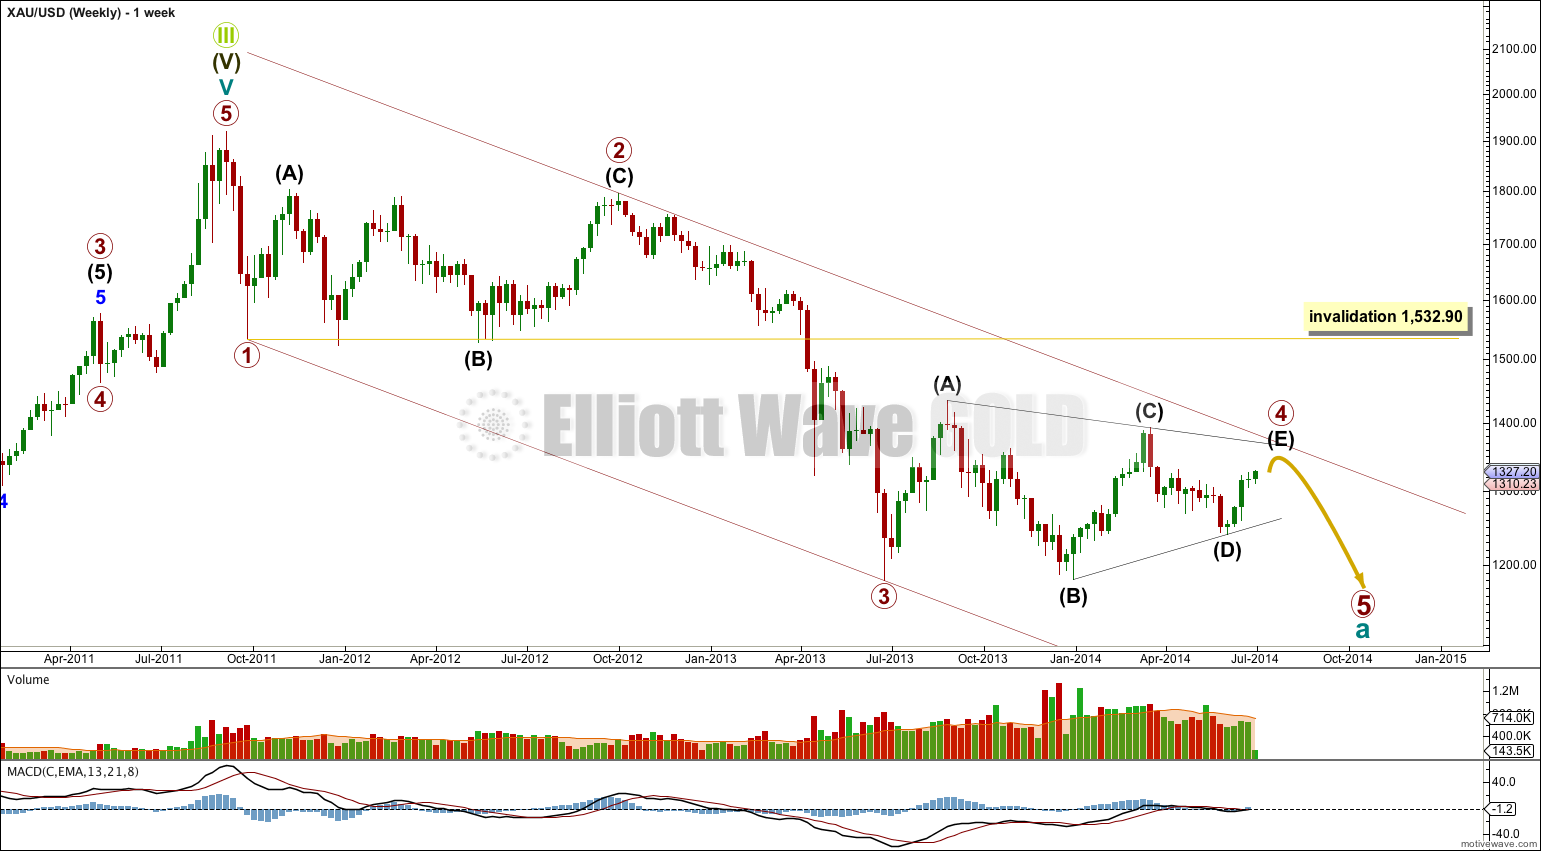
It is time to take a quick look at the bigger picture with primary wave 4 now so close to its end.
This wave count sees a clear five wave structure (that is how it subdivides on the daily chart) for primary wave 1. Any wave count which sees the end of primary wave 1 anywhere else than at that point must clearly explain how it is a five and not a three.
Primary wave 2 was a rare running flat which lasted 53 weeks. Primary wave 4 is a regular contracting triangle which has so far lasted also 53 weeks. If primary wave 4 ends soon it will be perfectly in proportion to primary wave 2 giving this wave count the right look.
Primary wave 3 is 12.54 short of 1.618 the length of primary wave 1.
The channel drawn here uses Elliott’s first technique: draw the first trend line from the ends of primary waves 1 to 3, then place a parallel copy upon the end of primary wave 2. If primary wave 4 overshoots the (A)-(C) trend line of its triangle then it may find resistance at the upper edge of this channel.
When primary wave 4 is done then primary wave 5 downwards should follow. It would most likely be equal in length with primary wave 1 at 388.25.
Primary wave 4 is very close to completion.
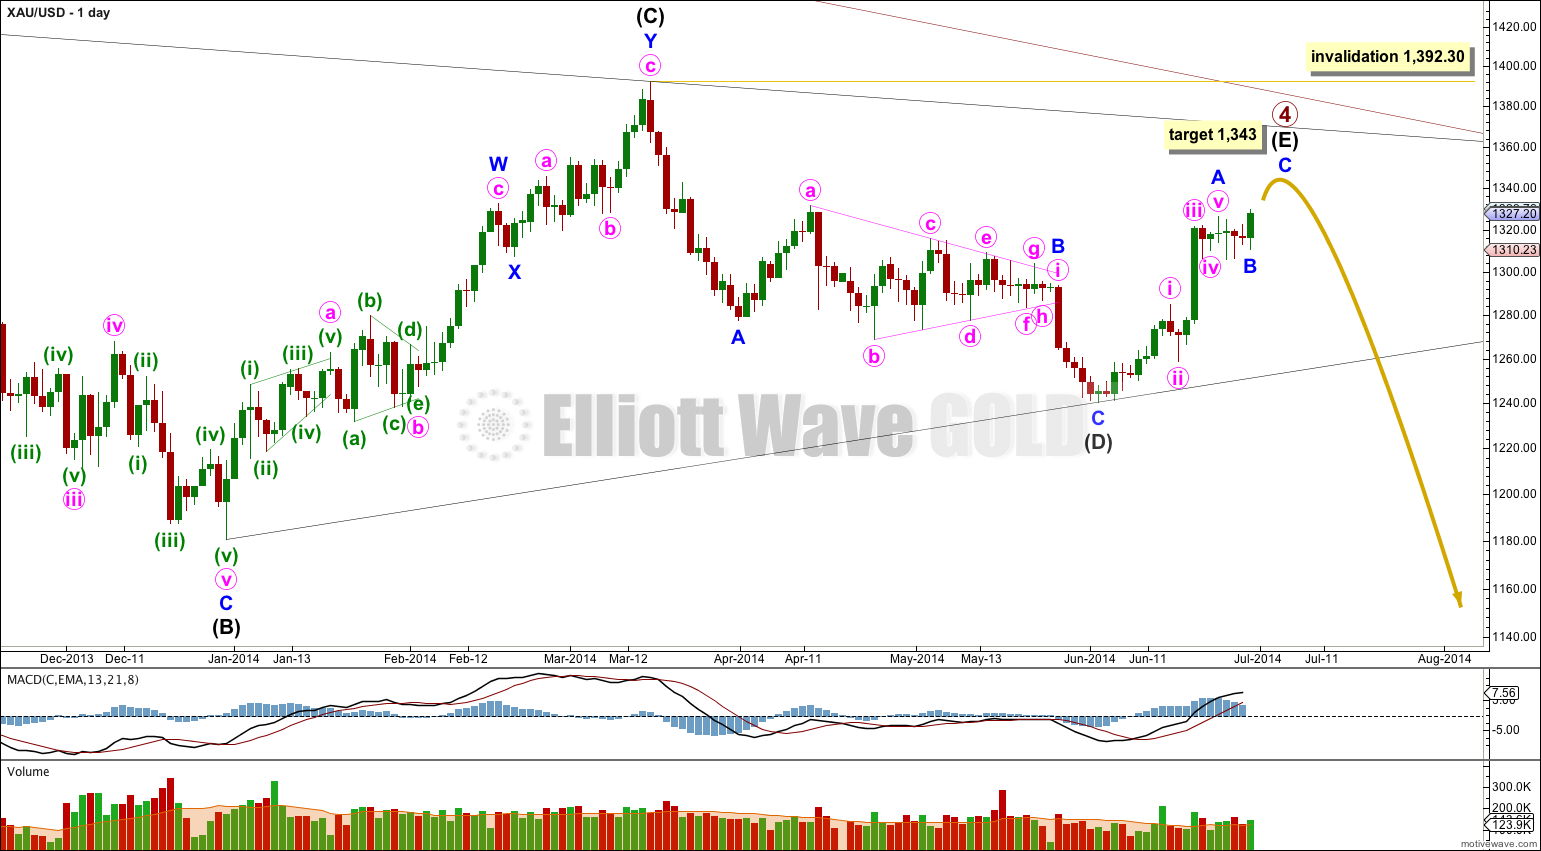
Intermediate wave (E) is most likely to fall short of the (A)-(C) trend line. It may also overshoot this trend line, but that is less common. If it does overshoot this trend line then it may find resistance, and end, at the upper edge of the bigger maroon channel on the weekly chart.
Within the zigzag of intermediate wave (E) minor wave B is now complete as a small triangle and minor wave C has begun. At 1,343 minor wave C would reach 0.382 the length of minor wave A and intermediate wave (E) would end before the (A)-(C) trend line.
When there is more structure within minor wave C to analyse I will be able to calculate a target for it to end at minute degree. The target at 1,343 may widen to a small zone or change.
So far within primary wave 4 intermediate wave (A) lasted 43 days (no Fibonacci relationship), intermediate wave (B) lasted 88 days (just one day short of a Fibonacci 89), intermediate wave (C) lasted 53 days (just two days short of a Fibonacci 55) and intermediate wave (D) lasted 56 days (just one day more than a Fibonacci 55). So far intermediate wave (E) has lasted 19 days and is almost complete. It may complete in a total Fibonacci 21 days (give or take one day either side of this).
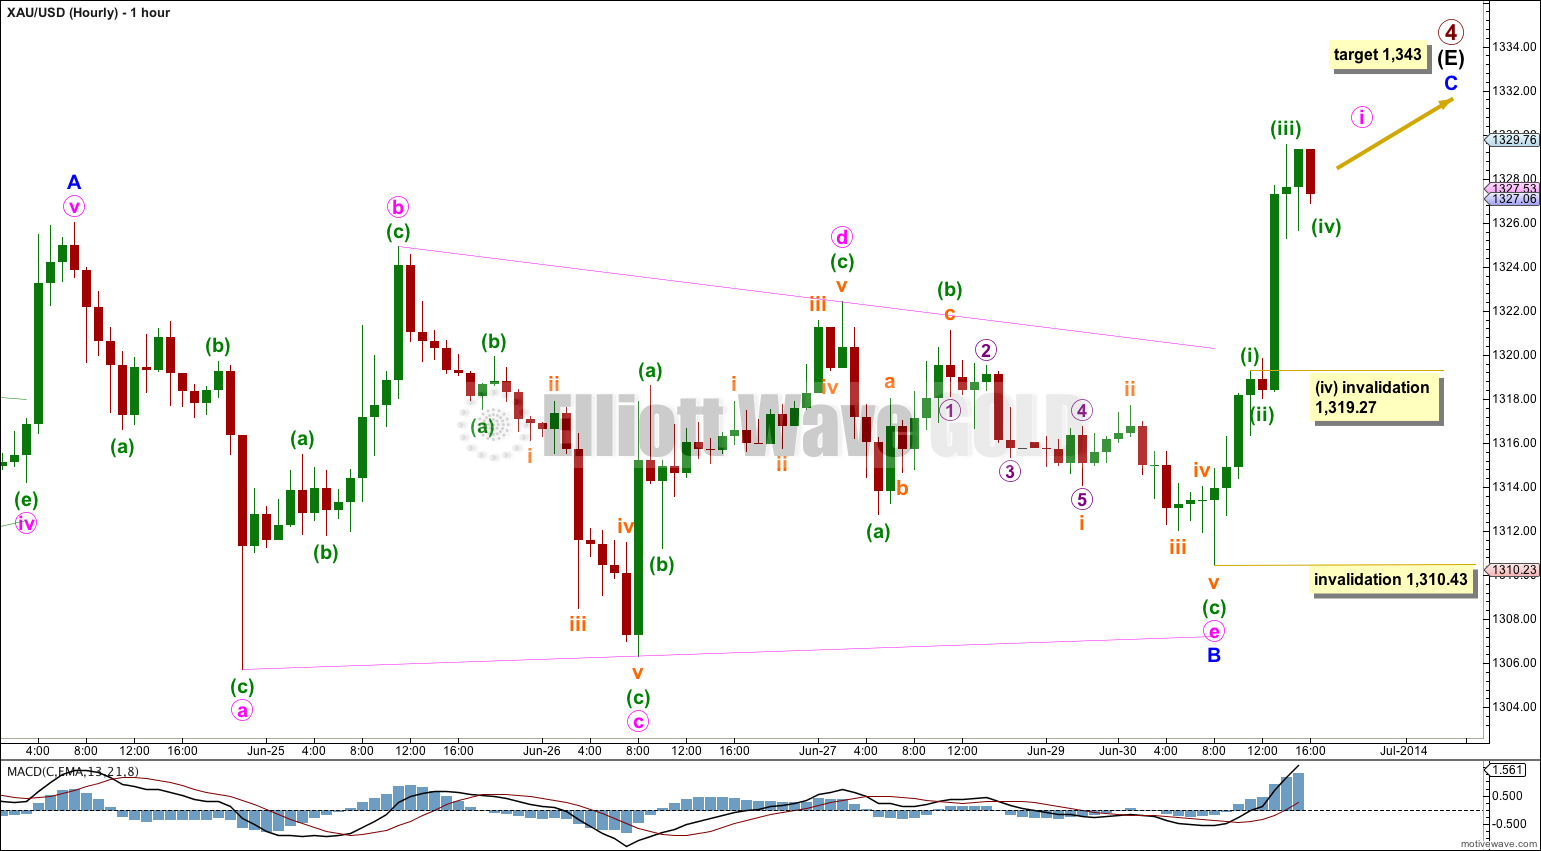
Minor wave B is another perfect contracting triangle with minute wave e falling short of its a-c trend line.
Triangles precede the final movement one degree higher. Minor wave C is the final wave up to complete this entire structure at primary wave degree.
Waves following triangles are usually shorter than the wave which precedes the triangle. I would expect minor wave C to be shorter than minor wave A while also considering the (A)-(C) trend line on the daily chart.
So far within minor wave C there is an almost complete five wave impulse. Minuette wave (iv) may not move into minuette wave (i) price territory below 1,319.27.
When minute wave i upwards is a complete five wave structure then I would expect downwards movement for minute wave ii which may not move beyond the start of minute wave i at 1,310.43. At that stage it would also be entirely possible that minor wave C and so primary wave 4 are complete. At that stage movement below 1,310.43 would indicate that primary wave 5 has begun.
My only concern with this wave count today is what degree of labeling to use on minor wave C upwards. Is this just minute wave i or is minor wave C going to be particularly brief and is it almost over now? The depth of the next wave downwards will answer that question tomorrow.
This analysis is published about 04:55 p.m. EST.


Hi Lara,
I don’t understand. You wrote:
“When minute wave i upwards is a complete five wave structure then I
would expect downwards movement for minute wave ii which may not move
beyond the start of minute wave i at 1,310.43. At that stage it would
also be entirely possible that minor wave C and so primary wave 4 are
complete. At that stage movement below 1,310.43 would indicate that
primary wave 5 has begun.”
Does this mean that there is an alternative that upwards movement will continue above 1343 as minute wave iii and v?
No. At this stage I can only calculate the target at minor degree. It is 1,343. This is where minor wave C would be expected to end.
When minute waves i, ii, iii and iv within minor wave C have completed then I can calculate the target also at minute degree. If I find then a calculation which is very close to 1,343 it would have a high probability. But at that stage the target could change and yes it could be higher.
Without knowing where exactly you see the triangle I cannot answer your question properly. A chart would be required please.
C can touch A, it is movement beyond A which technically invalidates a contracting triangle.
However, that would be a very unusual triangle. The A-C trend line normally slopes. If one of the triangle trend lines is flat is is the B-D trend line in a barrier triangle, not the A-C trend line in a contracting triangle.
Lara I don’t understand how a gold forecast can go from a possible 15-17 days to finish wave E and then the next day it all changes to 1 to 3 days to finish wave E. I have the impression gold is speeding up it’s movements the last few months. It there another explanation?
I am talking about the XAU USD ….in the above chart , the low that the above triangle is showing in “purple circle c” is making a low of $1305.95 on MT4 which is lower than ” purple circle a ” 1307.31, this situation does create a triangle on MT4 while the diagram you are showing one can clearly see a triangle……reference ” the chart at the bottom of this post ” I hope i have made it clear this time.
Hi Lara , I was thinking of the present side movements as a triangle , but on my charting forum MT4 the subwave “c” touches $1305.95 and hence goes beyond end of subwave “a” which is not possible for a contracting triangle , is there something wrong with charting or I am missing some thing, ………………waiting for ur reply