
Sideways movement has not given us clarity. Both Elliott wave counts remain valid.
Summary: It is most likely price will move lower towards 1,300. Thereafter, the depth of upwards movement may give us clarity.
Click on charts to enlarge.
Main Wave Count.
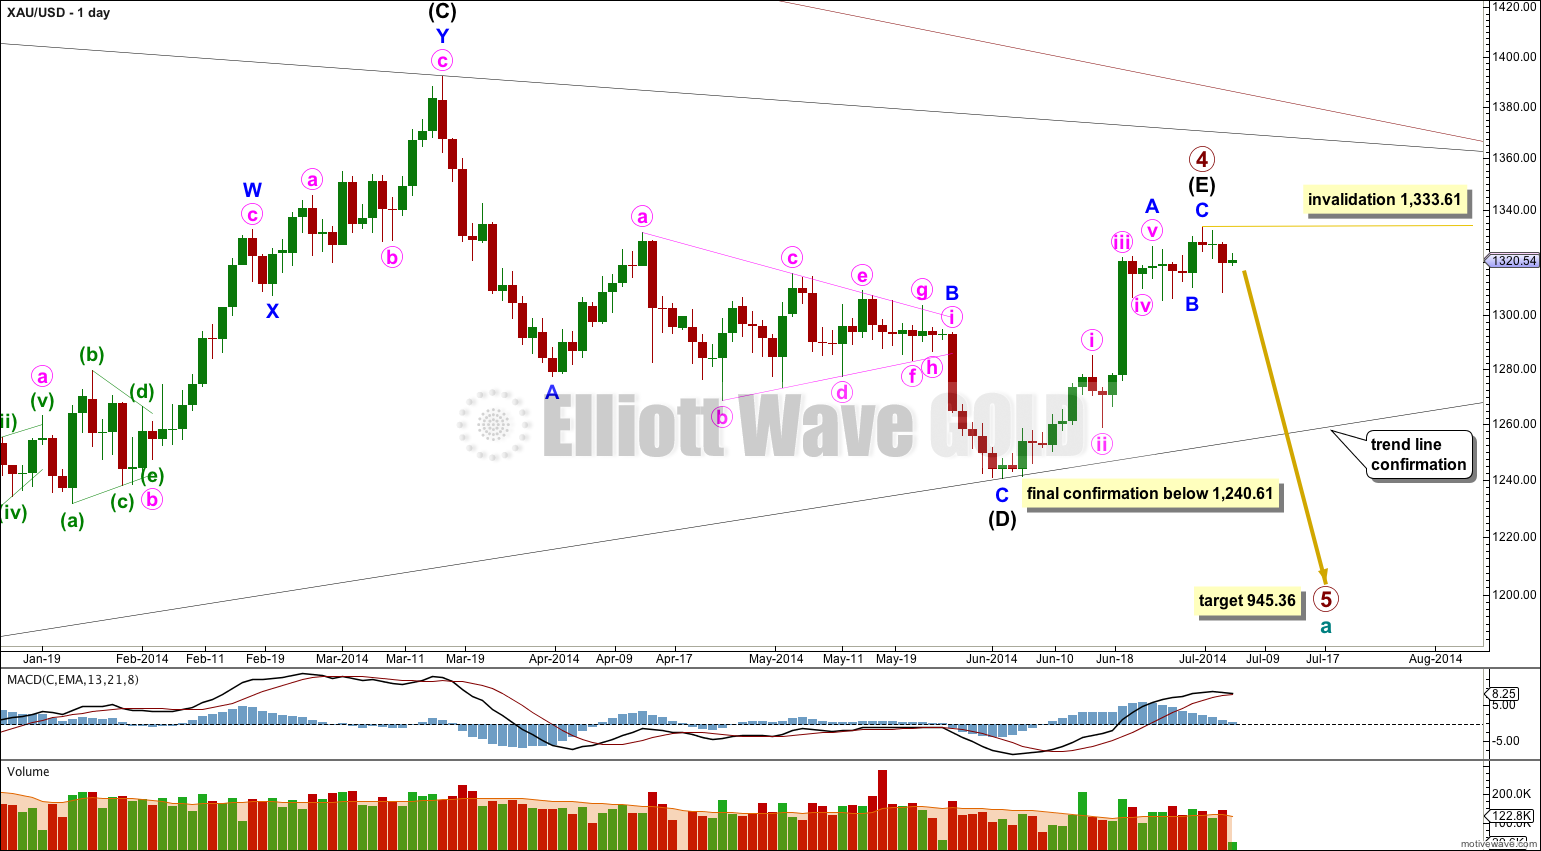
Primary wave 4 may be a complete regular contracting triangle.
Intermediate wave (E) may have ended in just 20 days, one short of a Fibonacci 21. E waves of triangles are often short and brief, and this one looks reasonably typical.
Within primary wave 5 downwards no second wave correction may move beyond the start of its first wave above 1,333.61. Any movement above this point would immediately invalidate this main wave count and clearly confirm the alternate.
A clear breach of the (B)-(D) trend line would provide confidence in this main wave count. Thereafter, full confirmation would come with price movement below 1,240.61.
Sideways movement for 4th July was slow and shallow, which is to be expected when the USA is closed for a holiday. Unfortunately, this does not give us clarity.
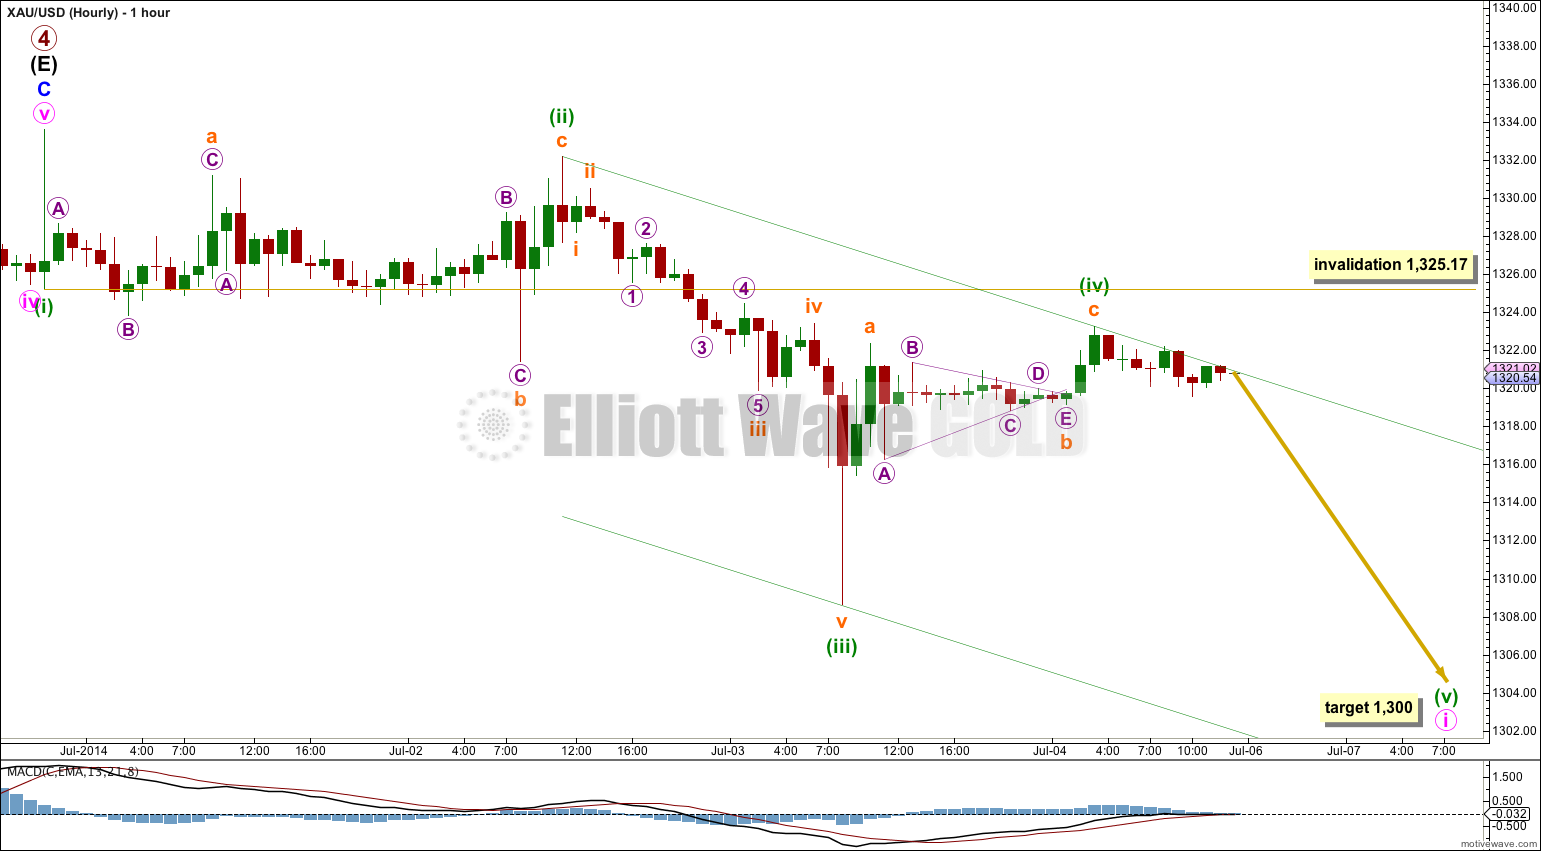
Sideways movement took price outside the channel previously drawn on my main hourly chart using Elliott’s first technique. Sometimes fourth waves are not contained within channels. When this happens we redraw the channel using Elliott’s second technique: the first trend line is drawn from the ends of minuette waves (ii) to (iv), then a parallel copy is placed on the end of minuette wave (iii). I would expect minuette wave (v) to find support at the lower edge of the channel.
If the channel is drawn using Elliott’s first technique then minuette wave (iv) has overshot the channel. This may indicate an overshoot of the channel on the opposite side for the fifth wave down.
Either way, the overshoot of the channel as previously drawn by sideways movement during Friday’s session does not invalidate this wave count.
There is perfect alternation between minuette waves (ii) and (iv): minuette wave (ii) was a deep 83% expanded flat correction and minuette wave (iv) was a more shallow 62% zigzag.
At 1,300 minuette wave (v) would reach equality in length with minuette wave (iii).
If minuette wave (iv) continues higher (as it could as a double zigzag) it may not move into minuette wave (i) price territory above 1,325.17.
Alternate Wave Count.
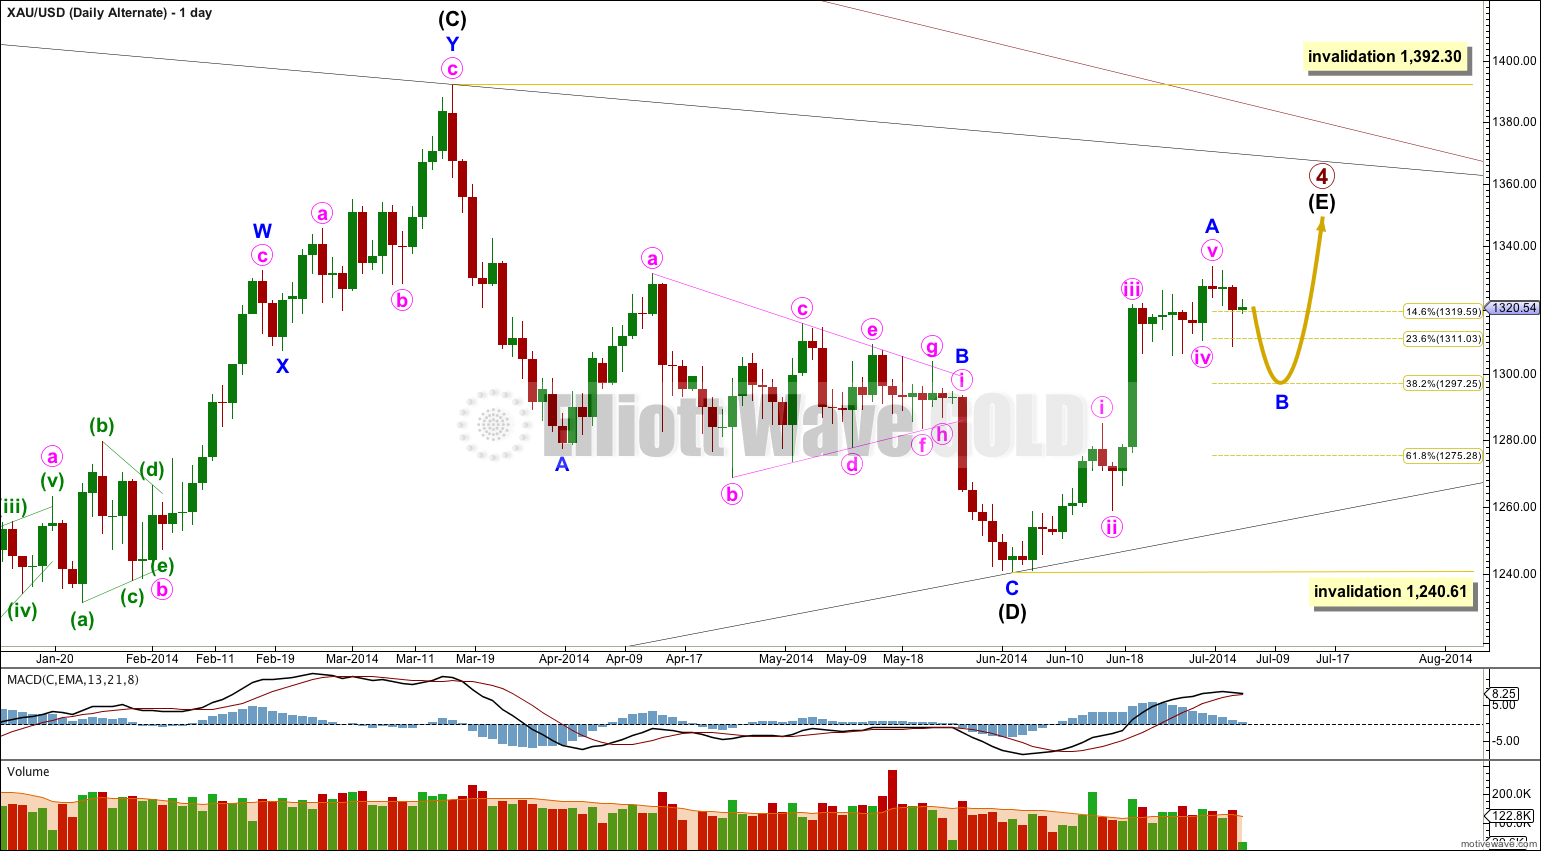
It is possible that only minor wave A is complete and downwards movement may be the start of minor wave B. This wave count could see primary wave 4 last another two weeks to complete in a total Fibonacci 55 weeks which would be very satisfying analytically.
Within minor wave A minute wave ii lasted 29 hours and minute wave iv 154 hours. They are greatly out of proportion and this looks a little odd for Gold on the daily chart. However, fourth wave triangles are more time consuming than second wave zigzags (or in this case a triple zigzag) and so this is possible.
If minor wave B has begun then it should continue for longer than just three days. Overall I would expect it to continue either sideways or lower and last a few more days. If it moved substantially lower it should find very strong resistance at the (B)-(D) trend line. A breach of this trend line would look very atypical and at that stage this alternate would significantly reduce in probability, so much so I may discard it.
Minor wave B may not move beyond the start of minor wave A below 1,240.61. Invalidation of this alternate wave count at the daily chart level would provide full and final confidence in the main wave count.
Minor wave B should move overall lower over the next few days, and may end about the 0.382 Fibonacci ratio of minor wave A at 1,297.25.
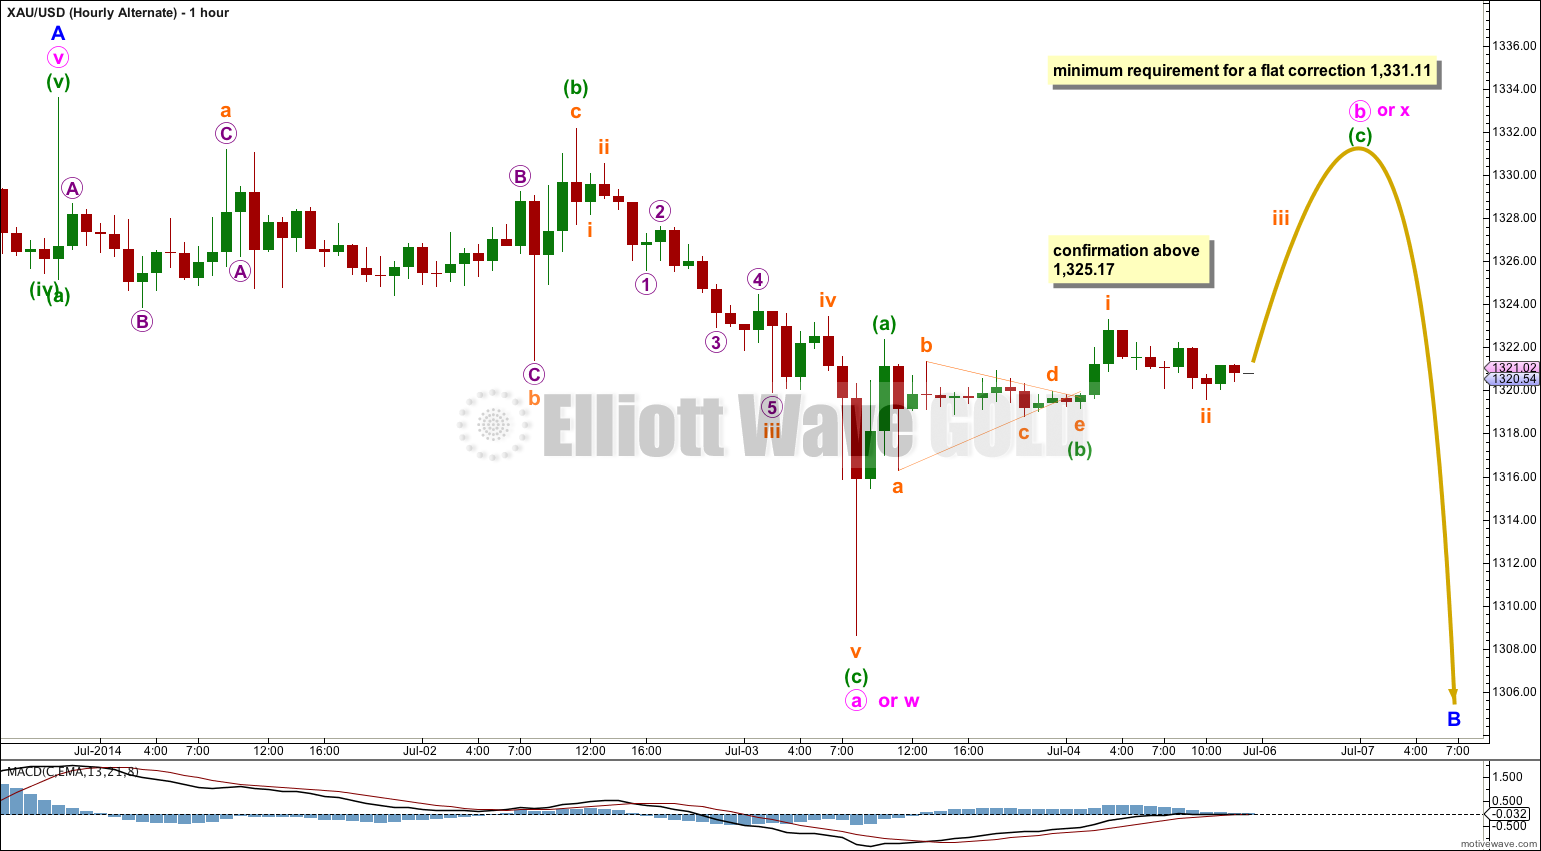
If minor wave B is unfolding there are still several structural possibilities for it. This first hourly wave count looks at three ideas: a flat correction or a double combination or a double zigzag.
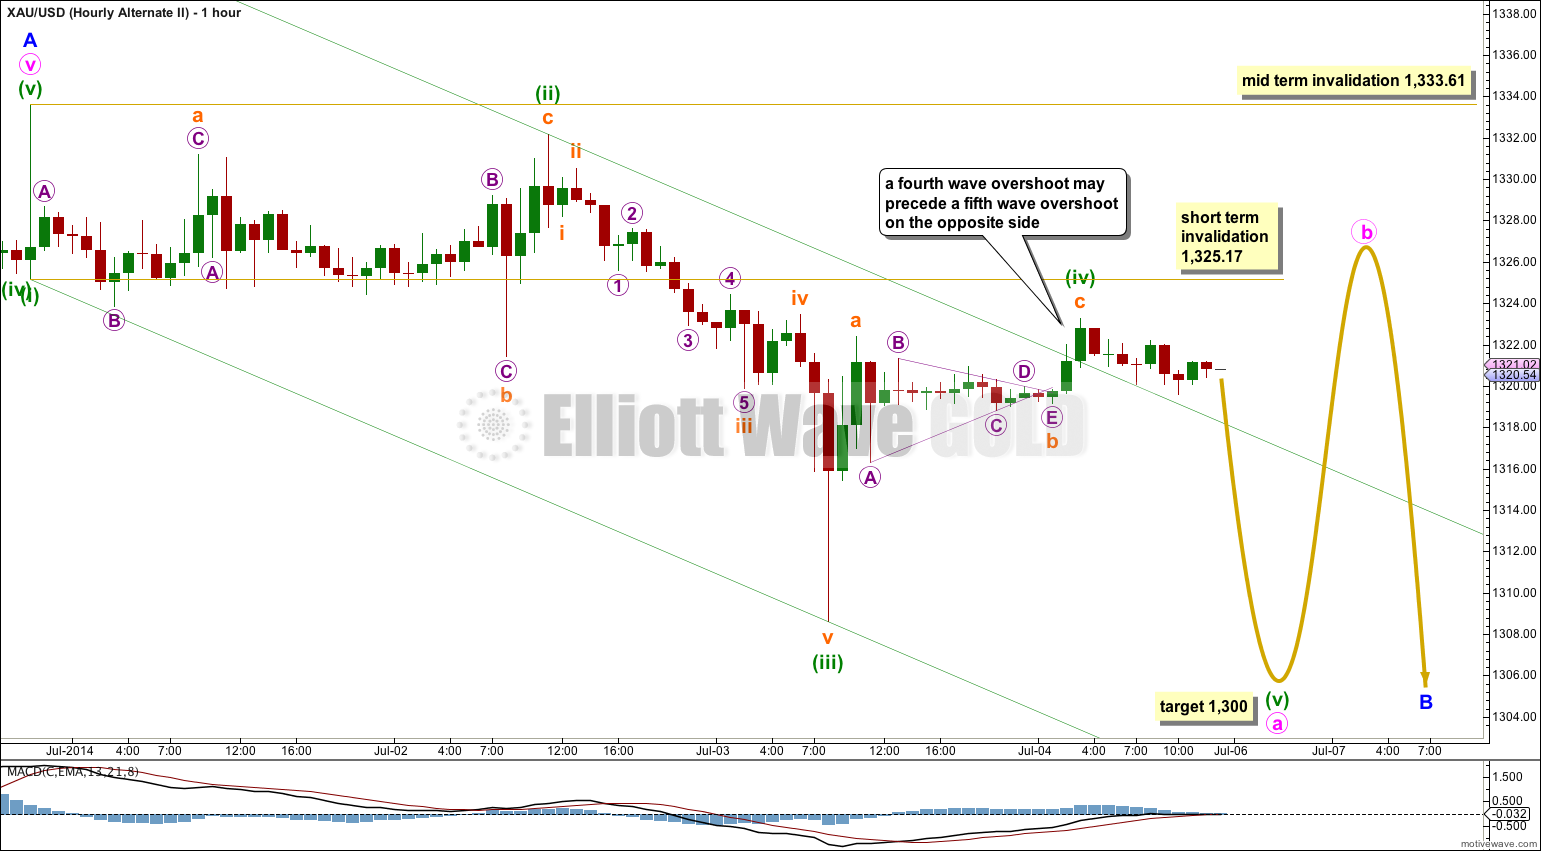
This alternate expects more upwards movement in the short term. If minor wave B is unfolding as a flat correction then within it minute wave a is a complete three and minute wave b must reach up to 90% the length of minute wave a at 1,331.11. Minute wave b may make a new high above the start of minute wave a at 1,333.61 which would firmly invalidate the main wave count and provide full and final confirmation of this alternate.
If minor wave B is a double zigzag or double combination then minute wave w was a zigzag. Minute wave x does not have to reach up to any particular point, and indeed it could be over already. If minute wave y unfolds as a zigzag then minor wave B should move substantially below 1,308.63 as the purpose of double zigzags is to deepen a correction when the first zigzag does not move price deep enough. If minute wave y is a flat or triangle then it should end about the same point as minute wave w at 1,308.63 because the purpose of double combinations is to take up time and move price sideways.
Any movement above 1,325.17 would provide a high level of confidence in this alternate wave count.
Minor wave B may also be unfolding as a single zigzag. Within a zigzag minute wave a must subdivide as a five wave structure, which is either an impulse (most likely) or a leading diagonal (less likely). Clearly downwards movement is not a diagonal so minute wave a may be an incomplete impulse.
This alternate idea expects exactly the same movement next as the main wave count. Within the zigzag minute wave b may not move beyond the start of minute wave a above 1,333.61. Thereafter, minute wave c would be expected to be about the same length of minute wave a and should unfold as a five wave structure downwards.
If this alternate idea unfolds correctly then once we have a 5-3-5 downwards complete minor wave B may be a complete zigzag. It is only at that point this alternate would diverge from the main wave count. At that stage the main wave count would expect a three wave correction upwards for a fourth wave, and this alternate would expect a five wave structure upwards for minor wave C. The end of minute wave a would be the price point which differentiates the two wave count. This alternate would expect new highs above the end of minute wave a and the main wave count would not expect the fourth wave upwards to move back into first wave price territory.
On this chart I have drawn the channel about this downwards movement using Elliott’s first technique. Sometimes a fourth wave overshoot of the channel precedes a fifth wave overshoot on the opposite side. Both channels should be considered.
This analysis is published about 10:53 p.m. EST.
It appears that gold has once again overshot the main hourly channel, even after it was redrawn. Is that ok – as long as gold remains under 1325 – or do you see this as a signal that more upwards movement is coming? Guess we’ll find out soon enough in your analysis. Thanks.
Yes, your questions were answered in the next analysis. It was significant that overshoot.