More sideways movement has still not clarified the situation. The Elliott wave counts at the hourly chart level are adjusted. The triangle idea was invalidated, but a close relative, the ending diagonal, may be unfolding.
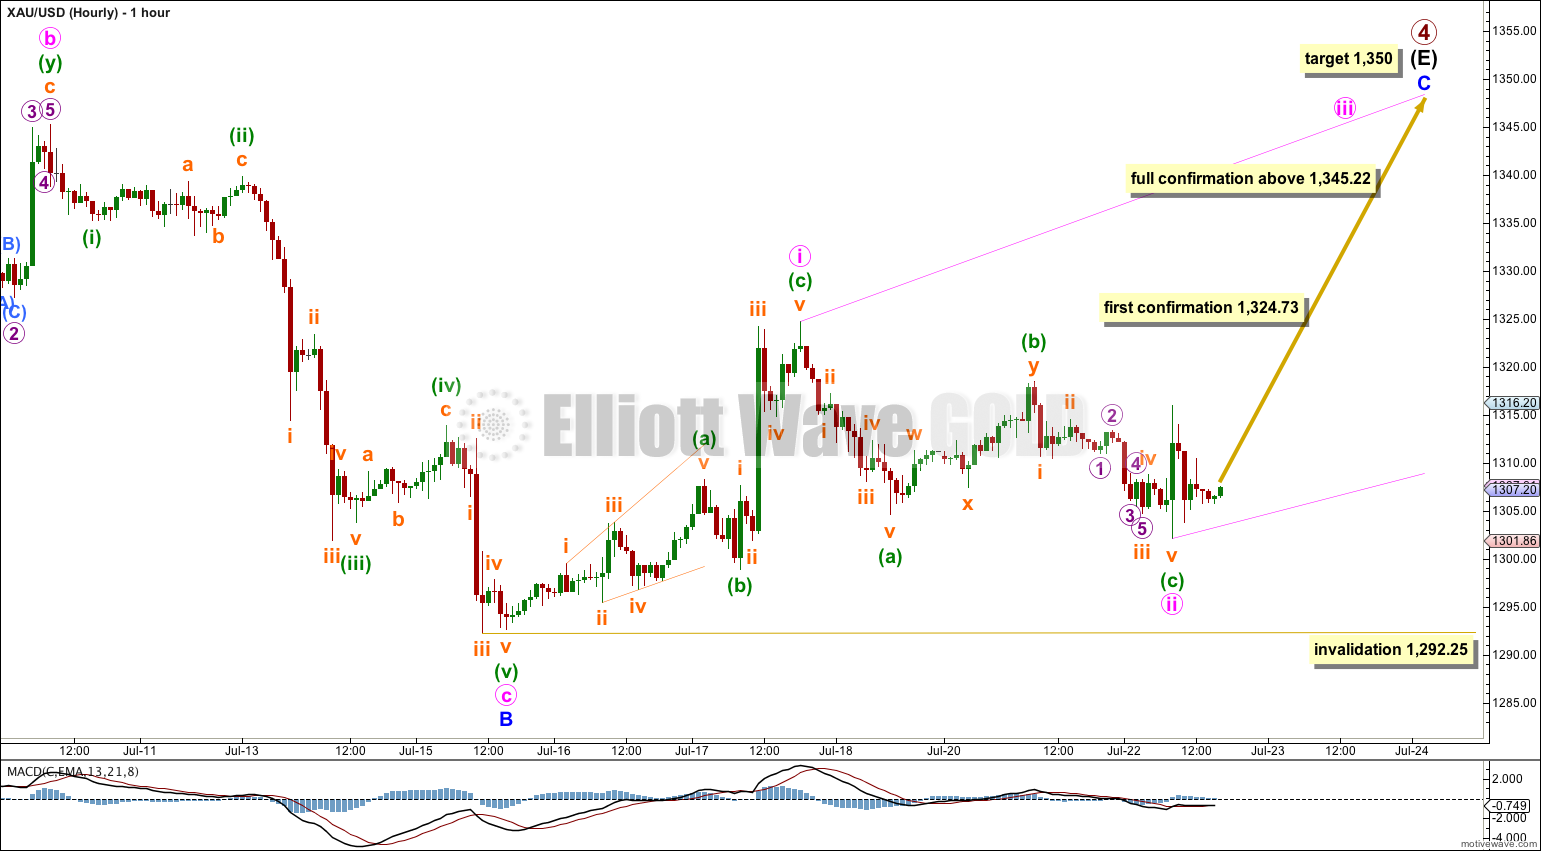
Summary: Upwards movement is more likely, I would judge it to have about a 60% probability. The target is 1,350. This would be confirmed with a break above 1,324.73. A break below 1,292.25 would indicate more downwards movement.
Click on charts to enlarge.
Main Wave Count.
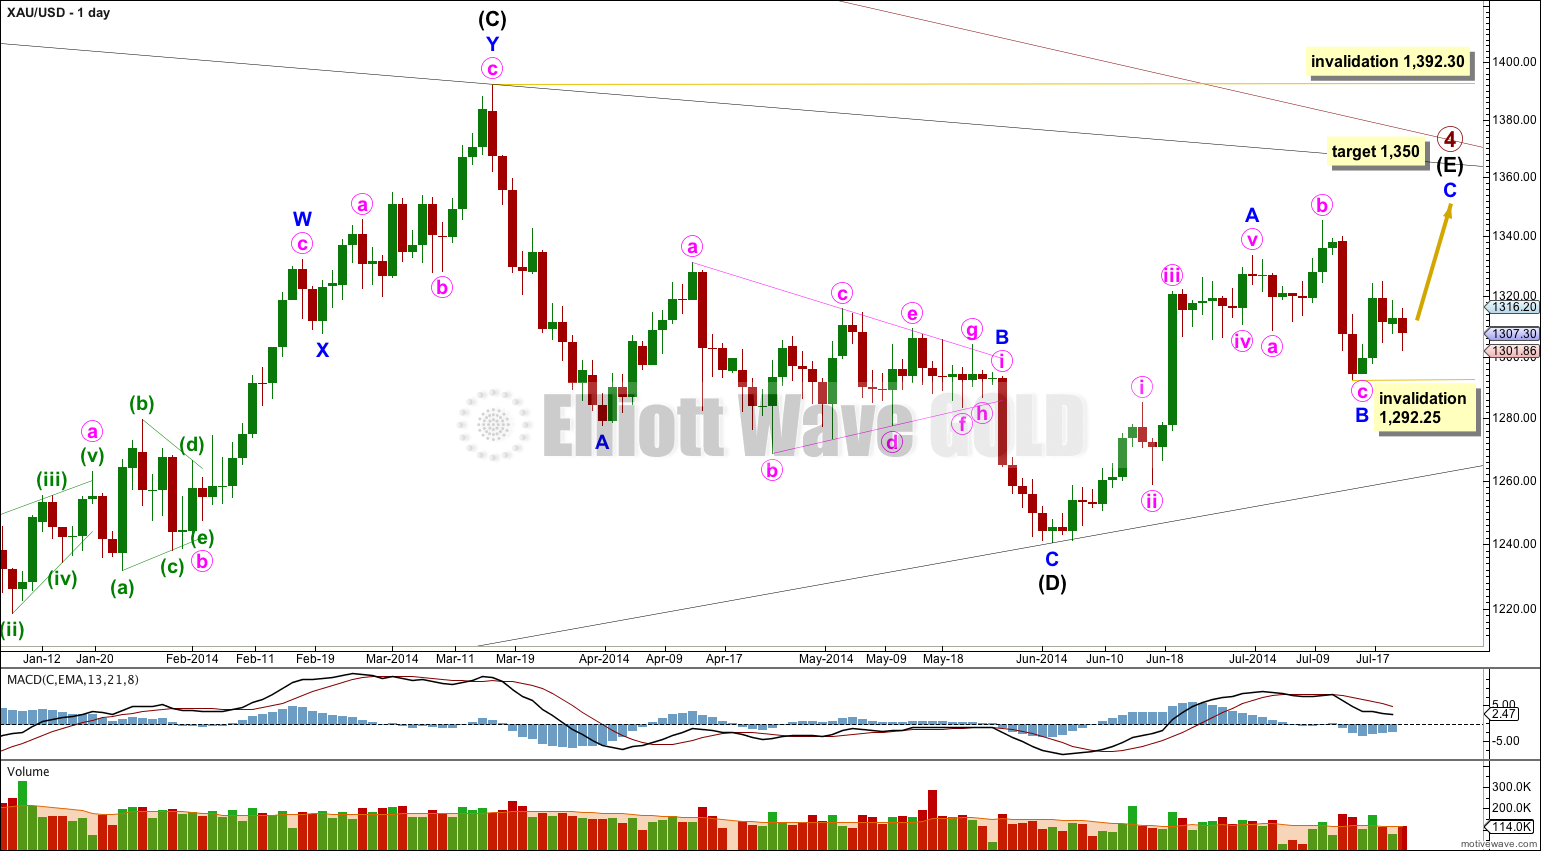
Primary wave 4 is an almost complete regular contracting triangle, now in its 56th week. If it ends within the next few days it will be close enough to a Fibonacci 55 weeks to exhibit a Fibonacci duration.
The final zigzag of intermediate wave (E) may be just a few days away from completion. Within it minor wave B can be seen as a complete expanded flat. There is no Fibonacci ratio between minute waves a and c.
At 1,350 minor wave C would reach 0.618 the length of minor wave A. Minor wave C is extremely likely to at least make a new high above the end of minor wave A at 1,333.61 to avoid a truncation.
When minor wave C is a complete five wave structure then I will expect a primary degree trend change. Eventually a clear breach of the lower (B)-(D) trend line of this triangle will provide confirmation that primary wave 4 has ended and primary wave 5 has then begun.
Despite movement below 1,304.60 this main hourly wave count still has a better overall look, and I would judge it to have about a 60% probability.
The downwards wave labeled minute wave c subdivides nicely as a five wave impulse. It looks like a separate structure to subsequent sideways movement.
There are two structural possibilities for minor wave C: either a simple impulse (most common) or an ending diagonal (less common). So far upwards movement is subdividing as zigzags and this indicates a diagonal.
Ending diagonals require all their subwaves to subdivide as single zigzags because no other structures are possible. So far minute waves i and ii subdivide well as single zigzags.
Minute wave ii, if it continues, may not move beyond the start of minute wave i below 1,292.58. I will leave the invalidation point at the price low at 1,292.25 to allow for the possibility that my labeling at the end of minor wave B may be wrong.
Minute wave iii of the possible diagonal must make a new high above the end of minute wave i at 1,324.73. This would invalidate the second hourly chart below and provide strong confirmation of this first hourly chart.
Minute wave iv must overlap back into minute wave i price territory, but may not move beyond the end of minute wave ii.
Overall this first hourly chart expects more choppy overlapping movement for a few days yet, generally trending upwards towards the target at 1,350.
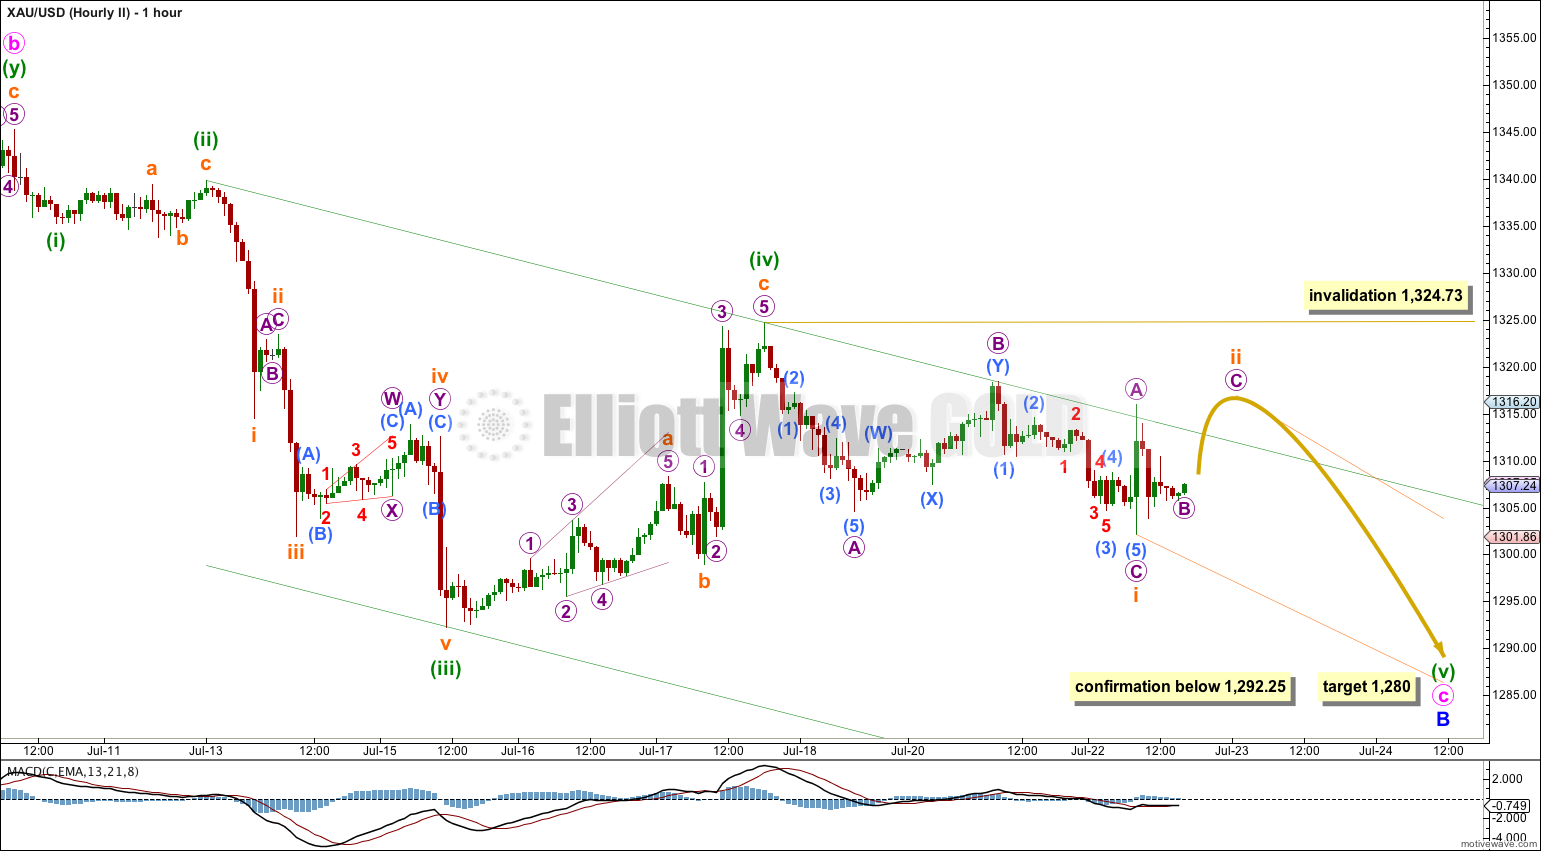
This second hourly chart considers the possibility that minor wave B downwards is incomplete. This does not have the right look and I would judge this idea to have only about a 30% probability.
Minuette waves (ii) and (iv) are out of proportion; minuette wave (ii) lasted 25 hours and minuette wave (iv) lasted 53 hours. This gives the wave count a strange look and reduces its probability.
Minuette wave (v) may be only one of two structures: an impulse (most common) or an ending diagonal (less common). So far downwards movement looks like a zigzag and so an ending diagonal could be unfolding downwards for a fifth wave.
When fifth waves unfold as diagonals they are very rarely truncated. This second wave count would expect to see a new low below 1,292.25 as extremely likely.
If price breaks below 1,292.25 then this idea has a higher probability than the alternate daily wave count below. I would expect downwards movement to end about 1,280 where minute wave c would reach 2.618 the length of minute wave a.
Within minuette wave (v) ending diagonal subminuette wave ii may not move beyond the start of subminuette wave i above 1,324.73.
Alternate Wave Count.
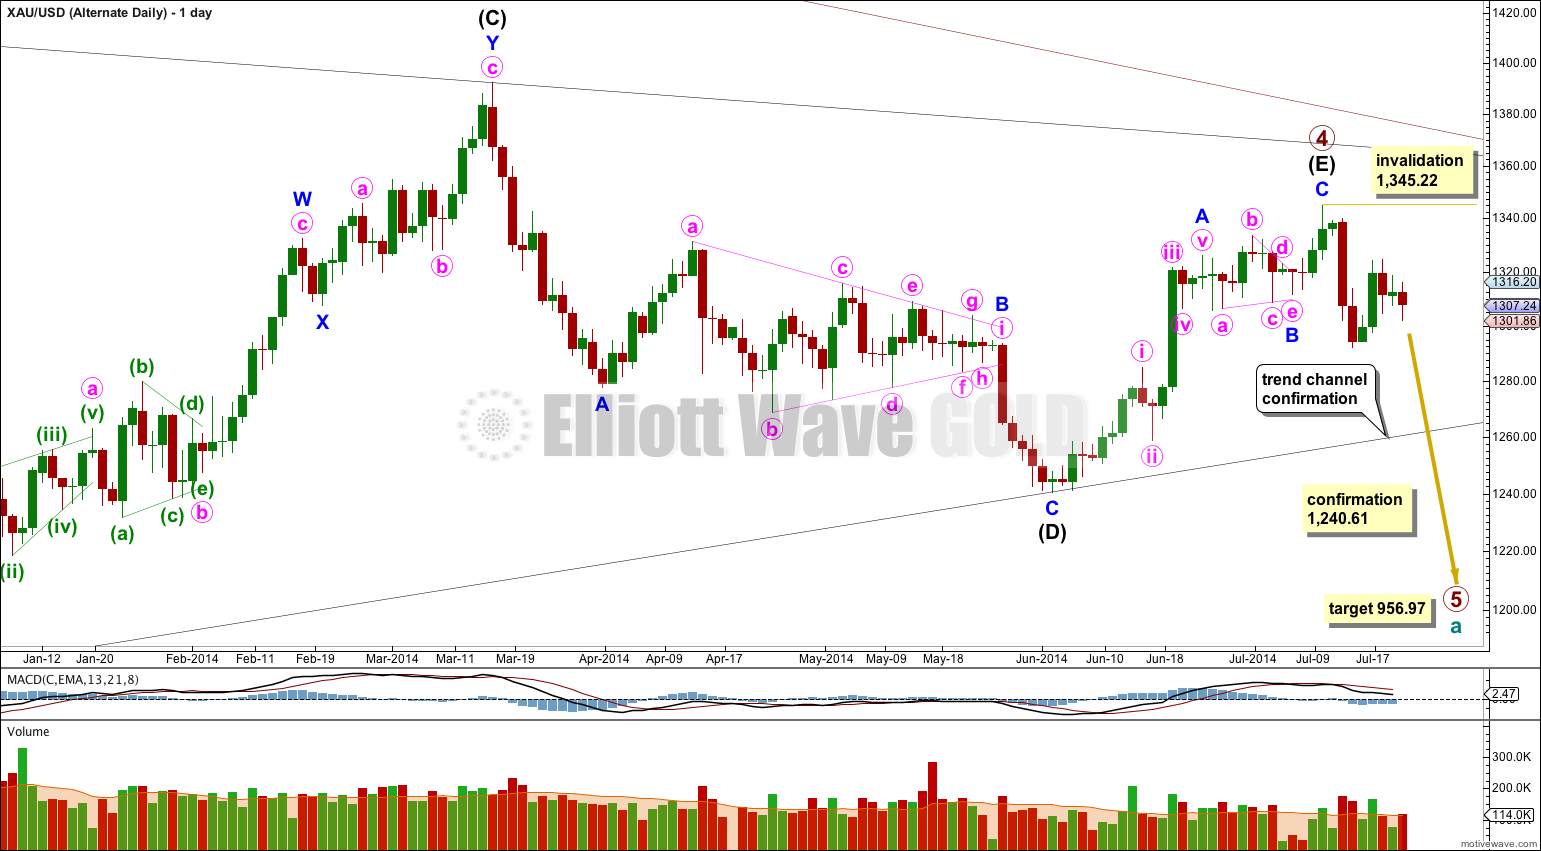
It is possible that primary wave 4 is complete in a total 54 weeks, just one short of a Fibonacci 55 and just one week longer than primary wave 2 which was 53 weeks in duration.
The subdivisions for this alternate do not have as neat a fit as the main wave count:
– The triangle for minor wave B has an overshoot of the b-d trend line within minute wave c which looks significant on the hourly chart.
– At the end of minor wave A minute wave v does not subdivide well as a five wave structure on the hourly chart. This movement fits better as a three.
– Minor wave C subdivides here as a five wave structure, but it has a much better fit as a zigzag (which is how the main wave count sees it).
For the three reasons above this alternate has a lower probability. I would judge it at this stage to have about a 10 – 20% probability.
The differentiating point is the lower (B)-(D) trend line here on the daily chart. If this trend line is breached by a full daily candlestick below it and not touching it then I would discard the main wave count and this alternate would be my only wave count.
At 956.97 primary wave 5 would reach equality in length with primary wave 1. Primary wave 1 was a remarkably brief three weeks in duration. Primary wave 5 could also be as brief, but it is more likely to show a little alternation and be longer lasting.
At this stage I do not want to publish an hourly wave count for this alternate because the situation for the short term is unclear. Downwards movement may be a completed first wave, or it may be only within a fourth wave triangle and the first wave down may be incomplete. Movement below 1,304.60 would increase the probability of this alternate, but only a breach of the (B)-(D) trend line would provide me with confidence in it.
This analysis is published about 05:25 p.m. EST.


Apologies. There was a wrong permission setting which now is fixed. GDX is now available.
Hello Lara, I’m not seeing the GDX charts you emailed me about an hour ago? Thank you.