Upwards movement was expected for Gold but has not happened. The correction continued lower, and sideways movement completed a small green doji. The main and alternate Elliott wave counts remain mostly the same.
Summary: I expect overall upwards movement here for a minor degree wave to just above 1,345.22, to last about 17 days in total. So far it has lated three days. In the short term I still expect that a third wave up is beginning. The target is at 1,310. I will have full confidence in the main wave count above 1,304.88.
Click on charts to enlarge.
Main Wave Count.
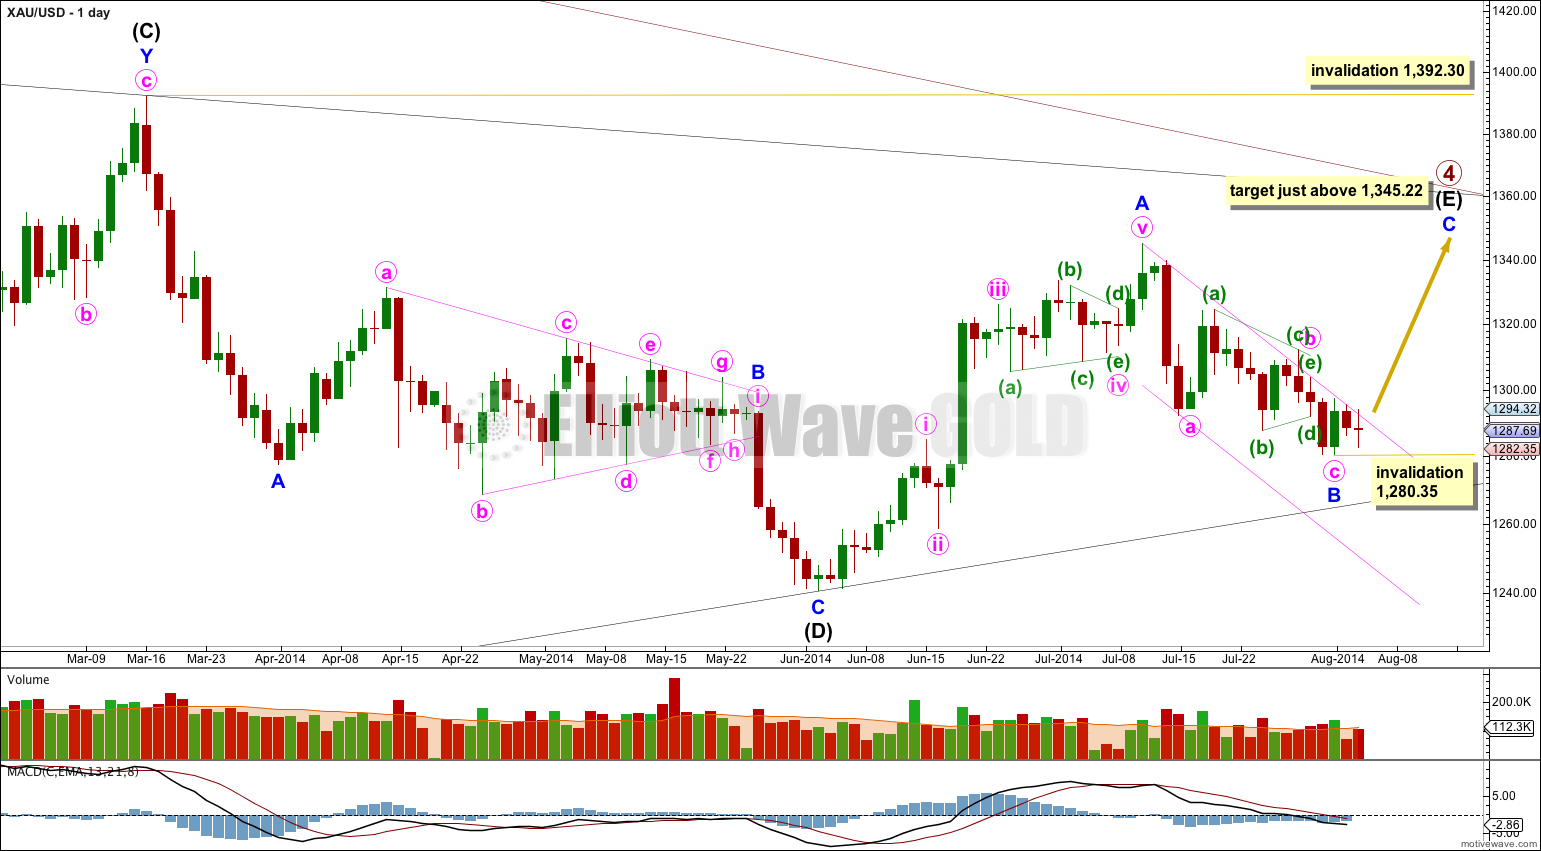
The main wave count sees primary wave 4 as an incomplete regular contracting triangle. Primary wave 2 was a deep 68% running flat correction. Primary wave 4 is showing alternation in depth and some alternation in structure.
Within the triangle of primary wave 4 intermediate wave (E) is unfolding as a zigzag: minor wave A is a five wave impulse and minor wave B downwards is now a complete zigzag. I have drawn a corrective channel about minor wave B downwards. Apart from a small overshoot within the triangle of minute wave b this channel shows perfectly where price is finding resistance currently. This channel is further support of this wave count.
Because there is a clear triangle within this downwards wave of minor wave B, this movement cannot be a new impulse to the downside because a triangle may not be the sole corrective structure in a second wave position. The position of this triangle indicates strongly that intermediate wave (E) is incomplete.
Within minor wave C no second wave correction may move beyond its start below 1,280.35.
Intermediate wave (E) may not move beyond the end of intermediate wave (C) above 1,392.30.
I can see another alternate possibility today. If primary wave 4 is over at the high labeled minor wave A within intermediate wave (E) then it is possible that primary wave 5 is beginning with a leading diagonal in a first wave position. However, leading diagonals in first wave positions are not very common. This alternate idea is possible, but I judge it to have a very low probability, maybe as low as 5%. I will only publish this idea if the black (B)-(D) trend line is clearly breached.
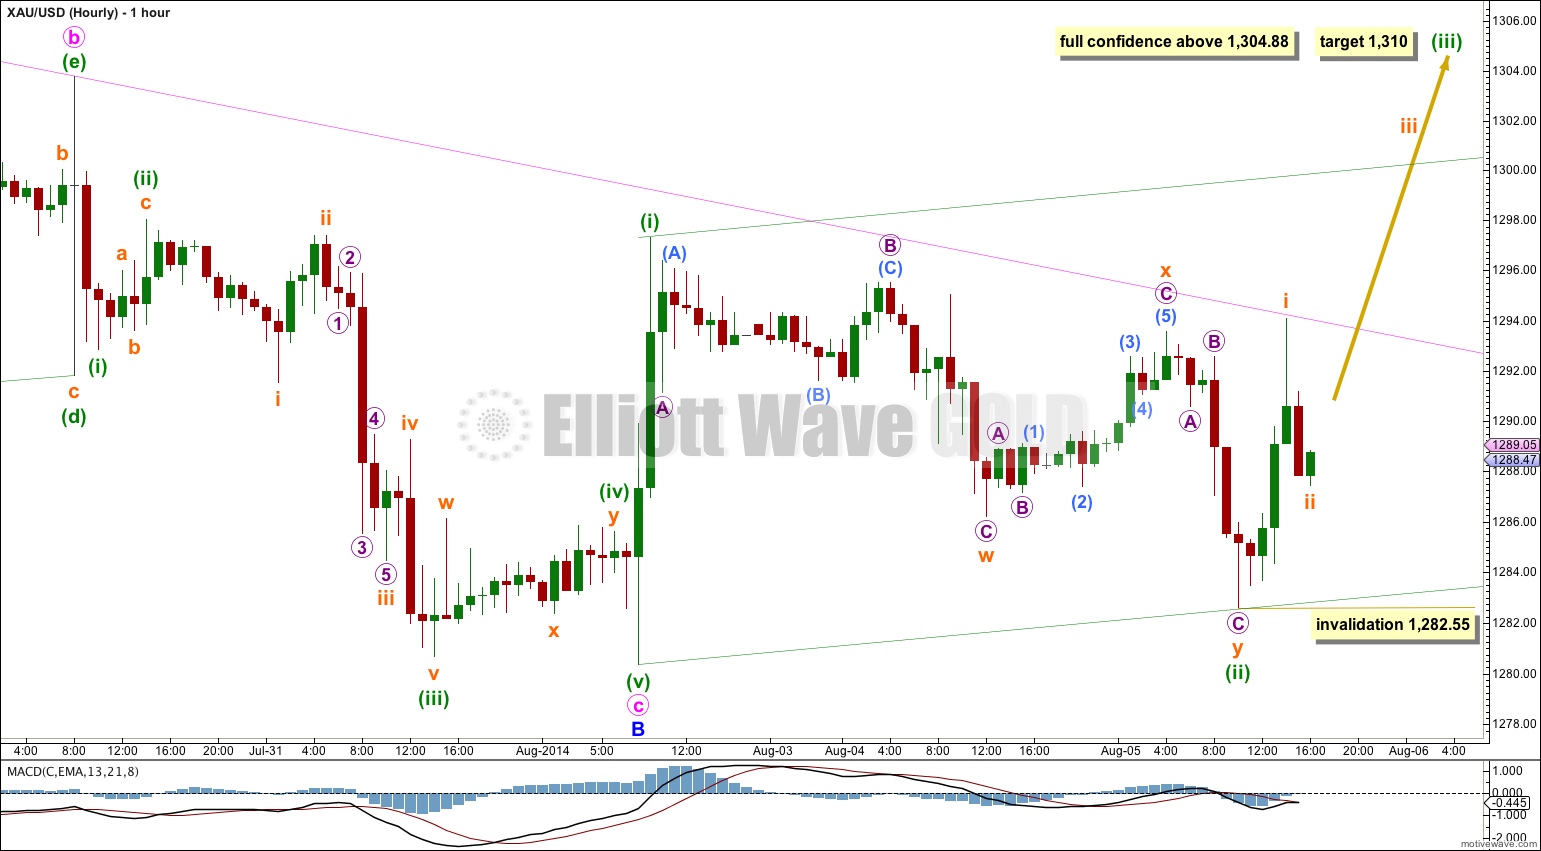
Minuette wave (ii) continued further as a double zigzag. The second zigzag in the double deepened the correction.
At 1,310 minuette wave (iii) would reach 1.618 the length of minuette wave (i).
Once upwards movement manages to break through the upper edge of the pink channel which contains minor wave B downwards then I would expect to see an increase in upwards momentum. If this wave count is correct then this should happen within the next 24 hours. If it does not then this wave count will significantly reduce in probability.
If subminuette wave ii continues further (and it most certainly could because it is not yet a very clear “three”) then it may not move beyond the start of subminuette wave i below 1,282.55.
This main wave count expects to see a strong increase in upwards momentum in the next 24 hours, before next analysis is due.
I will have full confidence in this main wave count with price movement above 1,304.88.
Alternate Wave Count.
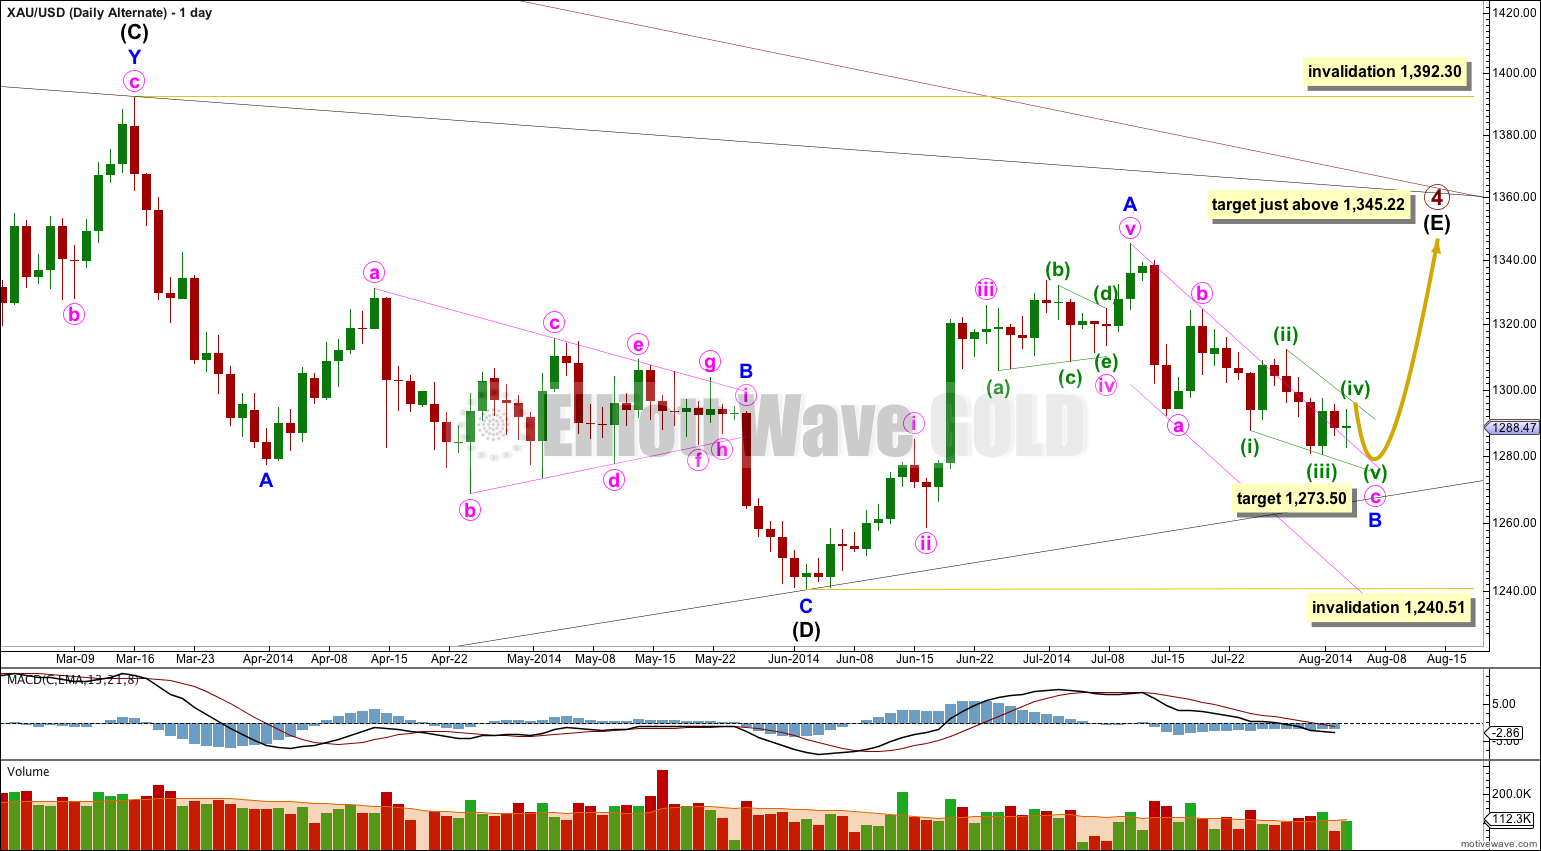
If minute wave b was not a triangle but a sharp zigzag ending higher up then minute wave c may be unfolding as an ending contracting diagonal.
Within the diagonal minuette wave (iii) is shorter than minuette wave (i). This means that minuette wave (iv) must be shorter than minuette wave (ii). The diagonal trend lines should converge. Only the final fourth and fifth wave zigzags need to complete this structure. At 1,273.50 minute wave c would reach equality in length with minute wave a.
When minute wave b ends at the point labeled and a trend channel is drawn about this downwards zigzag then minuette wave c does not remain contained within the channel. Normally Gold has structures which look fairly typical and are nicely contained within normally drawn channels. This wave count does not have a typical look for Gold. I would judge this problem to reduce the probability of this alternate to below 20%.
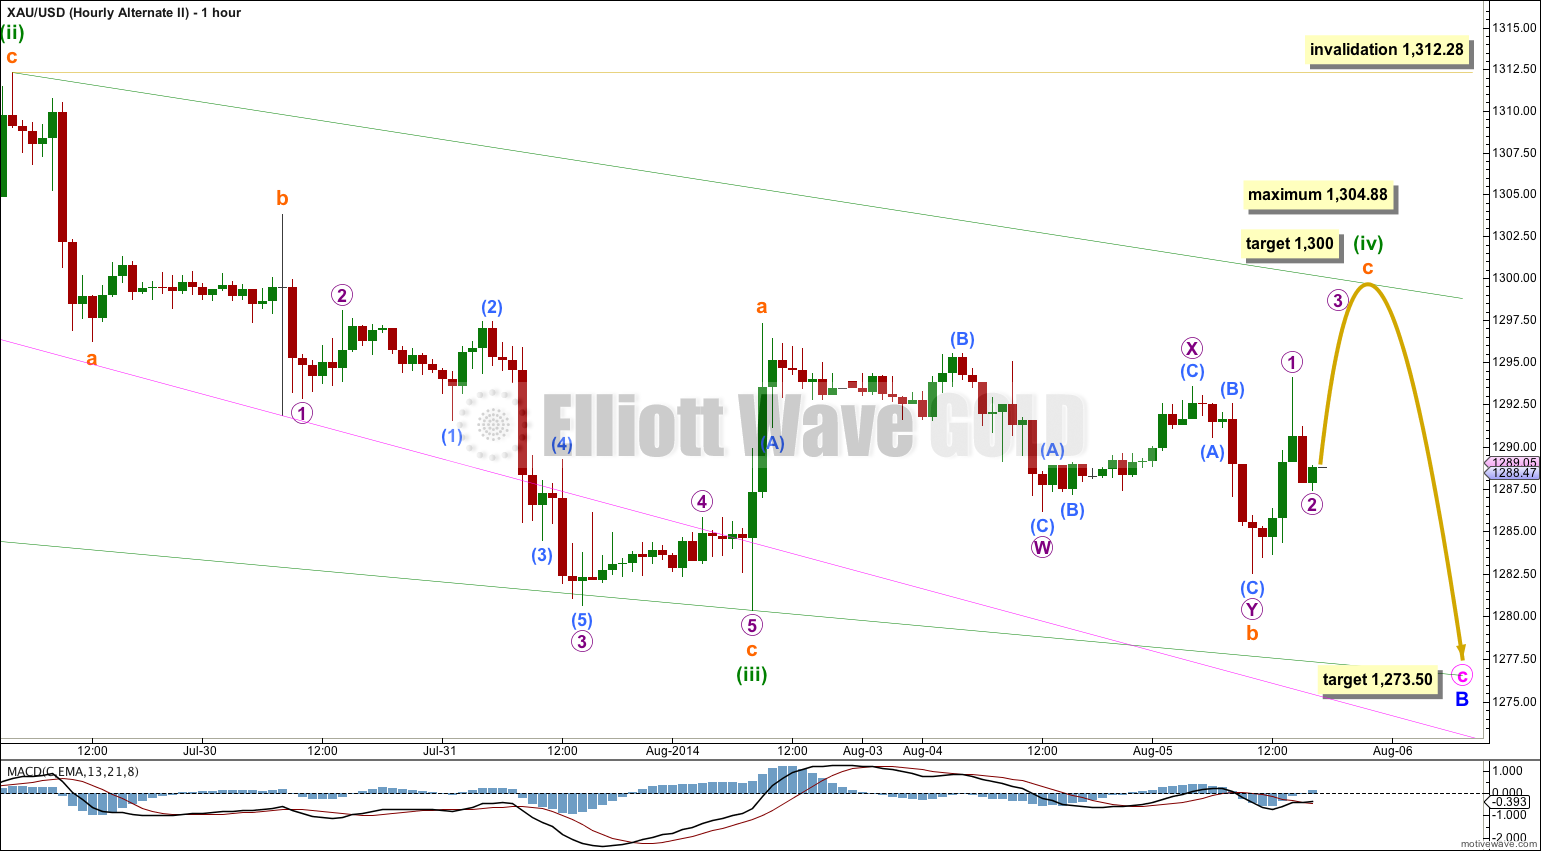
Minuette wave (v) should end at the lower (i)-(iii) trend line of the diagonal.
The pink trend line sloping downwards on this chart is the upper edge of the corrective channel about minor wave B copied over from the daily chart. Here on the hourly chart it is clear how much of minute wave c does not fit into this channel. This looks very atypical for Gold.
At 1,304.88 minuette wave (iv) would reach equality in length with minuette wave (ii). Because the diagonal is contracting this fourth wave zigzag should not be longer than equality with the second wave. Movement above 1,304.88 would see this wave count discarded as at that stage the diagonal would be too atypical.
At 1,300 subminuette wave c would reach equality in length with subminuette wave a. This would complete minuette wave (iv) zigzag.
Minuette wave (iv) may not move beyond the end of minuette wave (ii) above 1,312.28. However, this wave count would be discarded well before the invalidation point is passed.
The final fifth wave downwards would most likely end when price comes to touch the lower (i)-(iii) trend line of the diagonal. It would likely move at least slightly below the end of minuette wave (iii) at 1,280.25 to avoid a truncation. The target is where minute waves a and c would reach equality in length at 1,273.50.
This analysis is published about 05:41 p.m. EST.


We are having a sharp upward move this morning exactly as predicted by you, almost reaching the iii wave target of $1310. However, is there also another possibility that we are completing a double zig zag, wave 2 correction – i.e. this is the second zig zag upward following a lengthy X wave that lasted from 7/17 to 7/30? To me, this possibility is looking quite good in terms of proportion, etc.
If this is a second wave correction then it is following a first wave. That first wave, because of all the overlapping, would be a leading contracting diagonal.
That is most certainly possible, but it has a very low probability. For a few reasons.
Leading diagonals as first waves are not rare, but they’re not exactly common either.
When triangles end the first wave to begin the new movement is most often swift and violent. This is so common, I expect it. Look at the movements out of triangles on the daily chart to see what I mean. This triangle for primary wave 4 is huge, when it finally ends I am expecting the beginning of primary wave 5 to be very large and swift, price should “fall off a cliff”.
Leading diagonals are not swift movements, they have some corrective tendencies exhibited in their confusion and overlaps.
So, in conclusion, it’s just a judgement based on my experience with EW and particularly Gold.
I’m struggling to see your X wave and second wave. A chart of your idea really would be most helpful.
I was trying to reconcile with the bearish silver count. Perhaps this reading is not correct.. Thanks anyway.
Gold and Silver are not moving in tandem at the moment. They just do not always move perfectly together.