
Downwards movement was again expected as overall for Silver. The week ended strongly lower with a red candlestick with a long upper wick.
Summary: A large multi-week pullback looks likely to continue. Look for support at the lower edge of the Elliott channel on the daily charts. The target is at 16.86.
Monthly charts were last updated here.
ELLIOTT WAVE COUNTS
BEARISH WAVE COUNT
WEEKLY CHART
Click chart to enlarge.
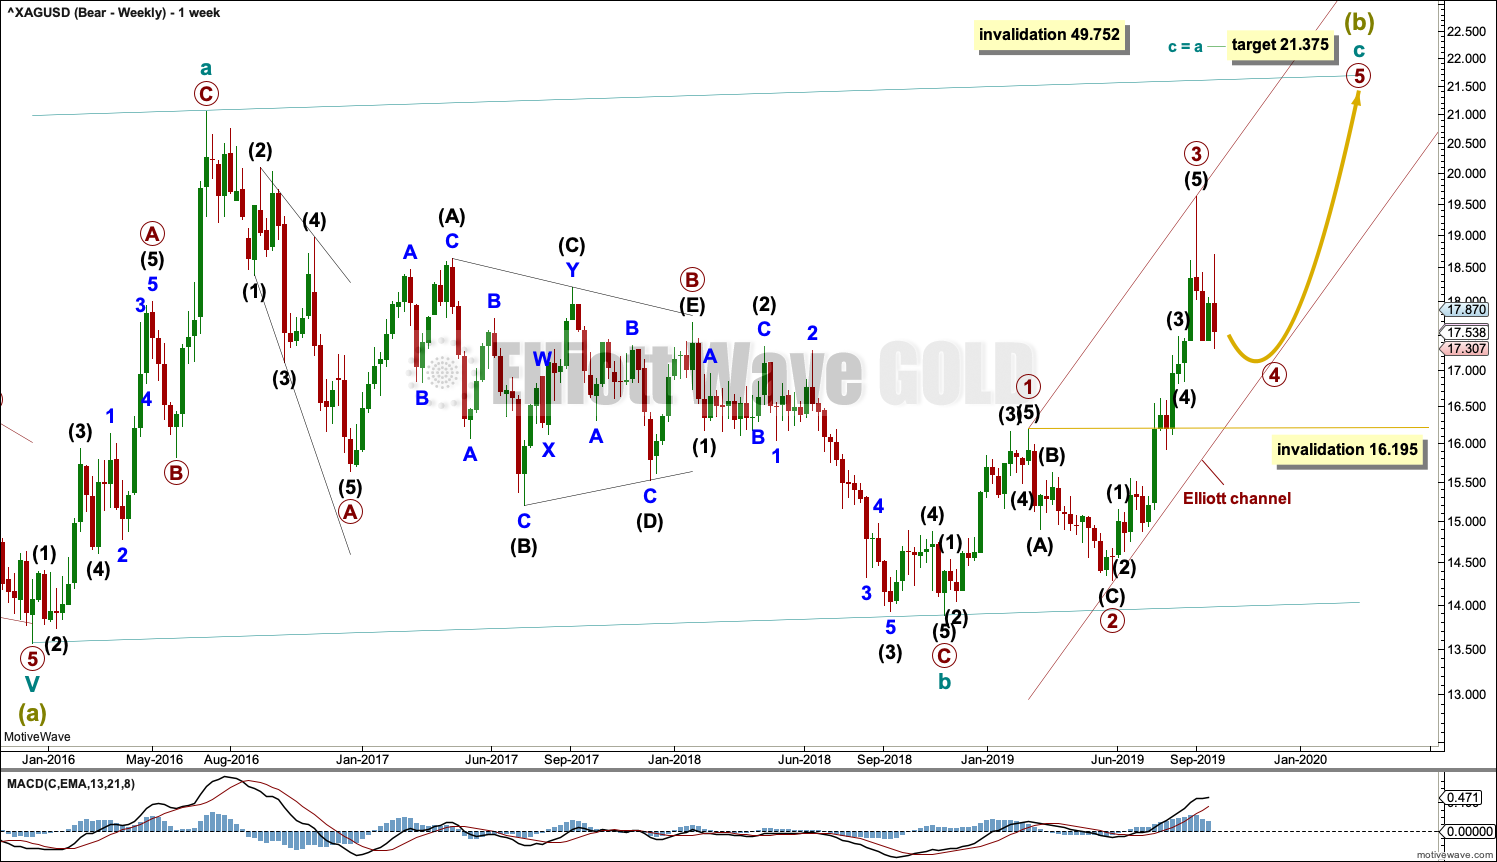
It is possible that Super Cycle wave (b) is an incomplete regular flat correction.
Within the regular flat correction, cycle wave a subdivides well as a zigzag and cycle wave b subdivides well as a zigzag, which is a 0.96 correction of cycle wave a.
Cycle wave c must complete as a five wave structure. Within cycle wave c, primary waves 1 through to 3 may be complete. Primary wave 4 may not move into primary wave 1 price territory below 16.195.
Regular flat corrections often fit within parallel channels. Cycle wave c may end about resistance at the upper edge of the channel. The most common Fibonacci Ratio for cycle wave c within a regular flat would be equality in length with cycle wave a.
It would be extremely likely, for this wave count, for cycle wave c to move at least slightly above the end of cycle wave a at 21.062 to avoid a truncation.
DAILY CHART
Click chart to enlarge.
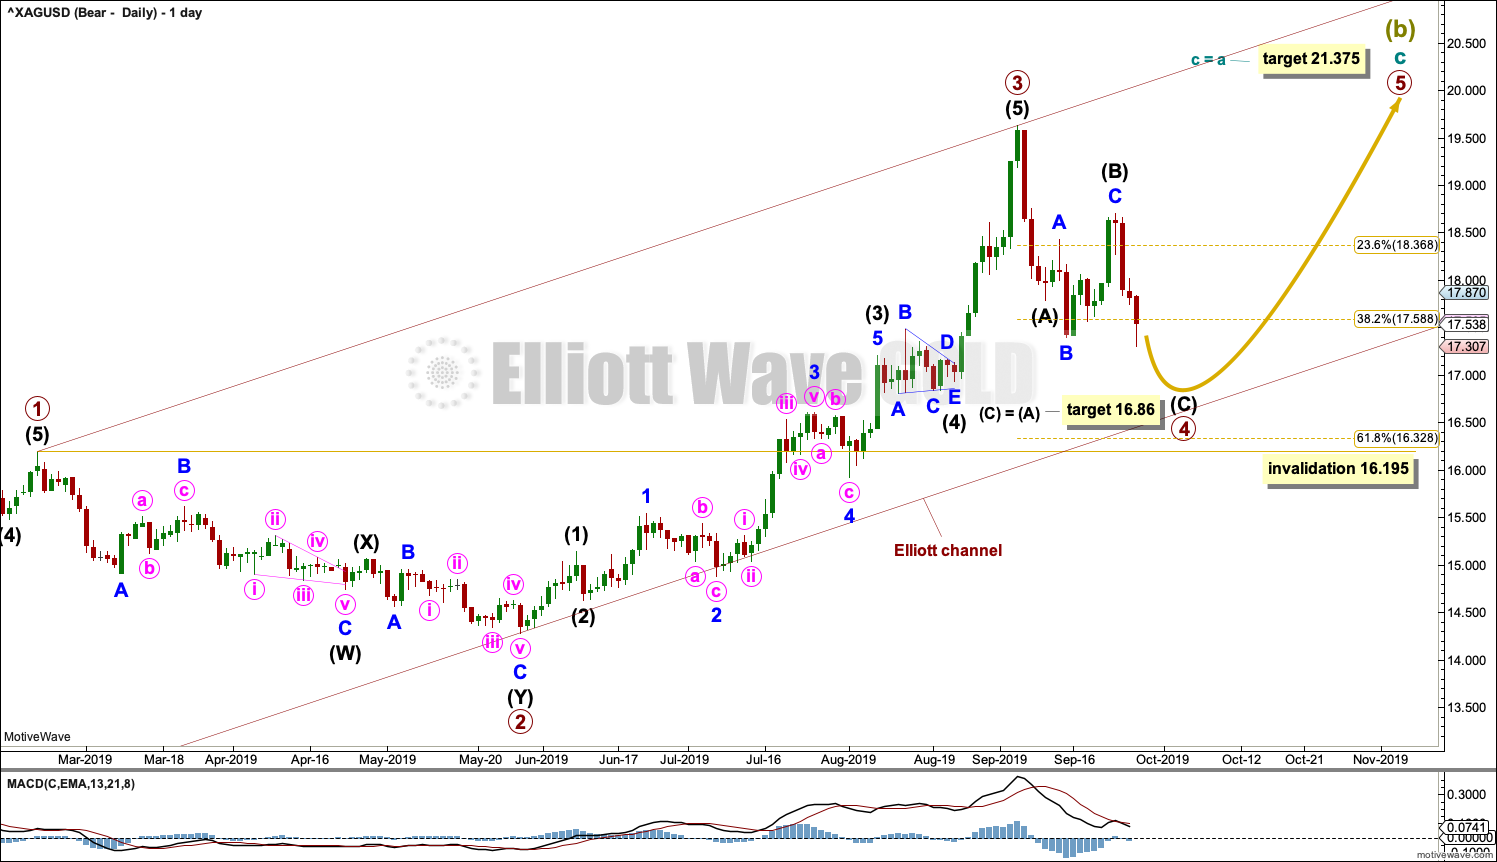
Cycle wave C may be subdividing as an impulse. Within the impulse, primary waves 1 to 3 may be complete.
Primary wave 4 may not move into primary wave 1 price territory below 16.195.
Primary wave 2 lasted 69 sessions and subdivided as a deep 0.82 double zigzag. Given the guideline of alternation, primary wave 4 may be expected to be shallow and most likely a sideways type of correction such as a flat, combination or triangle.
Primary wave 4 may be more brief than primary wave 2; fourth waves for Silver tend to be more brief than counterpart second waves.
Intermediate wave (B) may be a complete expanded flat correction.
A target is calculated for intermediate wave (C) to exhibit the most common Fibonacci ratio to intermediate wave (A).
BULLISH WAVE COUNT
WEEKLY CHART
Click chart to enlarge.
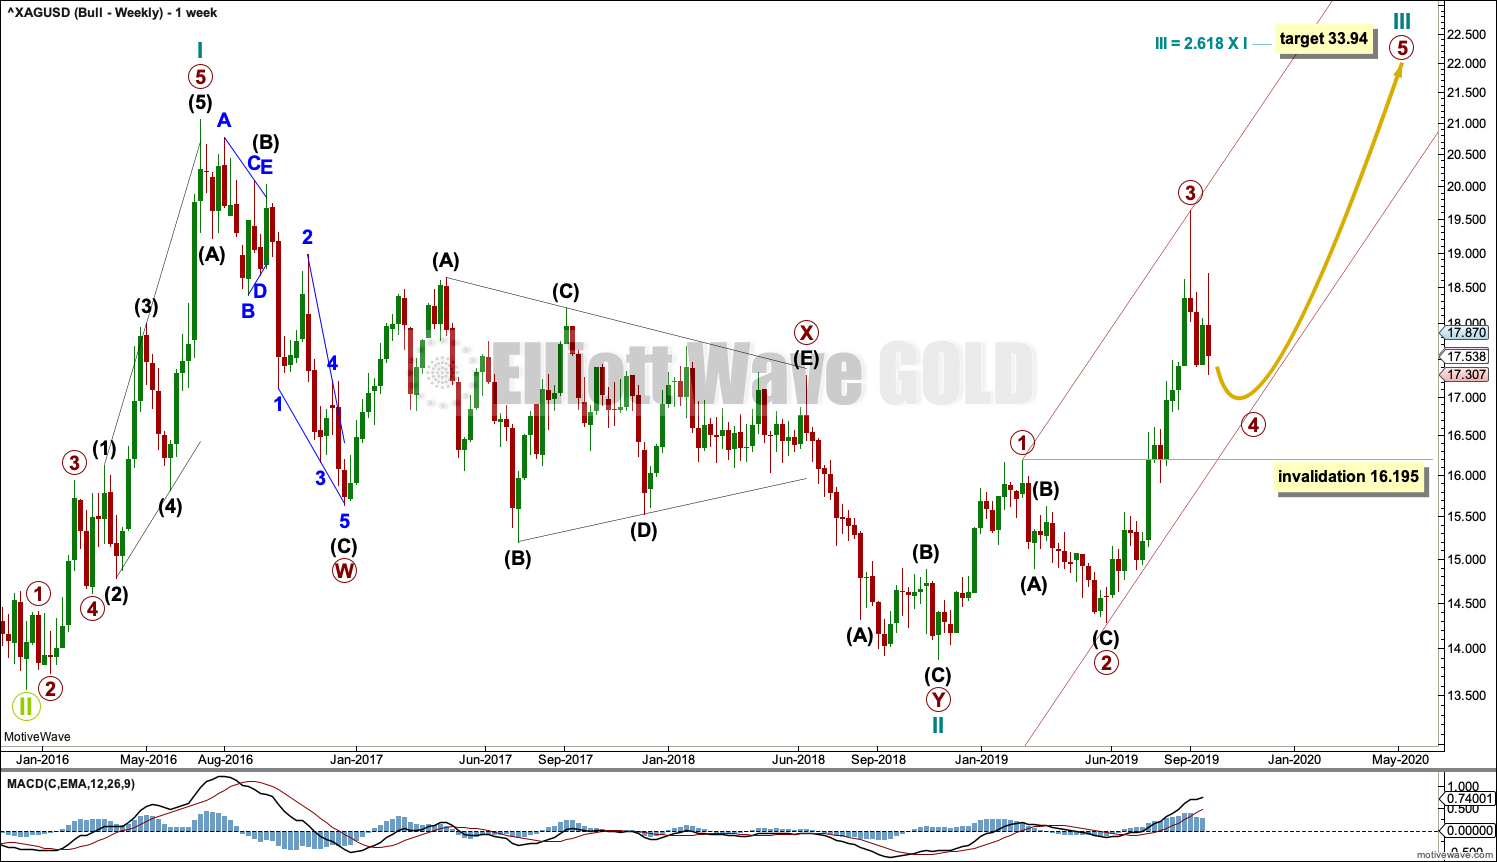
This bullish Elliott wave count sees a new bull market beginning for Silver at the low in December 2015.
A new bull market should begin with a five wave structure upwards. This is labelled cycle wave I.
Following five steps forward should be three steps back. This is labelled cycle wave II. The Elliott wave corrective structure of cycle wave II is labelled as a double zigzag, which is a fairly common structure.
Cycle wave III may only subdivide as an impulse. Within the impulse, primary waves 1 through to 3 may now be complete.
Cycle wave III must move beyond the end of cycle wave I above 21.062. Cycle wave III must move far enough above this point to allow room for cycle wave IV to unfold and remain above cycle wave I price territory.
DAILY CHART
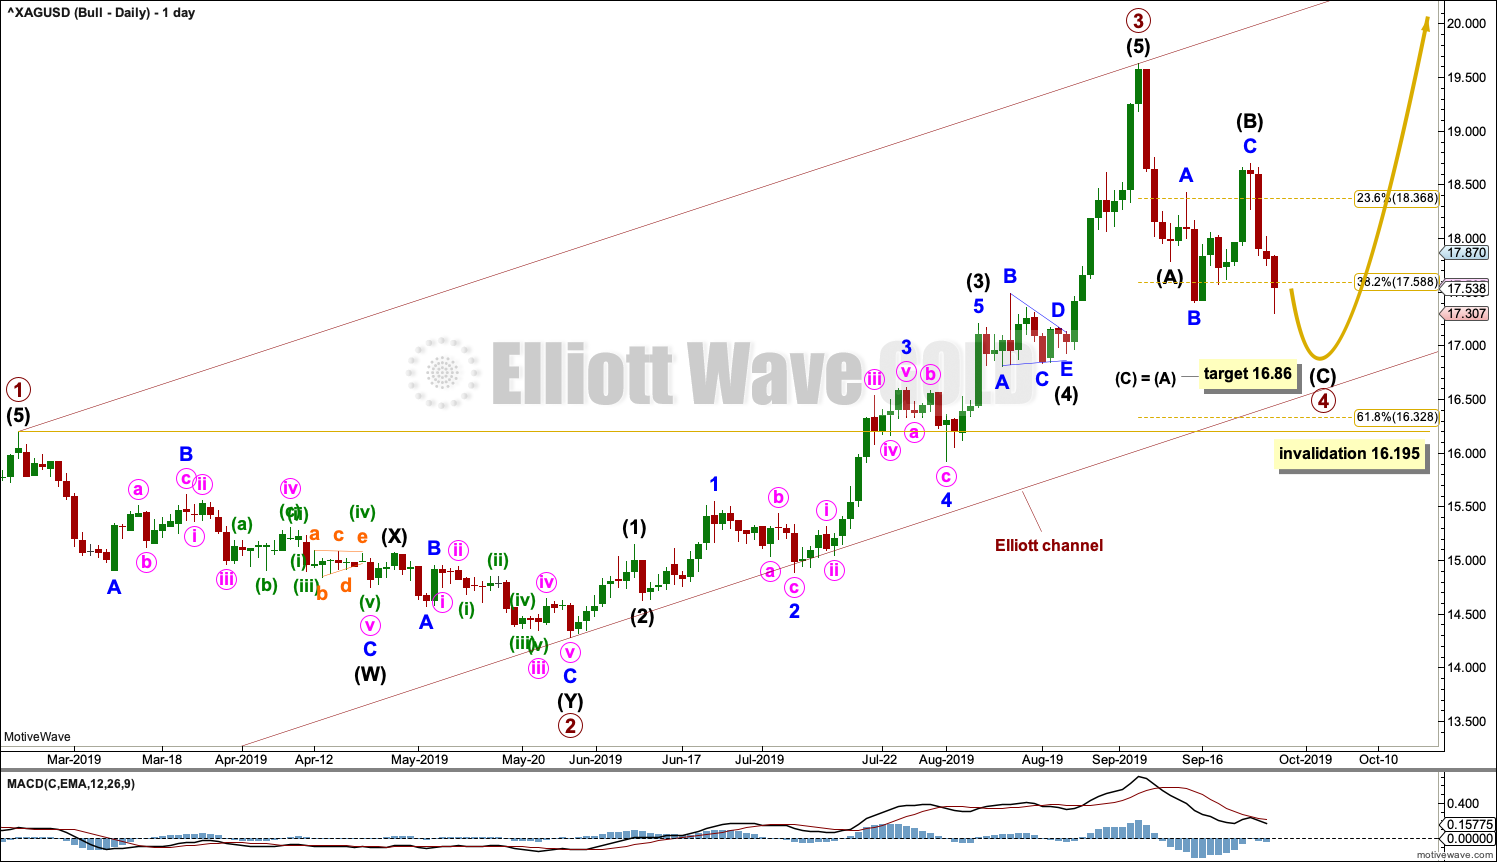
Click chart to enlarge.
Both Elliott wave counts now expect a primary degree fourth wave to unfold. At this stage, both bull and bear wave counts are the same for the short to mid term.
TECHNICAL ANALYSIS
WEEKLY CHART
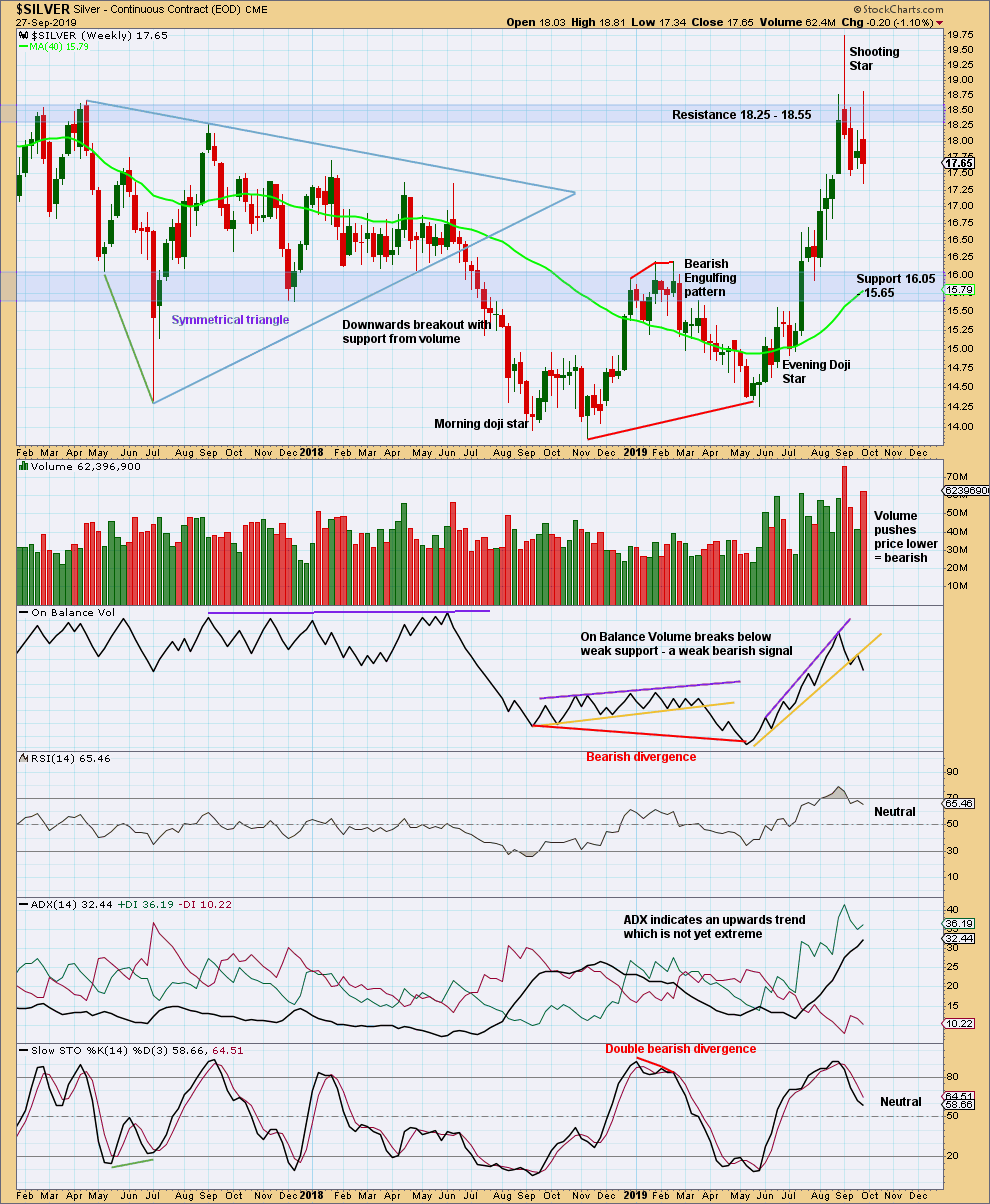
Click chart to enlarge. Chart courtesy of StockCharts.com.
For the short term, it looks like price may continue lower here: a longer upper candlestick wick, a bearish signal from On Balance Volume, and some push from volume.
DAILY CHART
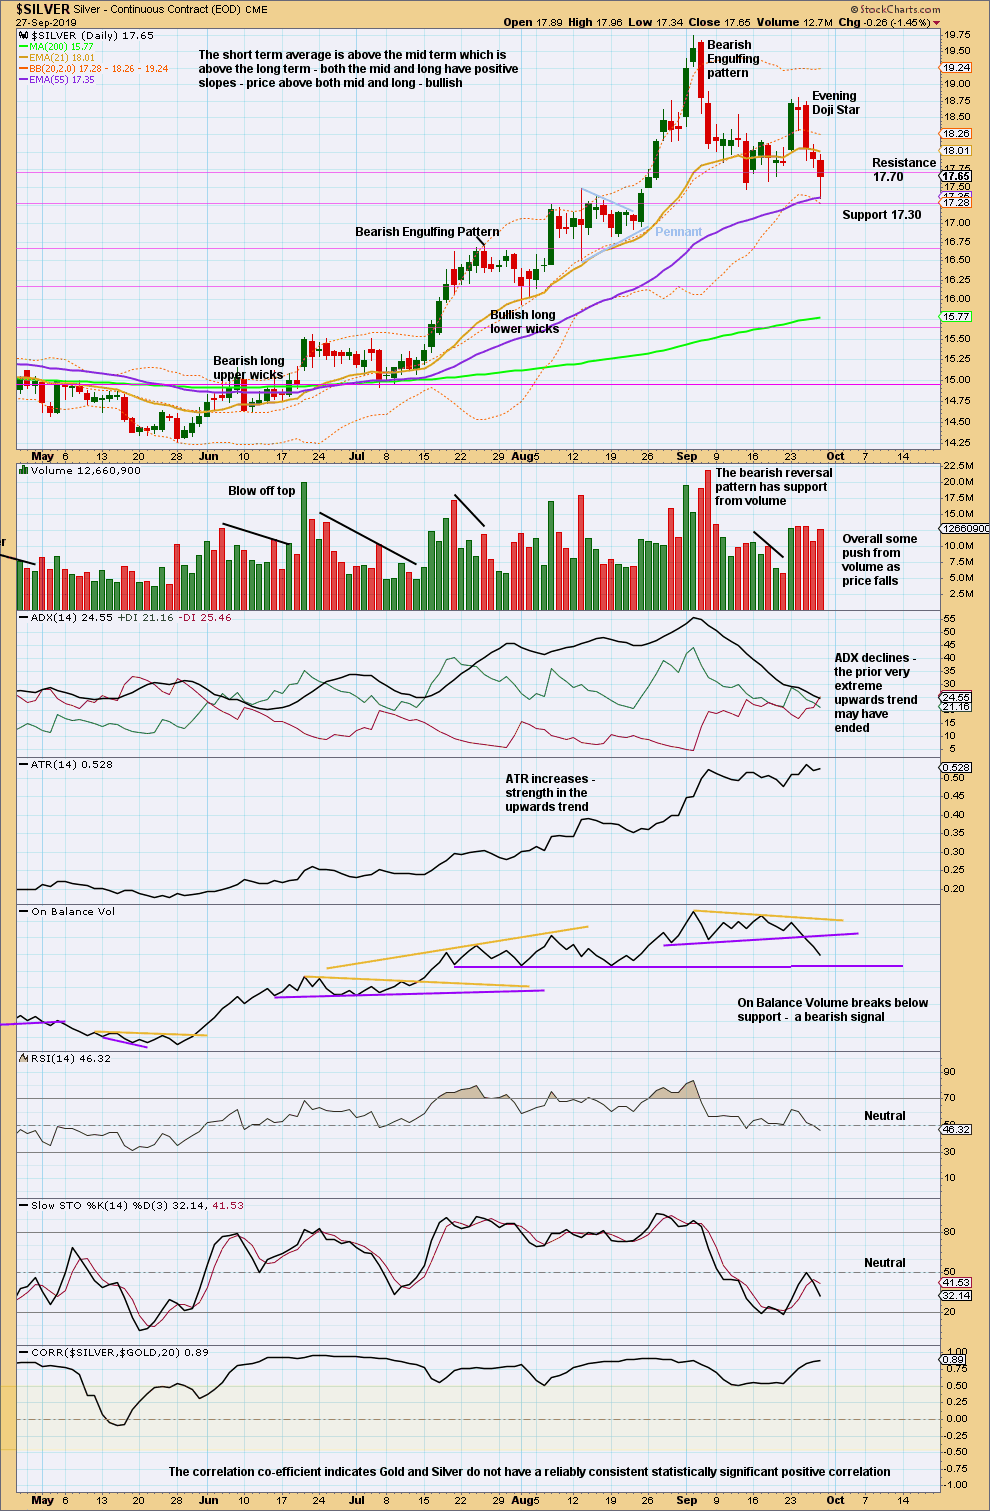
Click chart to enlarge. Chart courtesy of StockCharts.com.
The prior very extreme upwards trend has ended. Look for more downwards movement until price reaches support and Stochastics reaches oversold at the same time. Support lines are identified on the chart.
Published @ 09:47 p.m. EST.
—
Careful risk management protects your trading account(s).
Follow my two Golden Rules:
1. Always trade with stops.
2. Risk only 1-5% of equity on any one trade.
—
New updates to this analysis are in bold.
Silver made a nice move up today. I came pretty close to the downside target for both bull and bear scenarios. I wonder how much more downside is left, or if it’s fulfilled the requirements for support with oversold Stochastics.
I think its done and should now move overall higher.
It’s now that Silver and Gold are expected to diverge. Either that, or one of my EW counts is wrong.
Looking back at their major highs and lows historically, they don’t always turn together. So it’s entirely conceivable that they may not this time. Gold could begin its move down with deep corrections, while Silver could end its move up with deep corrections. Choppy movement in both, one slowly trending up and the other slowly trending down.
I’ll keep looking for alternate wave counts though, now is a really important time for me to do that. Maybe I’ll make a video of that process today, members seem to find it illuminating.
Thanks Lara. That gives me lots of clarity on how to approach it.