
SILVER: Elliott Wave and Technical Analysis | Charts – February 21, 2020
Both a bearish main wave count and a bullish wave count expected upwards movement for this week, which is exactly what has happened.
Summary: The target for upwards movement to end is still at 21.375.
With Gold and Silver analysis currently expecting the same direction next, the alternate wave count for Silver will not be published again this week.
ELLIOTT WAVE COUNTS
Last updated monthly charts may be found here.
BEARISH WAVE COUNT
WEEKLY CHART
Click chart to enlarge.
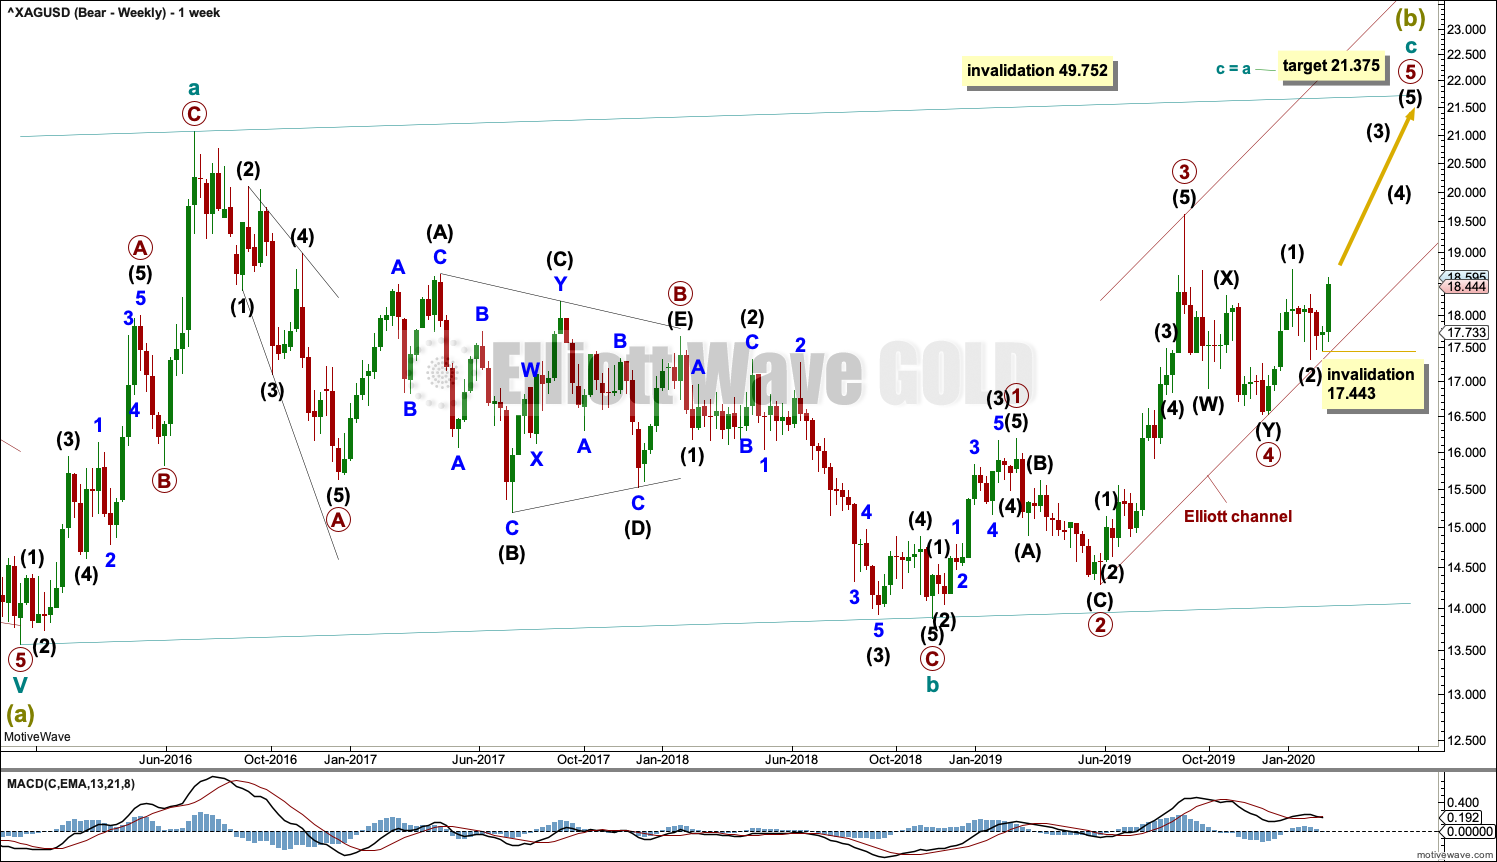
Super Cycle wave (b) may be an incomplete regular flat correction.
Within the regular flat correction, cycle wave a subdivides well as a zigzag and cycle wave b subdivides well as a zigzag, which is a 0.96 correction of cycle wave a.
Cycle wave c must complete as a five wave structure. Within cycle wave c, primary waves 1 through to 4 may be complete. Primary wave 5 may be underway. It must subdivide as a five wave motive structure. The invalidation point this week is taken from the daily chart.
Regular flat corrections often fit within parallel channels. Cycle wave c may end about resistance at the upper edge of the channel. The most common Fibonacci Ratio for cycle wave c within a regular flat would be equality in length with cycle wave a.
It would be extremely likely, for this wave count, for cycle wave c to move at least slightly above the end of cycle wave a at 21.062 to avoid a truncation.
Primary waves 1, 2, 3 and 4, within cycle wave c, all lasted 14 weeks, one longer than a Fibonacci 13. So far primary wave 5 has lasted 10 weeks. It may be longer lasting than primary waves 1, 2, 3 and 4.
DAILY CHART
Click chart to enlarge.
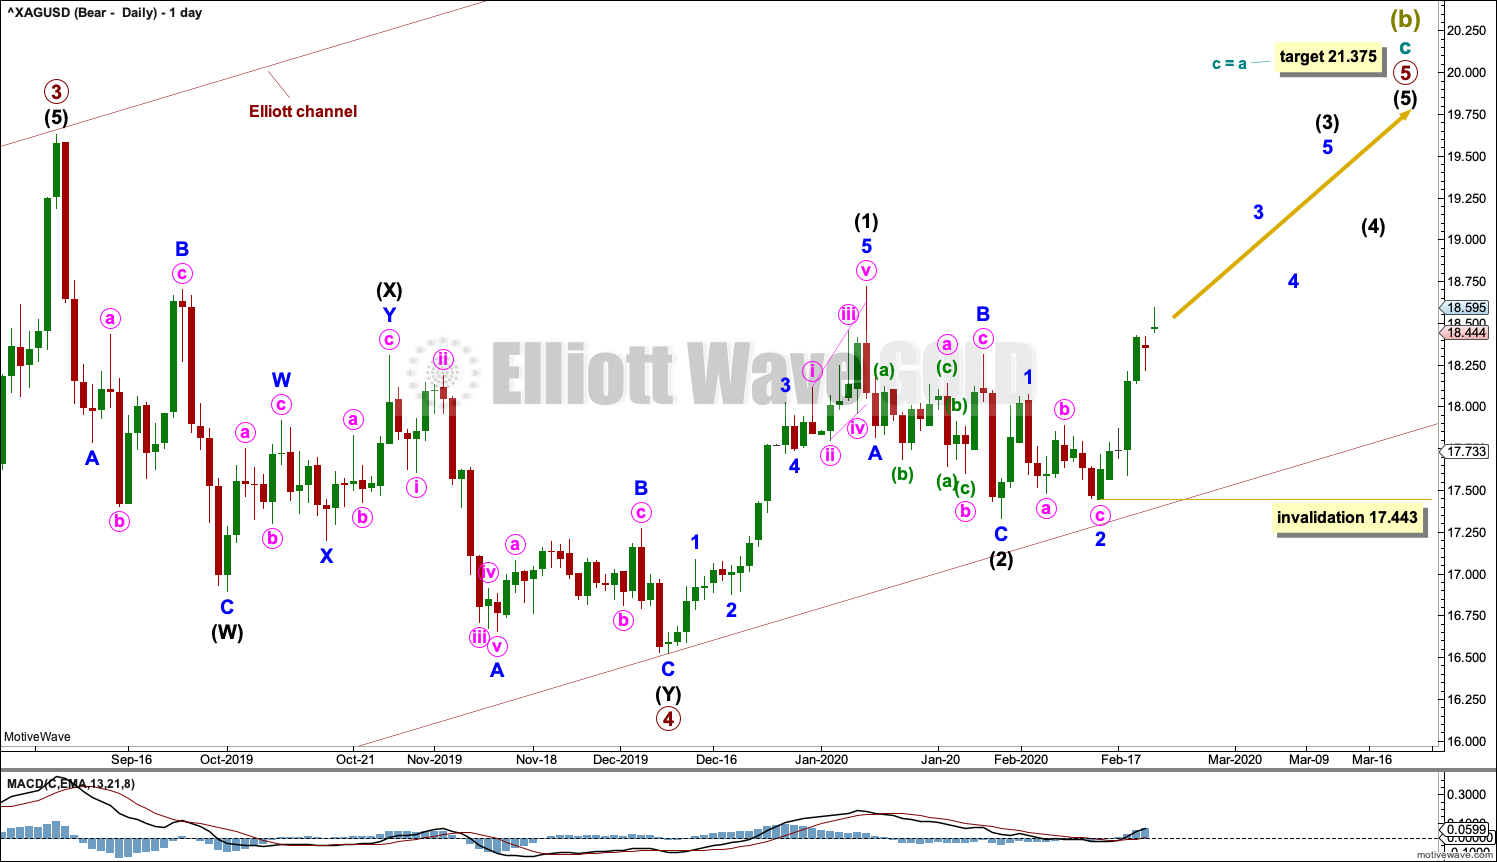
Cycle wave C may be subdividing as an impulse. Within the impulse, primary waves 1 to 4 may be complete.
Primary wave 5 must subdivide as a five wave structure. Within primary wave 5, so far intermediate waves (1) and (2) may both be complete. Within intermediate wave (3), minor waves 1 and 2 may be complete. Within minor wave 3, no second wave correction may move beyond the start of its first wave below 17.443.
This wave count now expects upwards momentum to increase as intermediate wave (3) continues. A target is not calculated for intermediate wave (3) to end as intermediate (3) is fairly likely to end with a blow off top forcing intermediate wave (4) to be relatively brief and shallow. Primary wave 5 may exhibit a typically curved look.
BULLISH WAVE COUNT
WEEKLY CHART
Click chart to enlarge.
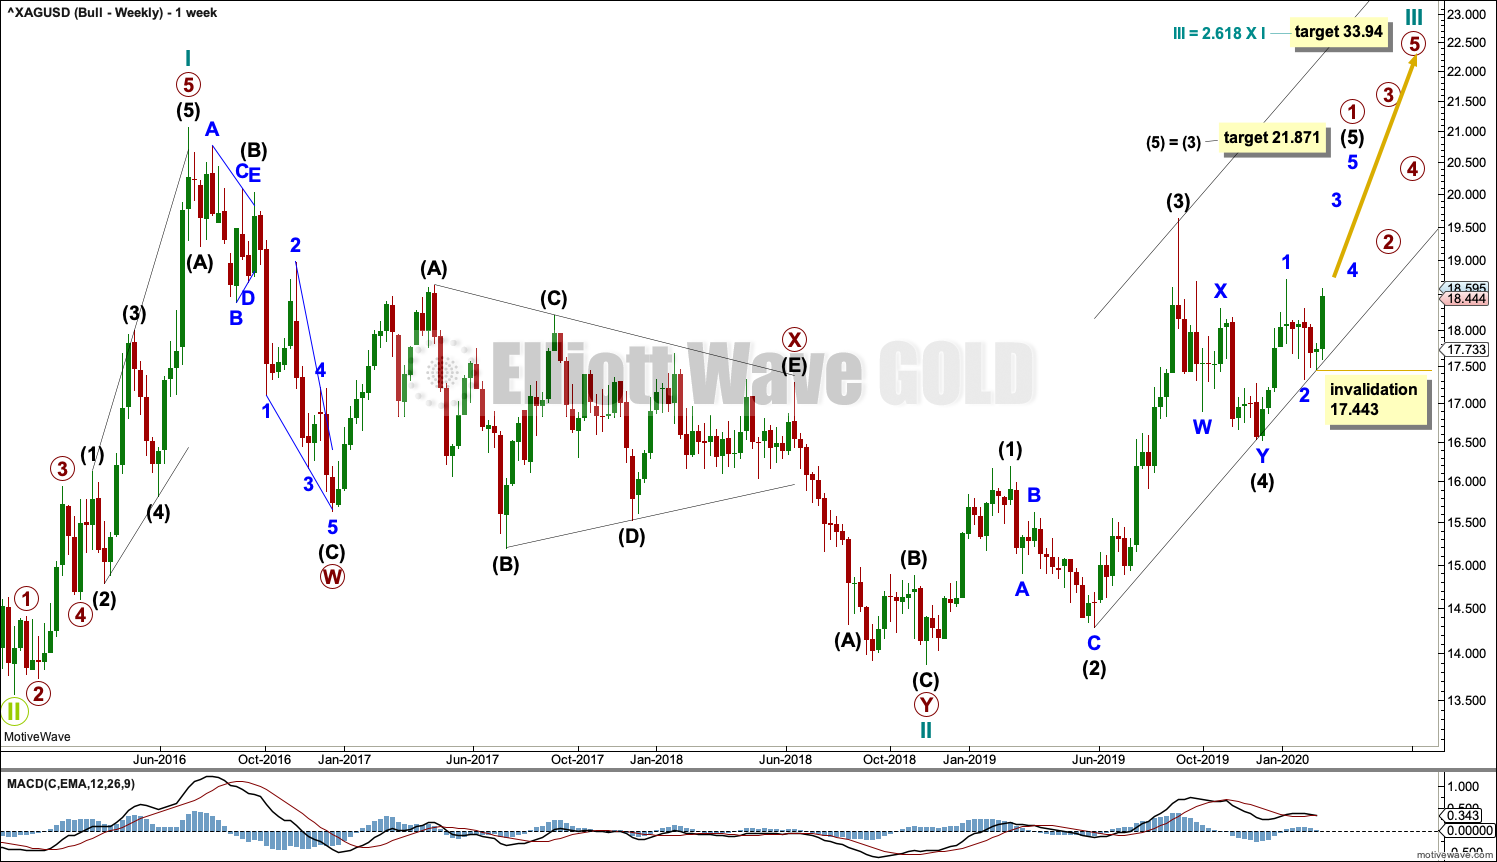
This bullish Elliott wave count sees a new bull market beginning for Silver at the low in December 2015.
A new bull market should begin with a five wave structure upwards. This is labelled cycle wave I.
Following five steps forward should be three steps back. This is labelled cycle wave II. The Elliott wave corrective structure of cycle wave II is labelled as a double zigzag, which is a fairly common structure.
Cycle wave III may only subdivide as an impulse. Within cycle wave III, only primary wave 1 may be unfolding. Within primary wave 1, intermediate waves (1) through to (4) may now be complete. The invalidation point this week is taken from the daily chart.
Intermediate wave (5) would be very likely to make at least a slight new high above the end of intermediate wave (3) at 19.628 to avoid a truncation.
Cycle wave III must move beyond the end of cycle wave I above 21.062. Cycle wave III must move far enough above this point to allow room for cycle wave IV to unfold and remain above cycle wave I price territory.
DAILY CHART
Click chart to enlarge.
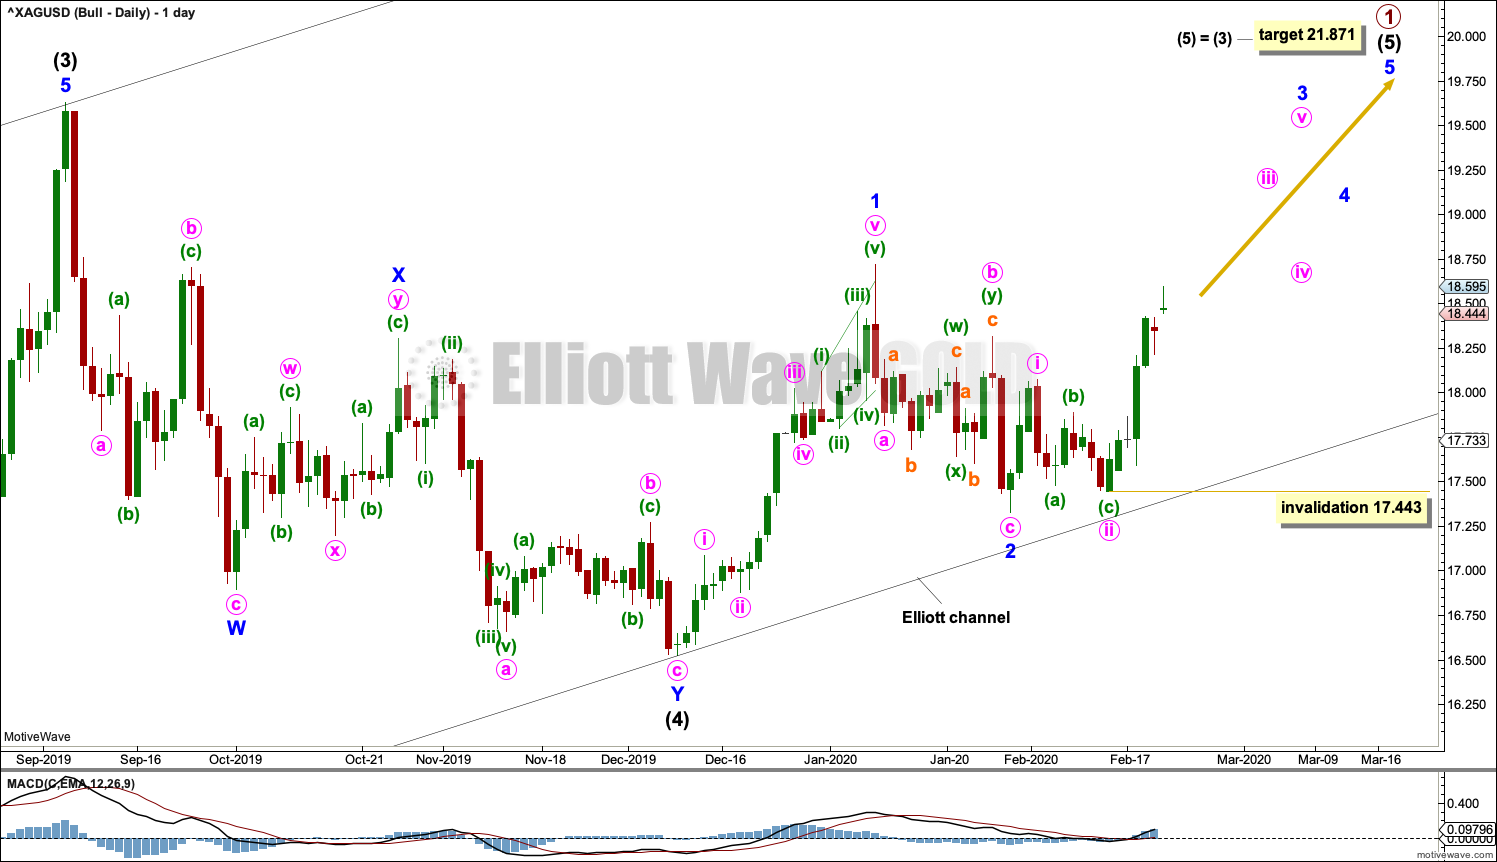
Both this bullish Elliott wave count and the bearish Elliott wave count now expect a fourth wave has completed. The targets for the next upwards movement are different.
TECHNICAL ANALYSIS
WEEKLY CHART
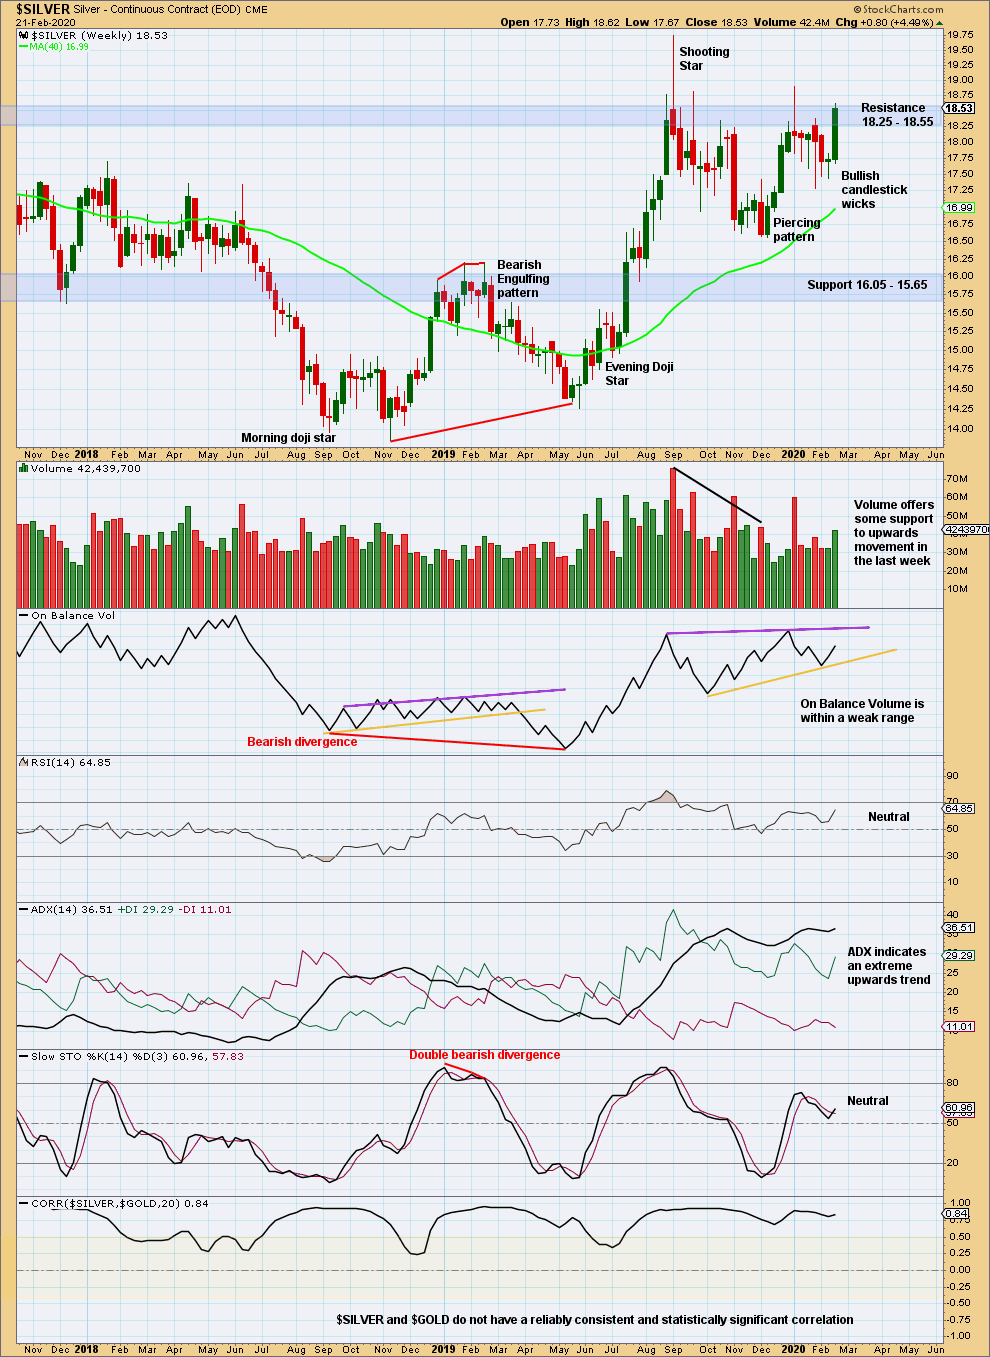
Click chart to enlarge. Chart courtesy of StockCharts.com.
A strong close at the end of the week with price close to highs and support from volume suggest more upwards movement may be fairly likely next week. A close above resistance at 18.55 on an upwards day with support from volume would constitute an upwards breakout from multi-month consolidation. This would be very bullish.
DAILY CHART
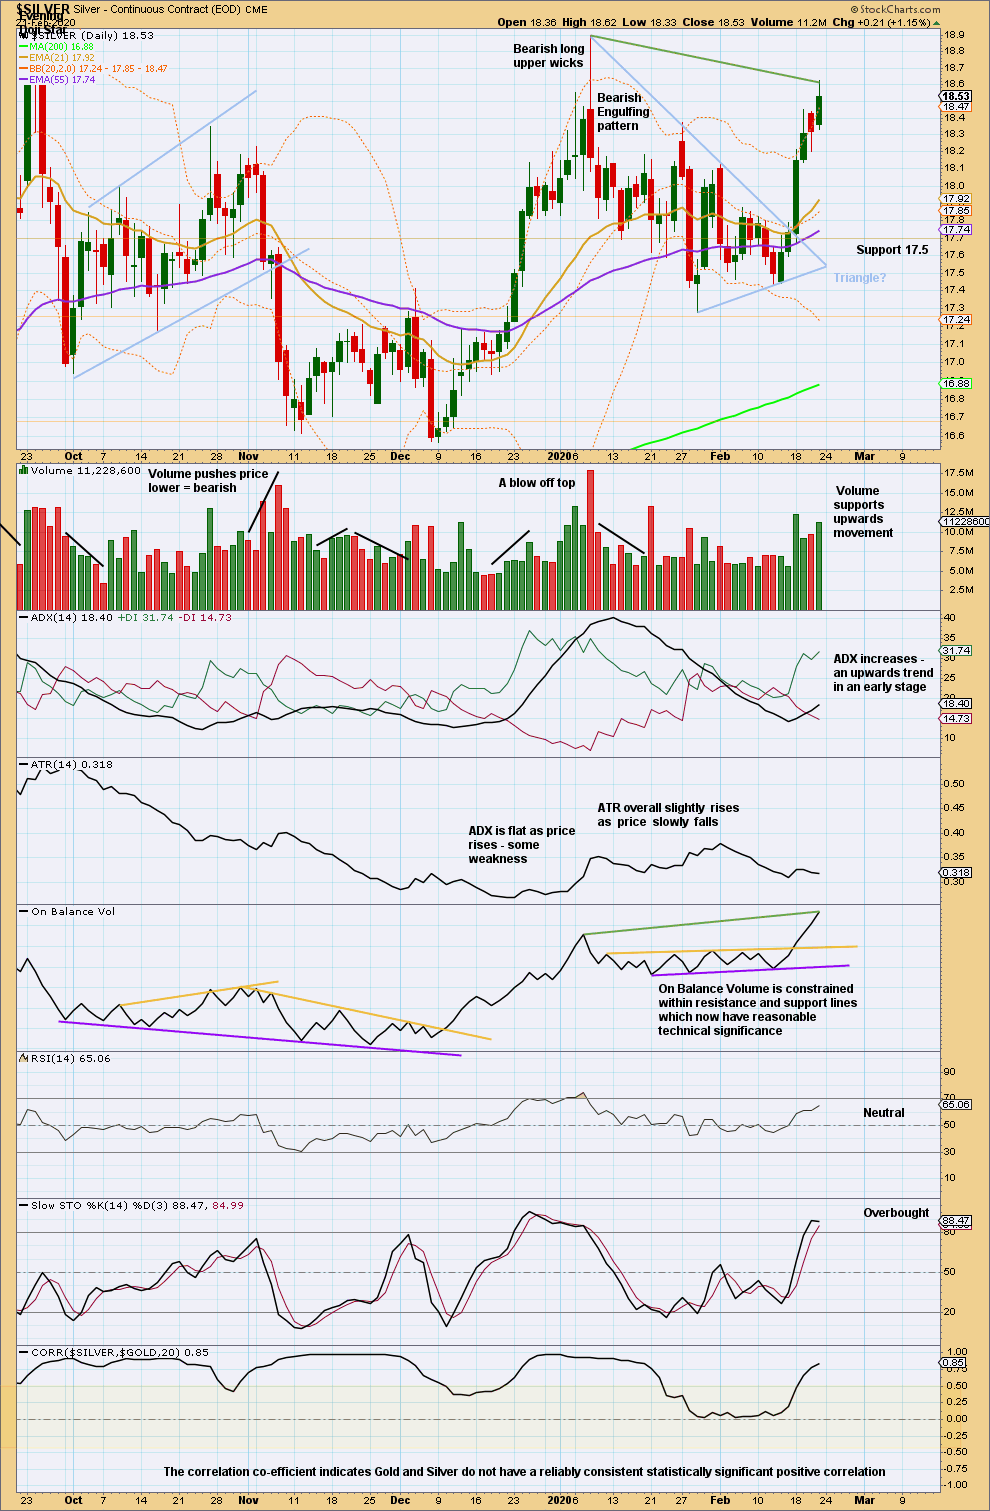
Click chart to enlarge. Chart courtesy of StockCharts.com.
A strong close at the end of the week with price close to highs and support from volume suggest more upwards movement may be fairly likely next week. A close above resistance at 18.55 on an upwards day with support from volume would constitute an upwards breakout from multi-month consolidation. This would be very bullish.
Published @ 10:55 p.m. EST.
—
Careful risk management protects your trading account(s).
Follow my two Golden Rules:
1. Always trade with stops.
2. Risk only 1-5% of equity on any one trade.
—
New updates to this analysis are in bold.
0 Comments