Intermediate wave (3) down should continue to 54.05.
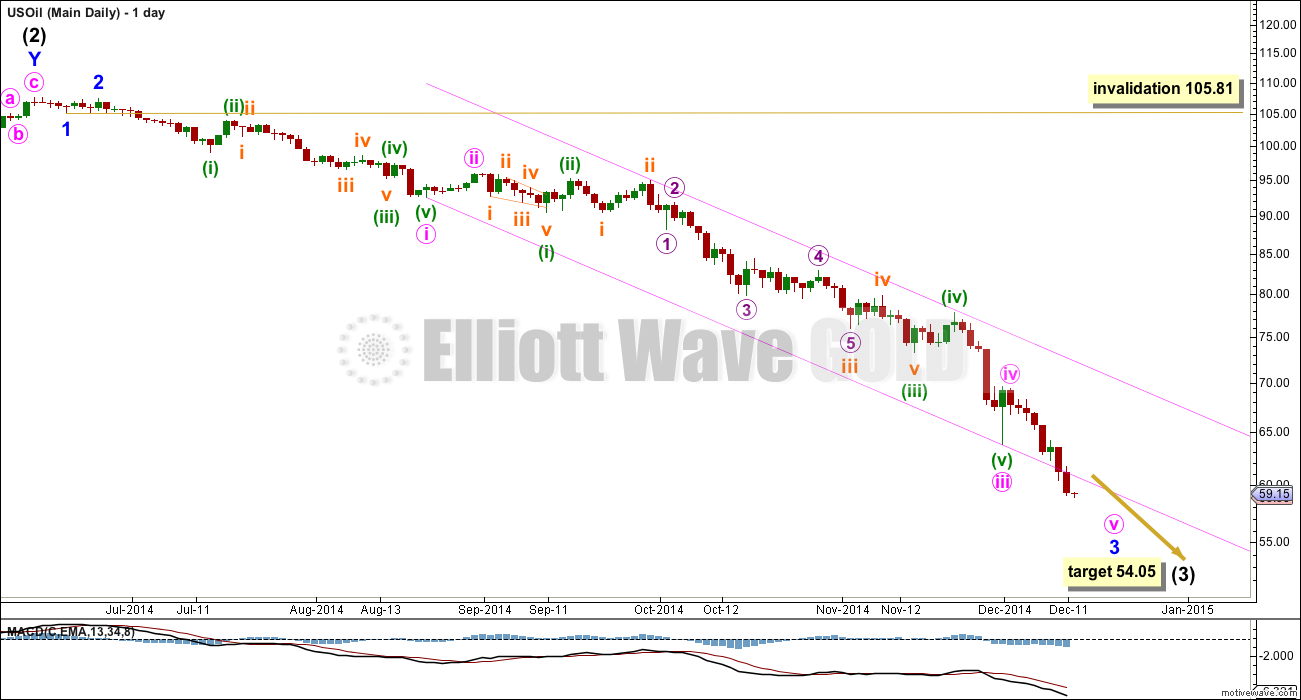
Summary: A third wave is underway. Corrections are brief and shallow. The new target is at 54.05. Only a clear breach of the pink channel on the daily chart would indicate that the downwards trend is being interrupted by an upwards correction.
Click on charts to enlarge.
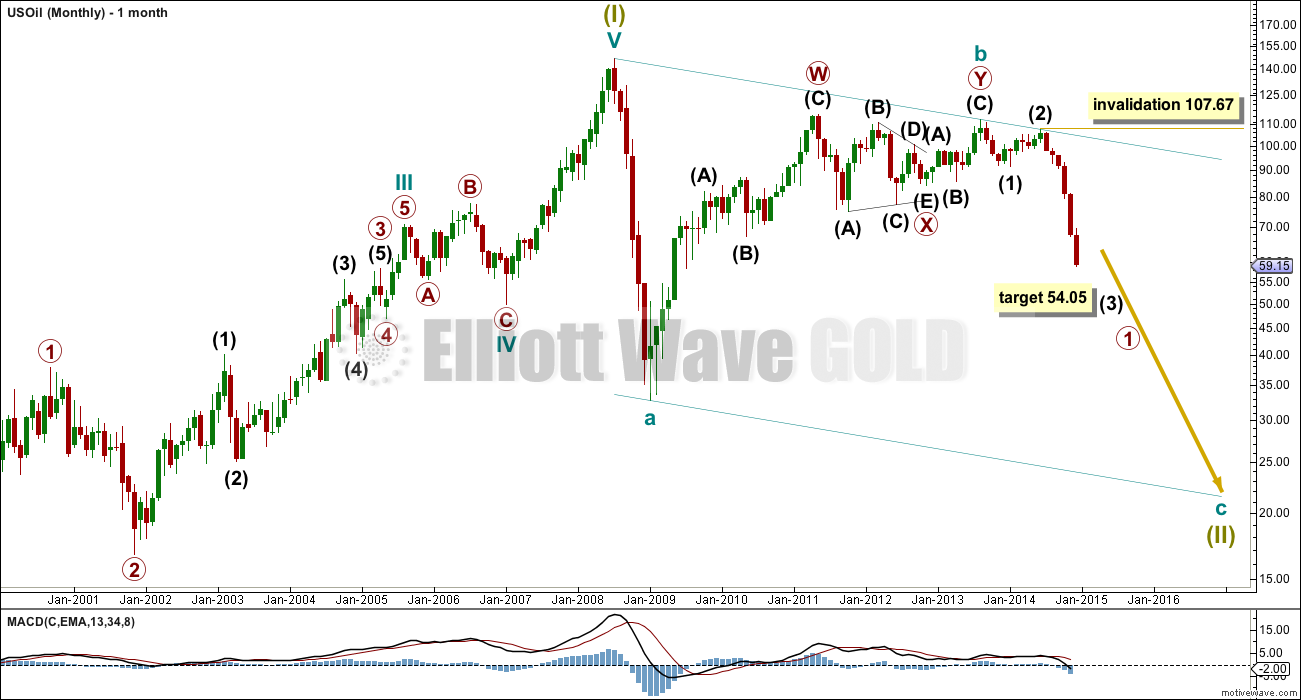
The bigger picture sees US Oil in a super cycle second wave correction unfolding as a huge zigzag. Within the zigzag cycle wave a subdivides best as a five, indicating a zigzag, and cycle wave b is a complete double zigzag.
Within intermediate wave (3) no second wave correction may move beyond the start of its first wave above 107.67.
Cycle wave c is most likely to end when price finds support at the lower edge of the large channel.
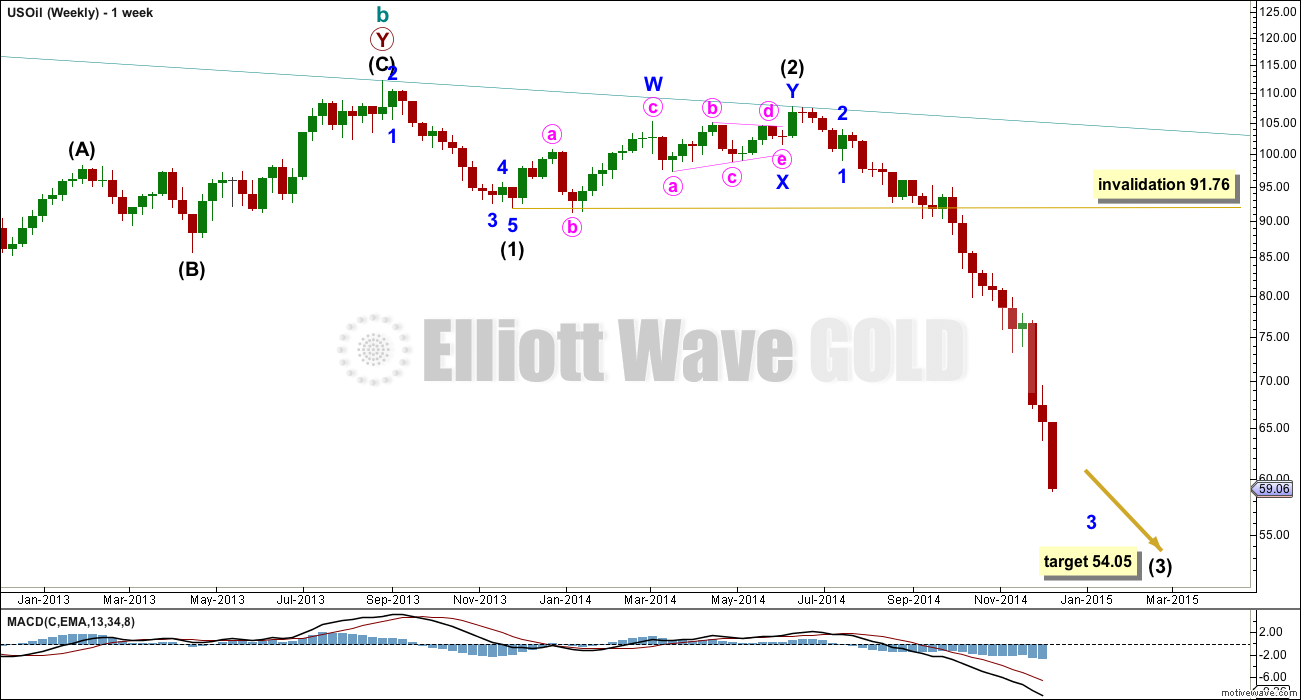
Within cycle wave c intermediate wave (3) would reach 2.618 the length of intermediate wave (1) at 54.05.
Intermediate wave (3) has now moved far enough beyond the end of intermediate wave (1) to move the invalidation point down. Intermediate wave (4) to come may not move back into intermediate wave (1) price territory above 91.76.
Minor wave 3 is not over, and minor wave 4 to follow it should be brief and shallow. Along the way down to the target for intermediate wave (3) to end I now expect a continuation of strong downwards movement with shallow and brief corrections interrupting it. The pink channel is a best fit channel: draw the first trend line from the lows labelled minute waves i to iii, then place a parallel copy on the high labelled subminuette wave ii. This channel is nicely showing where upwards movement is finding resistance. The channel is being breached to the downside by a strong fifth wave, typical of commodities.
Only when this channel is breached by upward movement would I expect that the downwards trend is over for the mid term. At that stage I would expect that intermediate wave (3) would be over and intermediate wave (4) would have begun.


hi Lara… all targets have already been met…. fantastic analysis i must say. Now do you think we are about to complete 3rd wave down? Looks like a final fall is pending, may be in the form of 5th of 5th of 3rd???
Ok now a turning point seems to be starting,… correction?
Any indication in waves?
Thank you Lara.
Kindly Ursula
For me the wave count looks complete now. In my last post I made mistake regarding the lenght of the first wave of this final 5. It was 4,58 long. So the wave that has just been formed is 1,6 the lenght of wave 1. Also, it is easy to count complete 5 waves, with 3 wave extended. Wave 2 was finished where wave 5 of 1 began. This is typical of extended 5.
Because wave 2 was triangle, wave 5 should be zig-zag.
We are now in potentially pivotal point. On the lower band of the price channel within current wave. What’s more it is third day of this movement. The last two waves lasted for 3 days. What is more still, it has dropped already by 7,25 points. The first wave was 7,29.
I see it this way: If the upper band of the channel is broken, we are most likely in the correction (wave 4) already. If the price drops once again, we are kicking the can (the barrel) down the road (wave 3) for two more days and 4,5 points.
This is idealised but so far it moves so.
Hi Lara just the target for oil 5th wave will do. All last targets have been met very well.
Expanding triangle that emerged is now finished and one should expect further downward movement. My goal is 49,90-49-60 as a bottom of the next small wave. It looks like this triangle was only the 2 wave of the final 5 of (3). So we can expect to slide to 30s as well. 2,618 x wave 1 lenght = 2,618*8,65 = 22,65. That moves the target as low as 34,87. No need to fight the trend.
I’m really struggling to see an expanding triangle in US Oil… a chart of your idea would be most helpful so that your comment makes sense.
I actually follow Cl.F. It moves more harmonically. Not only the triangle looks perfect but it holds 3-days time frame. Also, during break out price drew perfect 3-5-3 correction in 1-minute interval. First wave of the current 5th wave was 7,29 points…
The second picture depicts price action during break out from triangle in 1-minute interval.
Hi Lara,
any updates possible? Are we in a correction up or just sideways? Then down further all the way to $20 something?
Thanks
Ursula
Hi Ursula, I’ll be updating US Oil over my weekend, along with Silver and GDX.
It just keeps going down…. a fourth wave triangle finished a few days ago, so this downwards wave should be a final fifth.
My last target was 52.99… and its broken below that. Again. I need to see where the next possible place to end could be.
A new high above the end of the triangle at 57.14 would give price indication that the downwards movement is over.
as we move down the (5) in a seesaw movements, the queston arises where is the bottom and how to count the minor waves within (5). I think the most likely option is the first scenario pictured below. But the second scenario looks good for me as well. I like to think that (5) is diagonal triangle. It would suit well because of the huge wave (3). Nice thing about my scenarios is that they see minor wave 4 in the same place. So we are approaching the final final wave 5. So 5 of (5) of 3. Wave 4 should be rather massive.
Lara Happy New Year. I do not have words to describe how happy I am to find your excellent service in EW. You are the master.
Can you update the Oil EW counts with new targets ASAP. I am in short oil already.
I was waiting for pink to breached but it did not happen instead put in a mid way triangle. This very bearish.
Thanks.
I had a target at 52.99 which is now also slightly breached.
My next target would be at 50.44, but it could be over now.
A bigger trend change should come sooner than later. The only way I’ll know its here if that channel is breached.
It is at the end of this movement, and that triangle was a small fourth wave so its in a final fifth wave down.
Any movement above the price extreme in the triangle at 59.03 would be a pretty strong indication that a bigger correction may have arrived, and it would be confirmed by a breach of the trend channel.
Minor 2 lasted 4 days. Minor 4 I see as a triangle lasting 6 days. I have no problem with that.
I am seeing the wave count for US Oil now in the very final fifth wave.
Lara what is the target for wave v?
I had 52.99 but thats been passed. It might be over here.
The next likely target would be 50.44.
The most important thing with this wave count and US Oil at the moment, is to assume the trend remains the same (down) until proven otherwise (breaching the channel).
But at this late stage to acknowledge that a bigger correction is imminent.
Does this small daily triangle (and hourly) indicate a 4th and continuation of trend likely?
(4) seems to be over. Very fast. It raises suspicions. In my opinion it was brief WXY correction (3-5-3). I am looking forward to see Lara’s marks.
sorry Lara, meant shouldn’t we expect a rather significant bounce for (4) black, not blue
thanks!
Lara, todays low was 54.51, based on the recent action, would you put us in wave iii of pink V of 3?
Shouldn’t we expect a rather significant for blue 4?
thanks!
Lara now that wave (3) is about to complete what is to be expected of wave (4) in terms of amount and duration.?
Will it have fib relation of wave (2)?
Wave (2) duration and amount were 6 months and $16 respectively.
WOW !!! EW counts worked very well in oil. Superb job. All targets have reached or exceeded.
Firstly: I will wait for that pink channel on the daily chart to be breached by at least one full daily candlestick above it before I am confident that intermediate (3) is over.
Intermediate (2) lasted 28 weeks so for the wave count to have the right look I would expect intermediate wave (4) to be of a similar duration.
Also, int (2) was very deep, so I’d expect int (4) to be shallow. Once its confirmed that int (3) is over I’ll focus the US Oil analysis on how int (4) may unfold.
I thought the same that duration may be same.
Yes I am focus on the pink channel line.
Thank you
Thanks Lara. This helps.
Thank you very much Lara, reat update