Sideways movement is completing a small red doji for Tuesday’s session. Downwards movement fell 8.83 short of the target.
Summary: It is most likely a third wave up has just begun. First confirmation will come with a clear breach of the orange channel on the hourly chart. Thereafter, price confirmation would come with a new high above 1,198.24. The target is at 1,278. Alternatively, a new low below 1,170.83 would indicate downwards movement may continue further to a target at 1,140, but not below 1,131.09.
Note: Tomorrow’s analysis must be prepared by me during my Christmas Day (my time zone is +13GMT). Because it’s Christmas I’ll prepare text and charts only. There will be no video tomorrow. I expect the markets will be very quiet during Christmas Eve anyway. Merry Christmas everyone!
Click on charts to enlarge
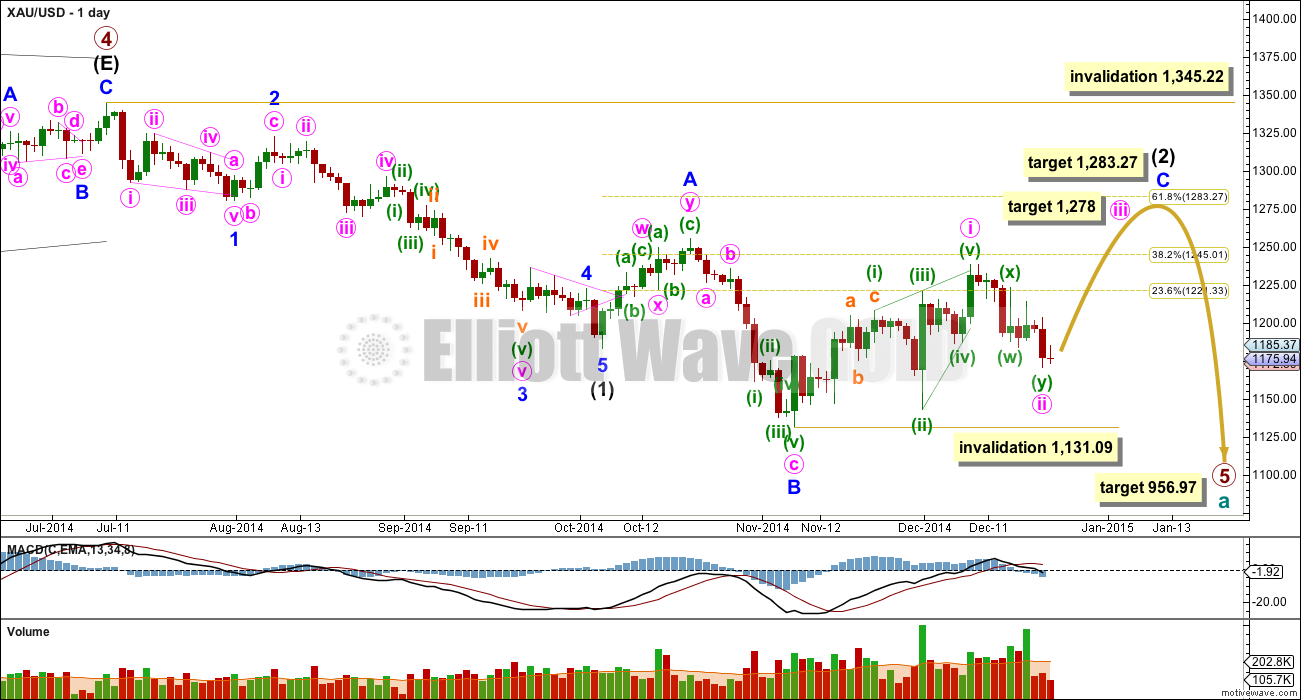
Primary wave 4 is complete and primary wave 5 is unfolding. Primary wave 5 may only subdivide as an impulse or an ending diagonal. So far it looks most likely to be an impulse.
Within primary wave 5 intermediate wave (1) fits perfectly as an impulse. There is perfect alternation within intermediate wave (1): minor wave 2 is a deep zigzag lasting a Fibonacci five days and minor wave 4 is a shallow triangle lasting a Fibonacci eight days, 1.618 the duration of minor wave 2. Minor wave 3 is 9.65 longer than 1.618 the length of minor wave 1, and minor wave 5 is just 0.51 short of 0.618 the length of minor wave 1. I am confident this movement is one complete impulse.
Intermediate wave (2) is an incomplete expanded flat correction. Within it minor wave A is a double zigzag. The downwards wave labelled minor wave B has a corrective count of seven and subdivides perfectly as a zigzag. Minor wave B is a 172% correction of minor wave A. This is longer than the maximum common length for a B wave within a flat correction at 138%, but within the allowable range of twice the length of minor wave A. Minor wave C may not exhibit a Fibonacci ratio to minor wave A, and I think the target for it to end would best be calculated at minute degree. At this stage I would expect intermediate wave (2) to end close to the 0.618 Fibonacci ratio of intermediate wave (1) at 1,283.27.
Intermediate wave (1) lasted a Fibonacci 13 weeks. If intermediate wave (2) exhibits a Fibonacci duration it may be 13 weeks to be even with intermediate wave (1). Intermediate wave (2) is now in its tenth week.
So far within minor wave C the highest volume is on three up days. This supports the idea that at this stage the trend remains up.
See the most recent Historic Analysis to see the long term channel about this whole downwards movement. The channel does not copy over to the daily chart when I put the daily chart on an arithmetic scale, so this channel must be drawn on a weekly chart on a semi log scale. The upper edge of that channel may be where intermediate wave (2) finally ends. I would not expect the upper edge of this channel to be breached.
The target for primary wave 5 at this stage remains the same. At 956.97 it would reach equality in length with primary wave 1. At this stage because primary wave 5 is taking its time it may not be a typical short brief fifth wave following a triangle, and so I have a little more confidence in this target.
Within minor wave C minute wave i subdivides perfectly as a leading contracting diagonal. When leading diagonals unfold in first wave positions they are normally followed by very deep second wave corrections. There is a nice example here on the daily chart: at the top left of the chart minor wave 1 was a leading contracting diagonal and it was followed by a deep 65% zigzag for minor wave 2. Minute wave ii is now deep, just below the 0.618 Fibonacci ratio of minute wave i. Minute wave iii has most likely now begun.
I do not think that minor wave C is complete at the high of 1,238 as an ending contracting diagonal for three reasons:
1. Intermediate wave (2) would be a very rare running flat correction.
2. Minor wave C would be substantially truncated, by $17.
3. This structure does not subdivide well as an ending diagonal because the third and fifth waves do not fit well as zigzags. Within an ending diagonal all the sub waves must be zigzags.
Minute wave ii may not move beyond the start of minute wave i below 1,138.19.
Intermediate wave (2) may not move beyond the start of intermediate wave (1) above 1,345.22. I have confidence this price point will not be passed because the structure of primary wave 5 is incomplete because downwards movement from the end of the triangle of primary wave 4 does not fit well as either a complete impulse nor an ending diagonal.
To see a prior example of an expanded flat correction for Gold on the daily chart, and an explanation of this structure, go here.
I do not want to publish a wave count which sees primary wave 5 complete at the low of 1,131.09. This downwards movement does not fit well at all as a complete five wave impulse. There would be inadequate alternation between the single zigzag of the second wave and the double zigzag of the fourth wave correction, and there would be no Fibonacci ratios between the first, third and fifth waves within it.
Main Hourly Wave Count
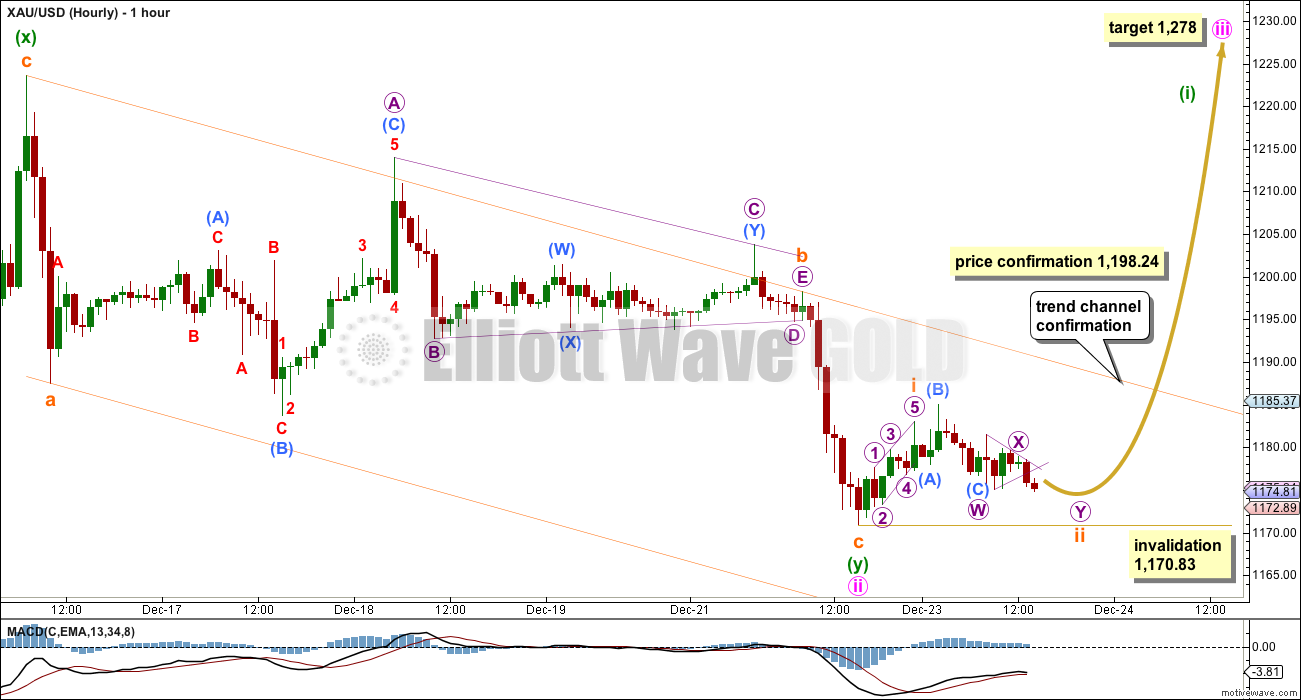
Minute wave ii may have ended very close to the 0.618 Fibonacci ratio of minute wave i, falling short of the target. There is no Fibonacci ratio between subminuette waves a and c within this second zigzag in the double for minute wave ii. Minute wave ii is now a complete structure.
Draw a channel using Elliott’s technique about this zigzag. When the upper orange trend line is clearly breached by at least one full hourly candlestick above it and not touching it, that would be first confirmation that minute wave ii is over and minute wave iii is underway. Price confirmation would come with a new high above 1,198.24.
Minute wave iii must subdivide as an impulse. It must move above the end of minute wave i at 1,238.38. At 1,278 minute wave iii would reach equality in length with minute wave i. This target fits nicely with the higher target for minor wave C to end at 1,283.
Minute wave iii should show a strong increase in upwards momentum beyond that seen within minute wave i.
No second wave correction may move beyond the start of minute wave iii below 1,170.83.
My only small cause for concern about this wave count today is the count of the first move up from the low, because it has a cursory count of seven which is corrective. It may be as labelled though, with a first wave impulse to be followed by a combination or double flat, and with the first structure within subminuette wave ii an expanded flat. On the five minute chart this wave count fits perfectly: importantly, sub micro wave (B) upwards subdivides very clearly as a three, and subminuette wave ii would probably extend sideways in very choppy overlapping movements, taking up time.
Alternate Hourly Wave Count
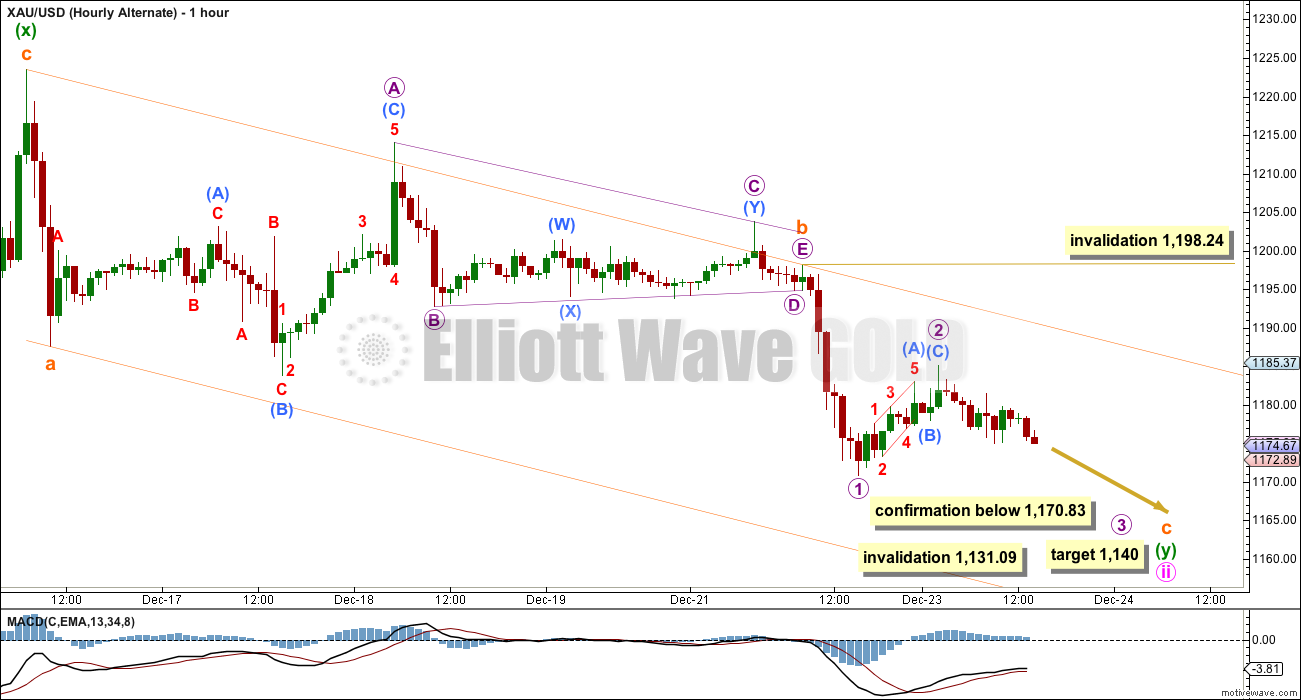
If this wave count is confirmed with a new low below 1,170.83 I would expect three more days overall of downwards movement. That would see minute wave ii last a total Fibonacci 13 sessions and have a 0.618 duration to minute wave i.
At 1,140 subminuette wave c would reach 1.618 the length of subminuette wave a.
Minute wave ii may not move beyond the start of minute wave i below 1,131.09.
This wave count does not have quite as good a fit on the five minute chart, but on the hourly chart the upwards wave labelled micro wave 2 does have a corrective count of seven. Sideways movement since then though is unconvincing as the start of a third wave, even one of a low degree like this.
Micro wave 2 may not move beyond the start of micro wave 1 above 1,198.24. If the orange channel is breached this wave count would decrease substantially in probability before it is invalidated.
This analysis is published about 3:21 p.m. EST.


Lara, does gold’s movement over the last 2 days (on an hourly chart) not look exactly like a triangle, with a, b, c and d likely complete? Moreover, since the movement into the triangle was down – assuming this is a confirmed triangle – shouldn’t gold make a short sharp drop down before any big up moves? Thanks, as always, for all of your great work. Merry Christmas!
you may be on to something….looks neither like a third wave up or down. However, you can’t have 2 triangles since wave (x). I can’t reconcile a decent count from (x) with this continued sideways movement. Like I said a few days ago, gold sure seems to move sideways a lot especially in the past 6 months. I’d prefer to see $1156-$1162 tested before third wave up begins and maybe this is what happens. I’m fairly confident the whole move from $1238 is corrective due to all the sideways movement since. Merry Christmas!
Holiday schedule:
http://Www.cmegroup.com/tools-information/holiday-calendar/files/2014-christmas-holiday-schedule.pdf
http://www.cmegroup.com/tools-information/holiday-calendar/files/2014-christmas-holiday-schedule.pdf
Does anyone have holiday schedule with times for gold?
Answered my own question:
http://www.cmegroup.com/tools-information/holiday-calendar/files/2014-christmas-holiday-schedule.pdf
Globex closes at 13:45 EST on Dec 24 and re-opens on Dec 25 at 18:00 EST.
Thanks Matt, I found it also… I Posted the link but it’s waiting to be approved by the mediator.
Cheers!
And Merry Christmas all!
Lara, the best to you and your family today, your Merry Christmas Day.
All the best in health, wealth and happiness in your New Year 2015.
I look forward to another year of your incredible Elliott Wave forecasts, the Best there is.
Hello Lara,
Lara, you wrote: “Intermediate wave (2) is now in its tenth week.”
Maybe I missed something but I counted 12 weeks since October 6.
Happy Holidays Lara! I think we can almost rule out the alternate count. It definitely does not look like a third wave down after your publication. Of course it could be a bearish nest of 1-2’s with very low probability. Again, we wait for confirmation of this pending third wave up.
M-E-R-R-Y C-H-R-I-S-T-M-A-S, Lara! 🙂
Lara, if gold continues down to or close to 1140 what does that do to top of wave C, do targets 1278 and 1283 hold ?
I think the market has answered your question Davey.
I was too busy eating chocolate and watching movies yesterday to look at markets.