by Lara | Aug 13, 2021 | Gold
GOLD: Elliott Wave and Technical Analysis | Charts – August 13, 2021 The target for the preferred Elliott wave count for more upwards movement was at 1,777 to 1,779. Price has reached 1,781.30 at the close of the week. Summary: Both Elliott wave counts remain...
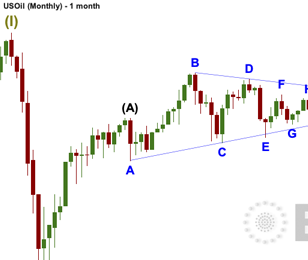
by Lara | Aug 13, 2021 | US Oil, US Oil Historical
US OIL: Elliott Wave and Technical Analysis | Charts – August 13, 2021 The main Elliott wave count expected upwards movement for this week. Price has moved lower and looks like it may close as a doji, with the low for the week falling just short of the...
by Lara | Jul 22, 2021 | Gold
GOLD: Elliott Wave and Technical Analysis | Charts – July 22, 2021 Another downwards day moves price slowly lower. Both Elliott wave counts remain the same. Summary: The main wave count now has a target for a downwards wave at 1,732 and an invalidation point at...
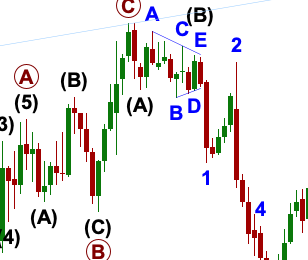
by Lara | Jun 30, 2021 | Gold
GOLD: Elliott Wave and Technical Analysis | Charts – June 30, 2021 Both Elliott wave counts yesterday had the same target and both today have the same trend channel. The expected direction for both the main Elliott wave count and the alternate Elliott wave count...
by Lara | Jun 25, 2021 | US Oil, US Oil Historical
US OIL: Elliott Wave and Technical Analysis | Charts – June 25, 2021 Last week’s analysis expected more upwards movement for Oil, which is what has happened. The Elliott wave count remains the same. Summary: The Elliott wave count expects upwards movement...
by Lara | Jun 8, 2021 | Gold
GOLD: Elliott Wave and Technical Analysis | Charts – June 8, 2021 Upwards movement continues as expected, but today’s candlestick has closed red. Both Elliott wave counts expect the same movement next. Summary: The main wave count is bullish. The next...
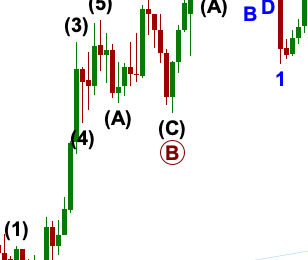
by Lara | May 17, 2021 | Gold
GOLD: Elliott Wave and Technical Analysis | Charts – May 17, 2021 Today price closes above resistance and makes an important new high above 1,849.22. This invalidates the first Elliott wave count, leaving the second Elliott wave count as now the main wave count....
by Lara | May 7, 2021 | US Oil, US Oil Historical
US OIL: Elliott Wave and Technical Analysis | Charts – May 7, 2021 A little more upwards movement this week remains below the invalidation point for the main Elliott wave count. If the main Elliott wave count is invalidated early next week, then the alternate...
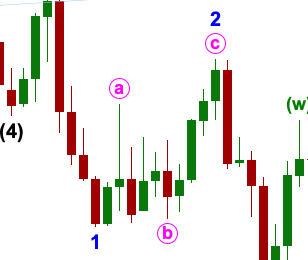
by Lara | Apr 27, 2021 | Gold
GOLD: Elliott Wave and Technical Analysis | Charts – April 27, 2021 Another very small range day moved price a little higher but closed red, leaving both short-term Elliott wave counts the same. Summary: The first wave count is bearish for the bigger picture and...
