by Lara | Sep 17, 2020 | Gold
GOLD: Elliott Wave and Technical Analysis | Charts – September 17, 2020 There has still been no breakout from the triangle. Two Elliott wave counts consider both possible breakout directions. Summary: On Balance Volume suggests an upwards breakout from the...
by Lara | Sep 15, 2020 | Gold
GOLD: Elliott Wave and Technical Analysis | Charts – September 15, 2020 A triangle continues sideways. Today On Balance Volume gives a signal on Gold that is clear and suggests the direction of the breakout from the triangle. Summary: On Balance Volume suggests...
by Lara | Sep 12, 2020 | Silver
SILVER: Elliott Wave and Technical Analysis | Charts – September 11, 2020 All week price has moved sideways to complete a doji candlestick. A triangle pattern is identified. Summary: Both Elliott wave counts expect a downwards breakout from the triangle pattern....
by Lara | Sep 11, 2020 | US Oil, US Oil Historical
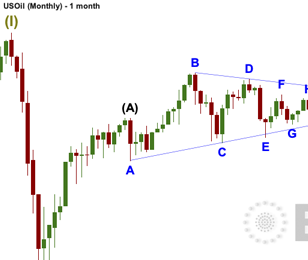
US OIL: Elliott Wave and Technical Analysis | Charts – September 11, 2020 Last analysis expected a pullback to continue, which is what has happened for the week. Summary: Oil may have found a major sustainable low. A multi-week pullback is expected to end about...
by Lara | Sep 9, 2020 | Gold
GOLD: Elliott Wave and Technical Analysis | Charts – September 9, 2020 The triangle continues to move sideways. Both Elliott wave counts remain the same. Summary: The pullback may be over. The upwards trend may resume. The next target is now at 2,180. However, a...
by Lara | Sep 5, 2020 | Silver
SILVER: Elliott Wave and Technical Analysis | Charts – September 4, 2020 For the very short term, on the daily charts a little upwards movement above 28.393 but not above 29.772 was expected. Thereafter, downwards movement was expected. This is what has happened...
by Lara | Sep 4, 2020 | Gold
GOLD: Elliott Wave and Technical Analysis | Charts – September 4, 2020 A triangle pattern may be complete at today’s low. Summary: The pullback may be over. The upwards trend may resume. The next target is now at 2,180. A new low below 1,764.12 at any time...
by Lara | Sep 4, 2020 | US Oil, US Oil Historical
US OIL: Elliott Wave and Technical Analysis | Charts – September 4, 2020 A pullback was expected and has finally begun to show some strength. Summary: Oil may have found a major sustainable low. A multi-week pullback is expected to end about 23.05. It is...
by Lara | Sep 3, 2020 | Gold
GOLD: Elliott Wave and Technical Analysis | Charts – September 3, 2020 A triangle pattern may be completing. All three Elliott wave counts remain valid. Summary: The pullback may be over. The upwards trend may resume. The next target is now at 2,180. A new low...
