
Last analysis expected a little more upwards movement towards a short term target at 1,263. Price has reached up to 1,263.06.
Thereafter, at about this target a short term trend change was expected for a few days of overall downwards movement.
Click on the charts below to enlarge.
Gold is still within a large fourth wave correction at primary wave degree which is incomplete. To see a full explanation of my reasoning for expecting that primary wave 4 is not over and is continuing see this.
Movement above 1,277.97 would provide confirmation that primary wave 4 is not over. At that stage upwards movement could not be a fourth wave correction within primary wave 5 because it would be in its first wave price territory, and the downwards movement labeled intermediate wave (X) would be confirmed as a completed three wave structure.
Primary wave 2 was a rare running flat correction, and was a deep 68% correction of primary wave 1. In order to show alternation in structure primary wave 4 may be a zigzag, double zigzag, combination, triangle or even an expanded flat. We can rule out a zigzag because the first wave subdivides as a three. This still leaves several structural possibilities.
Primary wave 4 is most likely to be a combination or triangle in order to show structural alternation with the running flat of primary wave 2.
The downwards wave labeled intermediate wave (X) is 99% the length of the upwards wave labeled intermediate wave (W). Primary wave 4 is unlikely to be a flat correction because if it were it would be a regular flat. These have similar behaviour and a similar look to running flats, and so there would be little structural alternation between primary waves 2 and 4.
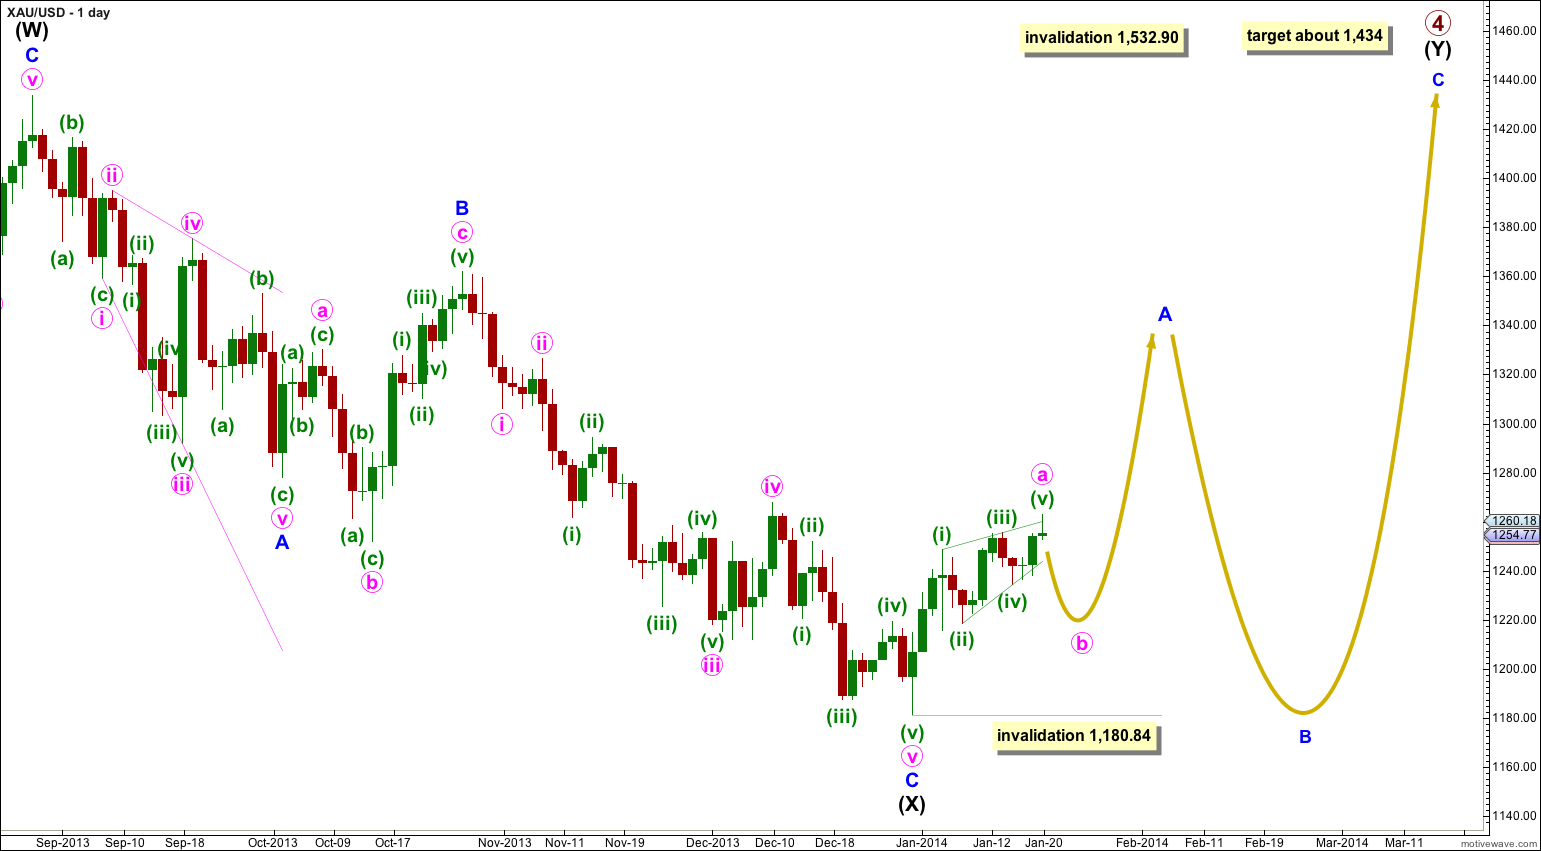
Primary wave 4 is most likely to be a combination rather than a double zigzag because of the depth of intermediate wave (X). Double combinations take up time and move price sideways, and their X waves can be very deep. Double zigzags are different because their purpose is to deepen a correction when the first zigzag does not move price deep enough, so their X waves are not normally very deep. Thus intermediate wave (Y) is most likely to be a flat correction, and less likely a triangle and least likely a zigzag. It is most likely to end about the same level as intermediate wave (W) at 1,434 so that the whole structure moves sideways. It may last about 43 to 89 days, depending upon what structure it takes.
If intermediate wave (Y) is a flat correction then within it minor wave B must retrace a minimum of 90% the length of minor wave A, and it may make a new low below 1,180.84.
If intermediate wave (Y) is a flat correction then within it minor wave A must subdivide as a three wave structure. At this stage it looks like minor wave A may be unfolding as a zigzag because minute wave a within it looks like it is unfolding as a leading diagonal which is a five wave structure.
Primary wave 4 may not move into primary wave 1 price territory. This wave count is invalidated with movement above 1,532.90.
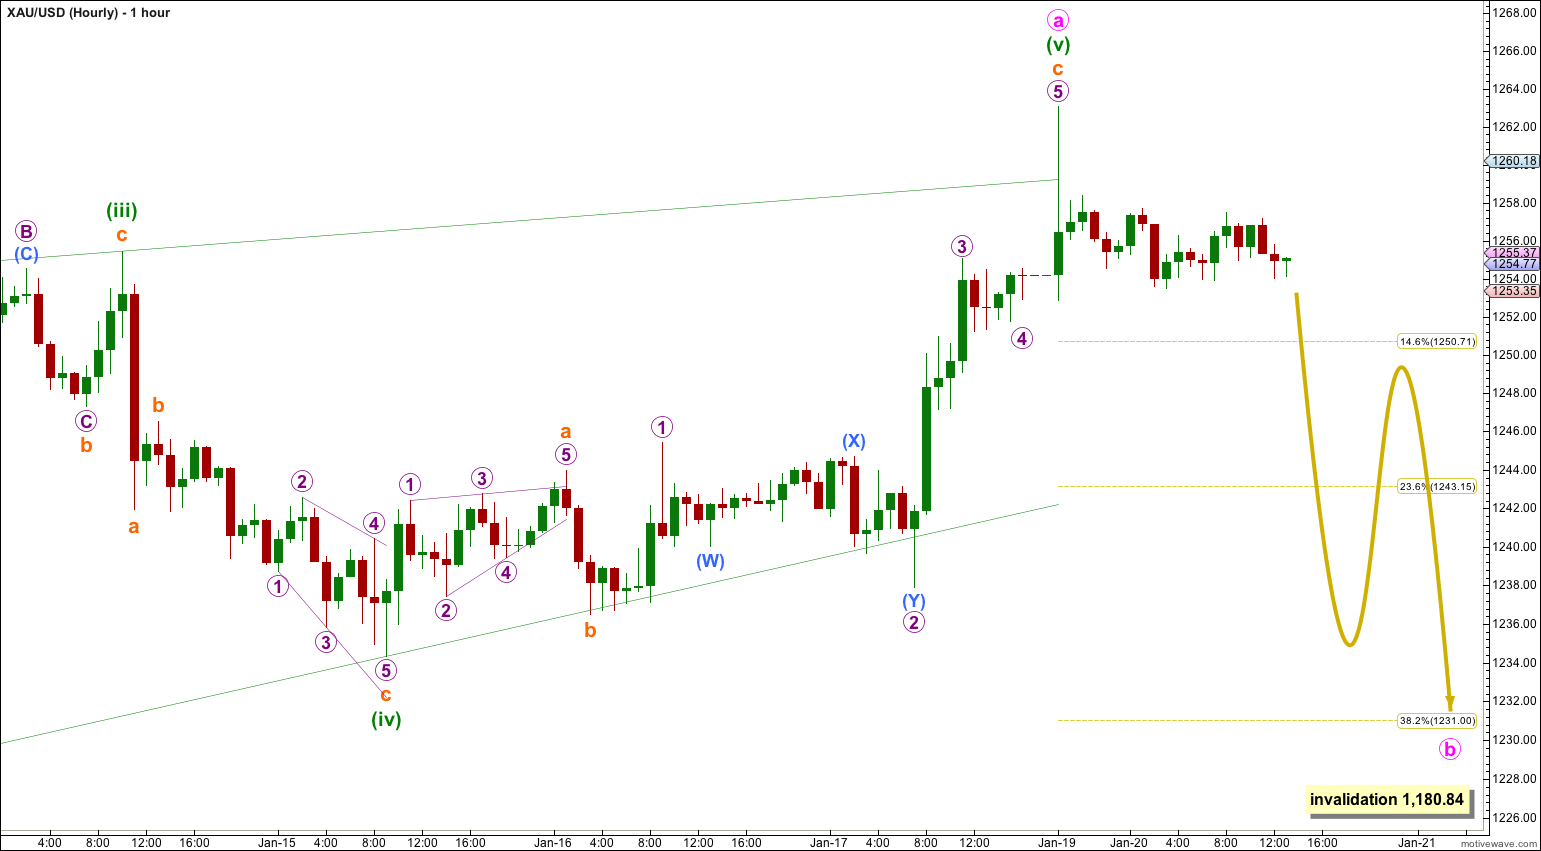
The leading diagonal structure of minute wave a is now complete. Minuette wave (v) slightly overshot the upper 1-3 trend line, which is reasonably common. This structure looks typical.
I would now expect a few days of very choppy overlapping downwards movement for minute wave b. Minute wave a lasted a Fibonacci thirteen days. I would expect minute wave b to last about eight or thirteen days.
At this early stage it is impossible to tell which structure will unfold for minute wave b, and there are thirteen possible structures. When more structure is complete I will draw a channel about this correction and use that to indicate where it may end, and to then confirm when it is over. For now I will use the Fibonacci ratios of minute wave a as targets for minute wave b, and I favour the 0.382 and 0.618 Fibonacci ratios equally.
If minute wave b unfolds as an expanded flat, running triangle or combination then it may include a B wave or X wave which may make a new high above 1,263.06. There can be no upper invalidation point for this wave count at this stage.
Minute wave b may not move beyond the start of minute wave a. This wave count is invalidated with movement below 1,180.84.
Alternate Daily Wave Count – Triangle.
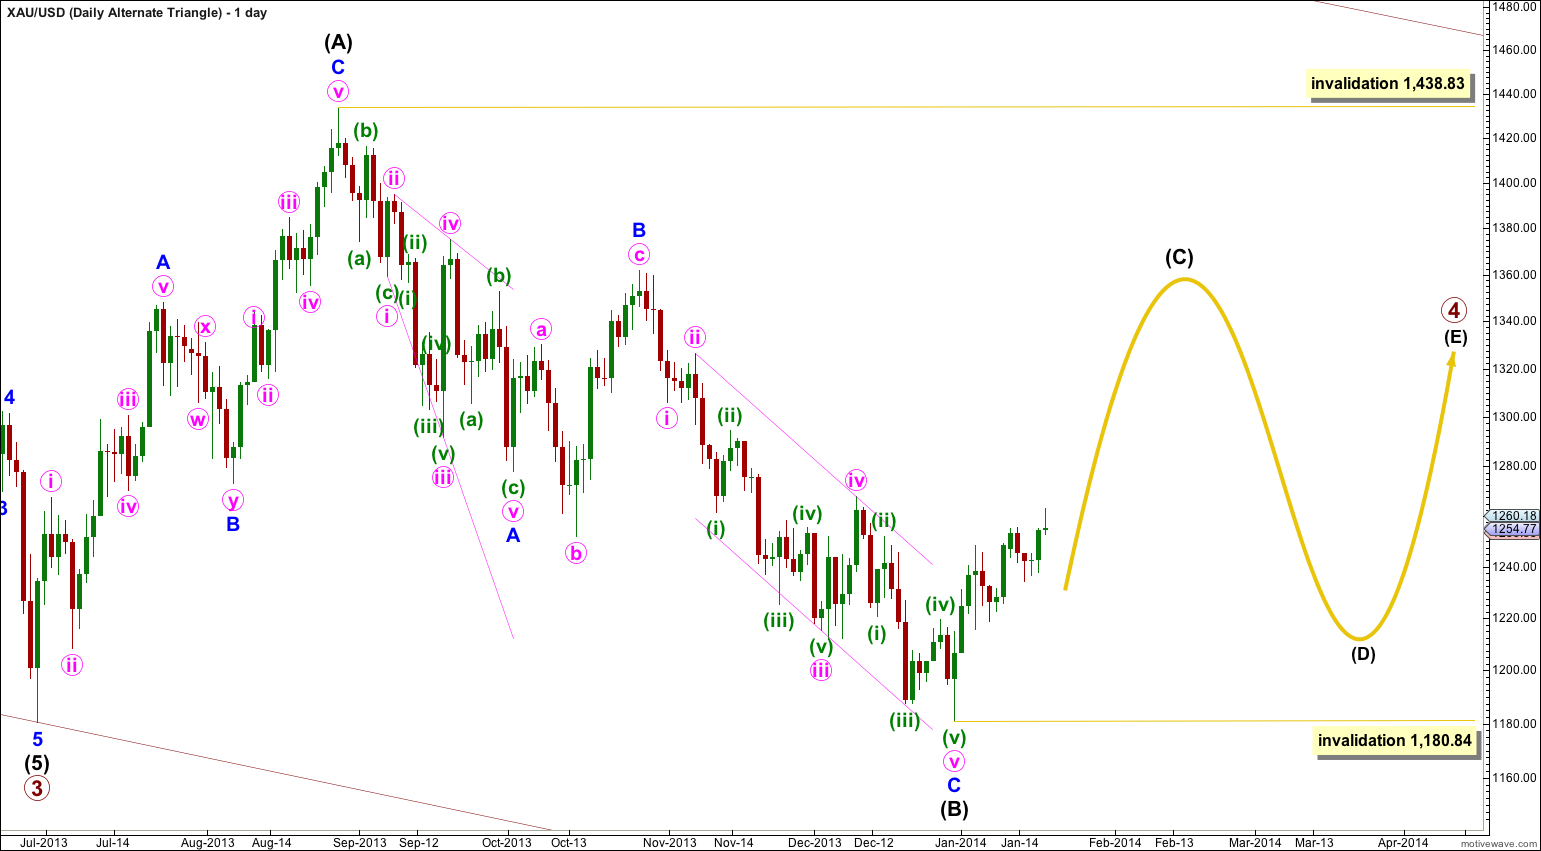
It is also possible that primary wave 4 may continue as a regular contracting (or barrier) triangle.
The expected direction of this next upwards wave is the same, but for this alternate intermediate wave (C) of the triangle may not move beyond the end of intermediate wave (A). The triangle is invalidated with movement above 1,438.83.
Intermediate wave (C) must unfold as either a single or double zigzag. Within it no second wave correction, nor wave B of the zigzag, may move beyond the start of the first wave or A wave. This wave count is invalidated with movement below 1,180.84.
The final intermediate wave (E) upwards may not move above the end of intermediate wave (C) for both a contracting and barrier triangle. E waves most commonly end short of the A-C trend line.
All five subwaves of a triangle must divide into corrective structures. If this next upwards movement subdivides as a zigzag which does not make a new high above 1,438.83 then this alternate would be correct.
Triangles take up time and move price sideways. If primary wave 4 unfolds as a triangle then I would expect it to last months rather than weeks.
thank you!
Even if it wasn’t a 3rd wave, I still want to understand why you thought it wouldn’t be.
I think you’re asking a really important question, and I want to give you a clear answer, but I’m not sure that you’re referring to when you say “it wasn’t a 3rd wave”. If you could specifically state which wave? labeled how on which chart? or (less preferably) from what price point and date to which price point and date?
Please see my full question posted below and my clarification on the 16th.
Lara I follow 3 Elliott Wave Analysts and as usual you are the Best. You provide more detail and actually make a call on the next moves and come very close and the others lately are stuck at undecided. If I had to choose one Elliott Wave Analyst for me to buy lots of Gold and Silver it is always you Lara.
Is it possible that the low on 15th Jan at 1233 was the start of wave 3 of a larger 3rd wave at Minute degree as per Fig 1-8 Frost & Prechter? 1181-1249 as the 1st wave (a leading diagonal). 1249-1217 as the 2nd wave. 1217-1255 as 1st wave of 3rd wave. 1255-1233 as 2nd wave of the 3rd wave.
One possible reason I see that you didn’t see this as an impulse is that 1217-1255 did not clear the high of 1249, but presumably an impulse remains within the realms of possibility. However, you seem to have excluded from your analysis (from the outset, it appears) the possibility of the entire move from the low at 1181 being an impulse (albeit within a corrective structure at Intermediate degree).
What have you seen which has made you exclude this as a possibility in your analysis that can give your readers the confidence that the move from 1233 isn’t the commencement of a powerful 3rd wave of 3? If you now consider it as even a possibility, what percentage would you give to the possibility of this being the case and why?
These upwards waves labeled minuette (i), (ii) and (iii) all subdivide as zigzags.
They cannot be first waves of the beginning of an impulse. First waves within impulses must subdivide as five wave structures, they cannot be three wave zigzags.