
Last analysis expected overall upwards movement while price remained within a channel, towards a mid term target.
Price has moved higher and remains within the channel. The target remains the same.
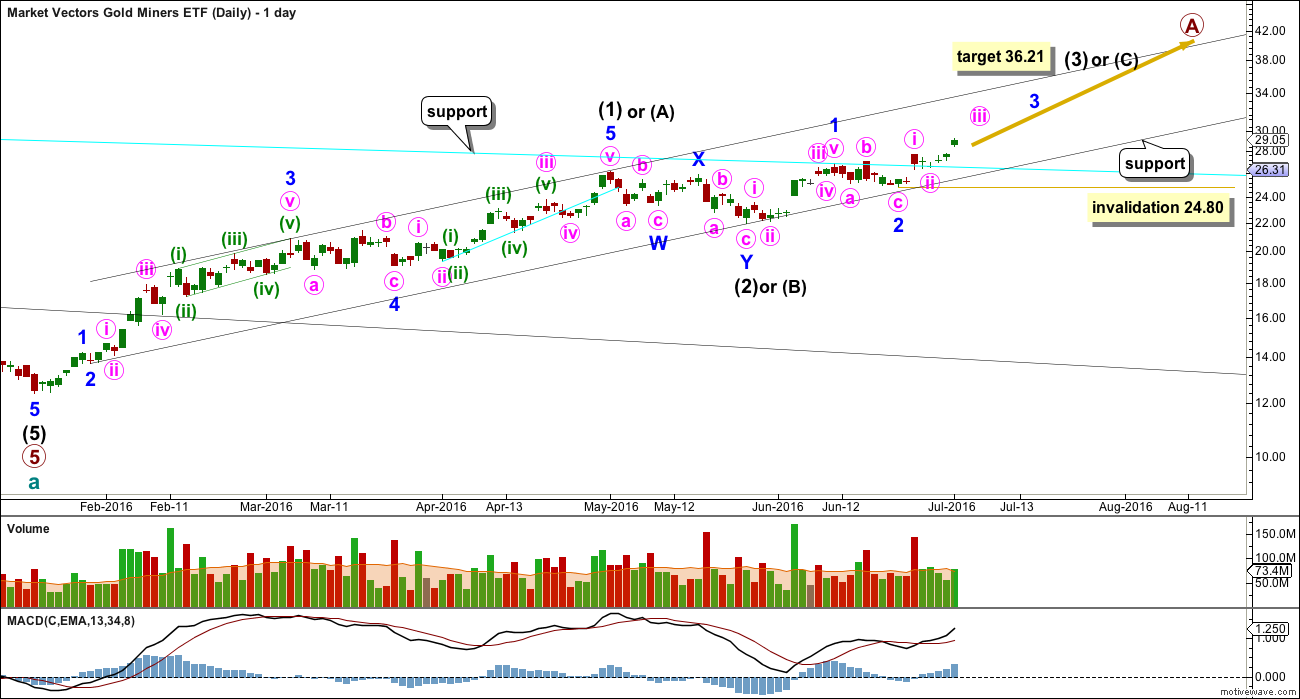
Summary: A third wave up to 36.21 continues. Downwards corrections should find support now at the lower edge of the black channel on the daily chart. If price breaks below the lower edge of the channel, the wave count would be in doubt. The invalidation point may now be moved up to 24.80.
New updates to this analysis are in bold.
MONTHLY ELLIOTT WAVE COUNT
Click chart to enlarge.
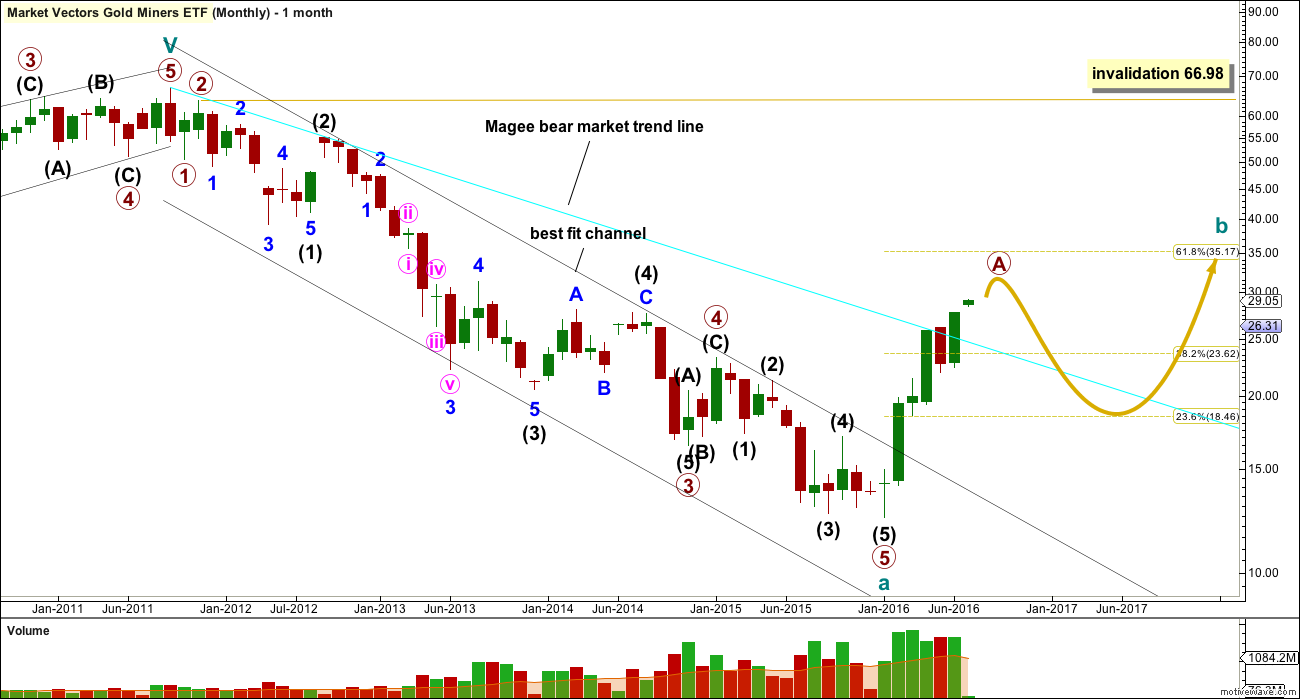
The whole wave down for cycle wave a subdivides well as a five wave impulse. However, GDX does not have adequate volume to produce typical looking Elliott wave structures. As always, this wave count comes with the strong caveat that this market is not sufficient in volume for a reliable Elliott wave analysis. It is a rough guide only. The direction expected from the Elliott wave count should be fairly reliable, but targets and invalidation points may not be.
Ratios within cycle wave a are: there is no Fibonacci ratio between primary waves 1 and 3, and primary wave 5 is 0.33 short of 0.236 the length of primary wave 3.
Ratios within primary wave 3 are: intermediate wave (3) is 3.48 short of 1.618 the length of intermediate wave (1), and intermediate wave (5) has no Fibonacci ratio to intermediate waves (3) or (1).
Ratios within intermediate wave (3) are: minor wave 3 has no Fibonacci ratio to minor wave 1, and minor wave 5 is just 0.02 longer than equality in length with minor wave 1.
Ratios within minor wave 3 are: minute wave iii is 0.38 longer than equality in length with minute wave i, and minute wave v has no Fibonacci ratio to either of minute waves i or iii.
Within primary wave 5, there are no adequate Fibonacci ratios between intermediate waves (1), (3) and (5).
The black channel is a best fit; this movement does not fit into an Elliott channel. The channel is breached very clearly and price has made a major new swing high above 17.04. A trend change was confirmed in February.
If analysis of downwards movement is correct that cycle wave a has subdivided as a five wave structure, then this tells us two things:
1. The bear market for GDX must be incomplete because a five may not be a corrective structure, so this must only be wave A.
2. Cycle wave b may not make a new high above the start of cycle wave a at 66.98.
Cycle wave b may be any one of 23 possible corrective structures. It may be a swift sharp zigzag, or it may be a sideways structure such as a flat, combination or triangle. It should last one to several years.
The first movement up for cycle wave b must be a clear five wave structure for a trend of this magnitude. It looks like this completed at the Magee trend line where price found resistance and rebounded down. This line is now breached, providing further strong confidence that GDX is in a bull market for a longer term.
DAILY ELLIOTT WAVE COUNT
Click chart to enlarge.
Primary wave A may be subdividing as a three or a five. If it is a five, it looks like an unfolding impulse. If it is a three, so far it looks like an unfolding zigzag. Both a zigzag and the start of an impulse subdivide 5-3-5, so at this stage it is not possible to determine which this may be. Both possibilities must be considered.
At 36.21 intermediate wave (3) or (C) would reach equality in length with intermediate wave (1) or (A).
Within minor wave 3, no second wave correction may move beyond the start of its first wave below 24.80.
If this wave count is correct, then price should continue to find support at the lower edge of the black channel along the way up. The earliest warning this wave count may be wrong and the alternate below may be correct would be a breach of the lower edge of the black channel.
If price breaks above the upper edge of the black channel, then intermediate wave (3) would be accelerating. It may complete a blowoff top at its end. A very strong upwards day with a strong volume spike may signal the end of intermediate wave (3).
ALTERANTE DAILY ELLIOTT WAVE COUNT
Click chart to enlarge.
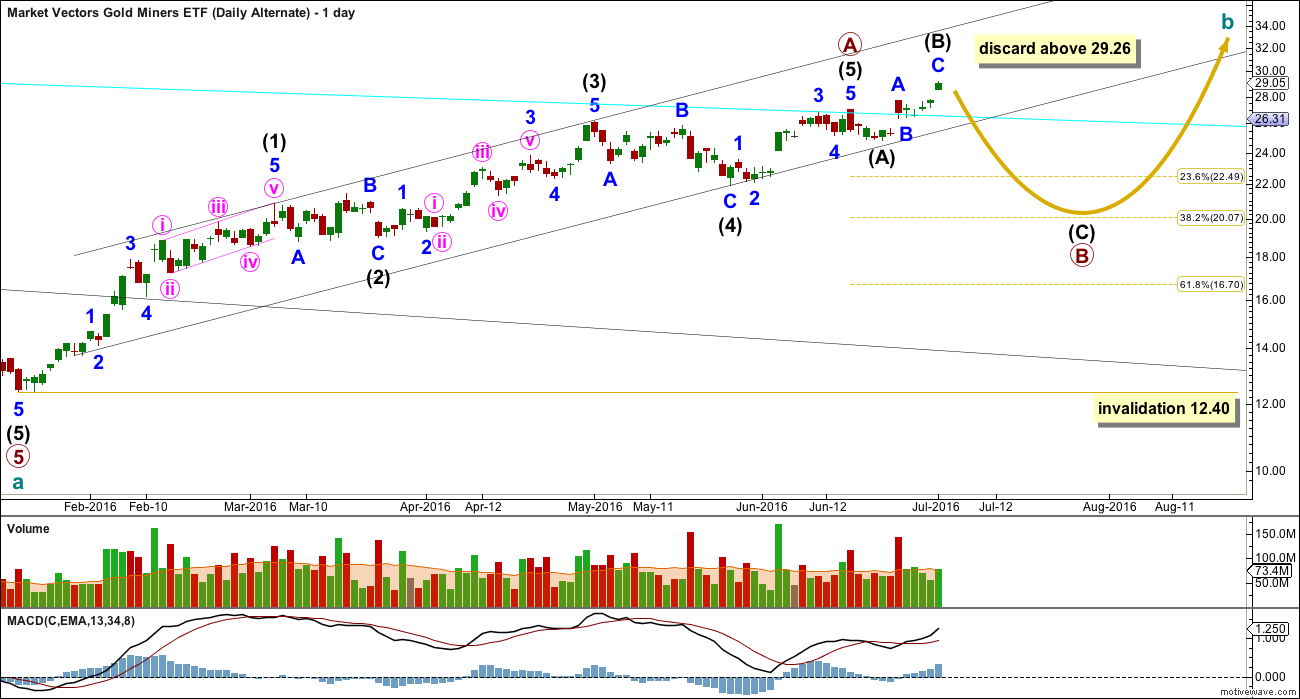
If price breaks below the lower edge of the black channel, then this wave count should be used. Assume the main wave count is correct while price remains within the black channel.
It is possible that primary wave A was a complete impulse on 16th of July, and primary wave B began there as an expanded flat correction.
If A is a five, then B may not move beyond its start below 12.40. Targets for primary wave B would be the 0.382 and 0.618 Fibonacci ratios at 20.07 and 16.70.
If primary wave B is a flat correction, then within it intermediate wave (B) is so far 1.97 the length of intermediate wave (A). This is considerably longer than the normal range of up to 1.38, which reduces the probability of this wave count. Above 29.26 intermediate wave (B) would be longer than 2 times the length of intermediate wave (A). At that stage, the idea of an expanded flat should be discarded due to an extremely low probability.
TECHNICAL ANALYSIS
WEEKLY
Click chart to enlarge.
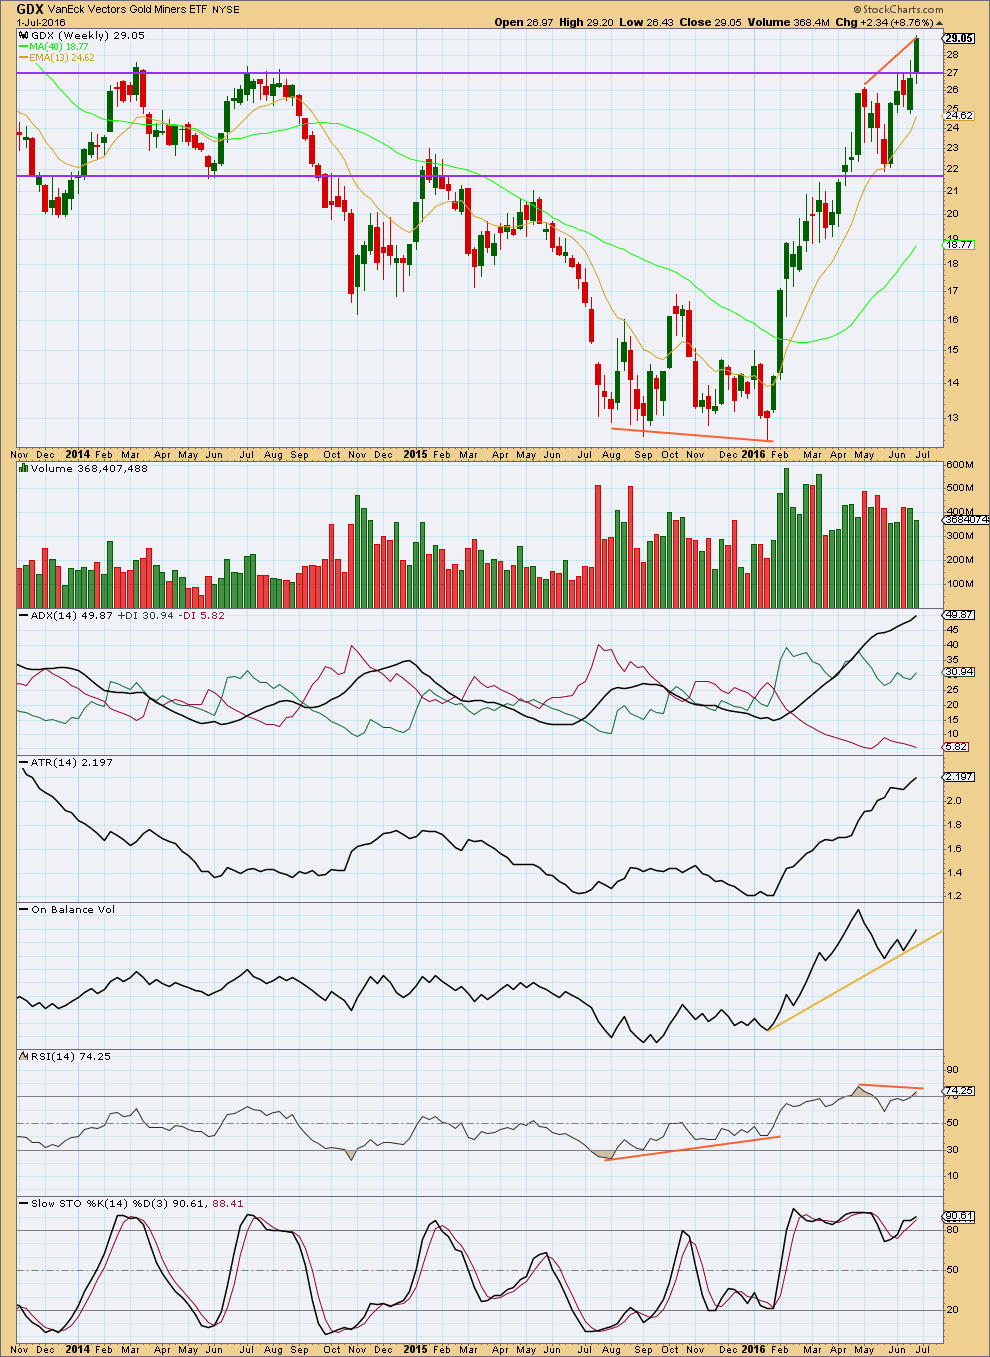
At the weekly chart level, there was double bullish divergence between price and RSI at the low of January 2016.
There is still single bearish divergence between price and RSI now at the current high. Volume for last week was reasonable, greater than the two prior upwards weeks but slightly less than the prior downwards week.
ADX still indicates the longer term weekly trend is upwards. ATR agrees as it is increasing. However, ADX is now over 45, so the trend is extreme. Caution is advised. If the market is still trending, then price should find support about the 13 week moving average. A clear break below this average would indicate a larger correction may have arrived.
On Balance Volume is finding support at the yellow line. A break below this line would indicate price should move strongly lower for a deeper correction. In the first instance, it should be expected that OBV may find support at the line if it comes down to it again.
There is also divergence between price and Stochastics at the last two highs. This indicates some weakness.
DAILY
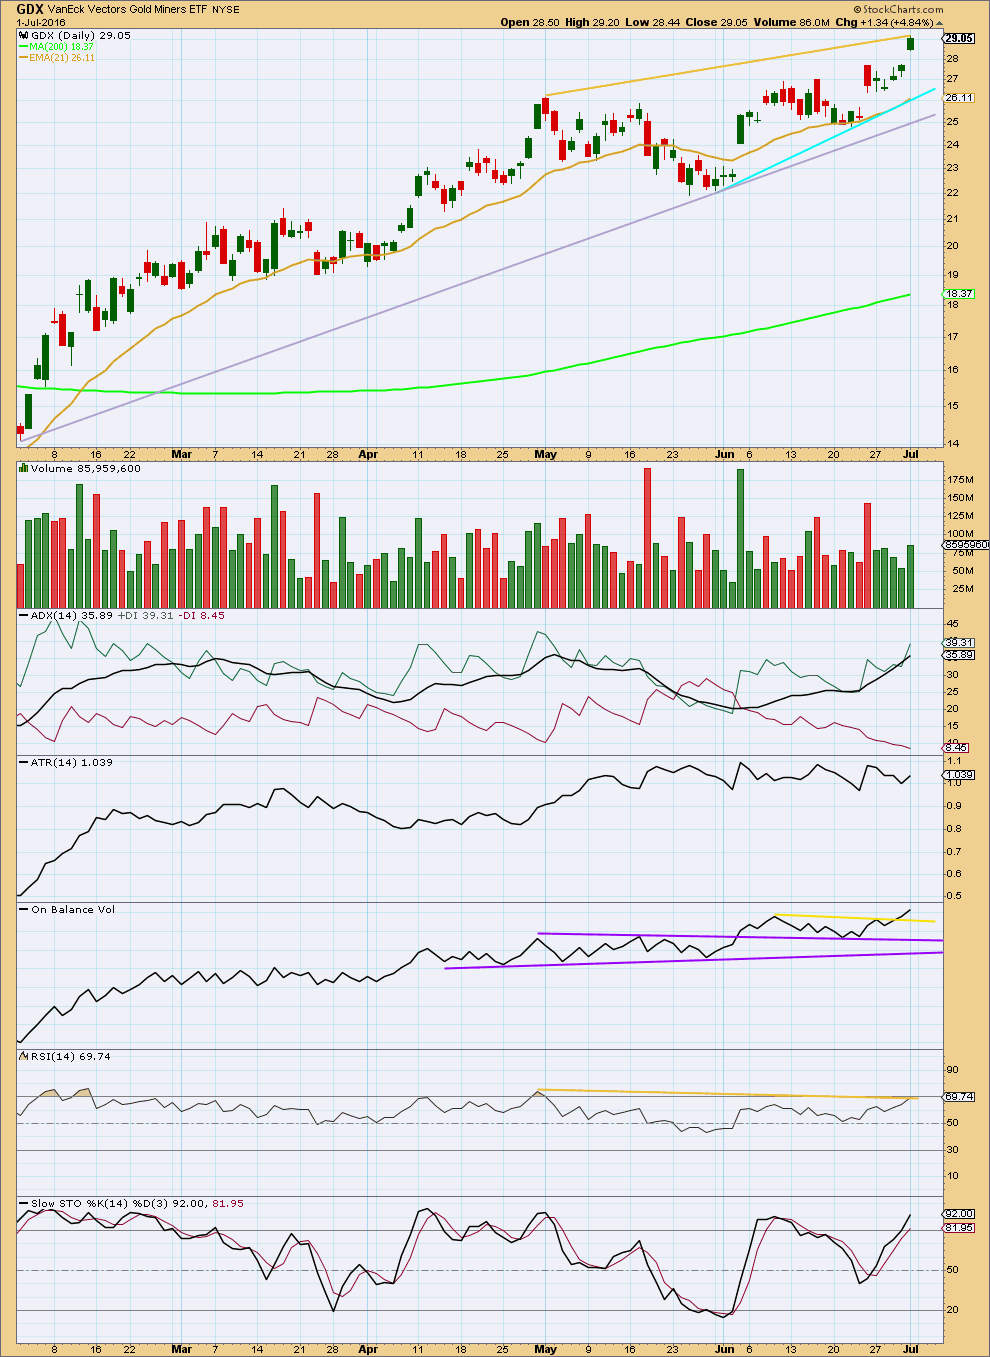
Click chart to enlarge.
Price may continue to find support at the cyan trend line. If that is breached, then it may find support at the lilac trend line.
On 1st of July (the last day of data from StockCharts), volume supported the upwards movement in price.
At the daily chart level, ADX is not extreme. ADX indicates there is an upwards trend in place. ATR neither agrees nor disagrees; it is flat. It should be assumed that there is still an upwards trend until ADX turns down or price breaks below support.
On Balance Volume has given a very recent strong bullish signal with a break above both yellow lines.
RSI and price exhibit bearish divergence (yellow lines). This indicates upwards movement may be weakening, a correction may arrive soon.
This analysis is published @ 04:08 a.m. EST.
Thank you Lara for doing this update on GDX. Great timing. The analysis helped me have confidence in my recent bullish purchase– Nugt follows GDX.
I read below that you can calculate a target for primary A if you have intermediate (A) and (B) complete. And I see target 36.21 on daily for (C) / or (3). So you confused me here. You’ve got intermediate (A) and (B) labeled on the daily. Looks like (C) has a 36.21 target, and therefore Primary A. ?? No?
Hi DS,
Im figuring that Lara first needs to confirm if its (3) or (C). (3) would mean we have a lot further to go. (C) would probably mean A would be ending around 35. Lara, am I interpreting correctly? And thanks for your answer below. Also, Lara, is the structure tipping its hand at all? Im guessing if divergences persist that could be a tell.
Today GDX shows no signs of slowing down. Volume is up, price is up, On Balance Volume is bullish.
RSI is only just entering overbought, but shows no divergence with price. If RSI shows some divergence then I’d be out of long positions and expecting a larger correction. But I notice at the last reasonable swing high of 2nd of May RSI only showed day on day divergence, so it may be that this may not happen again.
GDX is a hard one. This is one reason why this is not an instrument I trade personally. I’m only analysing it because members keep asking for me to do it.
Correct, but only if primary wave A subdivides as a zigzag.
Primary wave A may be a zigzag. But it may also be an impulse. Or a flat correction. Or a multiple zigzag. Or… or quite a lot of things.
It is imposible at this early stage to know what it is exactly.
Hi Lara,
The daily chart does not appear to align with your monthly count ( or does it?). Also, the montly A seems to be moving higher and higher as time has passed. I know targets change, but a change from around 25 to around 35 ( or higher ) seems signicant and makes me wonder if it is becoming invalidated. Any thoughts? Thanks!
I have never provided a target for primary wave A because I cannot be sure what structure it is, a three or a five. Placement of that label is a general indication only.
If I place a label and it doesn’t have a target next to it, then don’t read that as that is where I expect price to complete that wave.
Likewise, do not expect straight line arrows to mean I expect price to move in a straight line. It just doesn’t do that.
Both monthly and daily charts expect that primary wave A is incomplete. When intermediate (A) and (B) or (1) through to (4) within primary wave A are all complete then I can calculate a target for it to end. That cannot be done yet.
Lara, thanks so much for the GDX update. Hope your neck is on the mend!
It gets better each day, thanks Dreamer!
I managed one surf session last week so my soul is soothed, that helps my neck 🙂
I can understand the love of surfing.
Although I never surfed I did water skiing for 40 years and if the boat was going somewhere I’d ask if I could water ski there even if it was an hour away.
So much fun and freedom.
Of course surfing is way more free and wild that water skiing so that much more exciting when you do it well.
Like Lara said, it soothes the soul.
Hi Lara, Avi Gilburt and his team also have this downtrend from 2011 as a 5-wave decline. They mark it as a c though, A being the 2008-2009 down wave and B the up wave 2009-2011. So, last January is a major low in their primary count and we are in a very long-term bull trend already then. It would be very interesting to have your comments on this idea: http://www.marketwatch.com/story/buying-gold-in-2016-is-like-buying-stocks-in-1941-2016-03-18; https://cdn77.elliottwavetrader.net/images/charts/201603/full-l3FvI6fW9r8IVFpxHZzy8.png . Thanks!
I am aware that this comment is public, so first off, I will say that my Elliott wave will always follow all the rules as laid out in “Elliott Wave Principle” by Frost and Prechter.
I do not have a wave count for HUI. Individual equities do not have sufficient volume for reliable EW analysis, hence my disclaimer at the beginning of this GDX analysis.
The idea for a correction as an expanded flat looks good and meets all rules.
But the way that the big downwards wave of C (circle) is labelled is invalid according to the rules in Frost and Prechter. Within it sub waves (3) and (5) are labelled a-b-c, as threes. They should be fives.
I am aware that other analysts choose to use Elliott wave rules that are different from Frost and Prechter. It is my contention however that any variation from those rules is not strictly Elliott wave.
Hi Lara, thanks for the post. GDX hit 29.33 in the after hour this morning. Shall we consider to void the alternative daily count?
I think so. With GDX’s inverted H&S pattern playing out and the main count showing that we are in a 3rd of a 3rd of a 3rd wave, we are going higher. I think we go to 32 pretty quick to fill an old gap before we have a multi day correction for minor 4. Although we could have a brief correction for Minute 4, maybe around 30ish.
Thanks, Dreamer. I appreciate it.
Yes, that would be the best approach
Thanks, Lara.