
Last analysis expected upwards movement to begin the new week. So far this is what has happened.
Summary: Upwards movement is expected from here. The target at 1,533 may be met in about six months time. There is divergence with price and Stochastics and RSI indicating bears are exhausted. If this view is wrong today, then Gold may make one final new low to a target at 1,203 before turning. A new high above 1,221.62 would add confidence in a trend change.
New updates to this analysis are in bold.
Grand SuperCycle analysis is here.
Last monthly and weekly charts are here.
DAILY ELLIOTT WAVE COUNT
Click chart to enlarge.
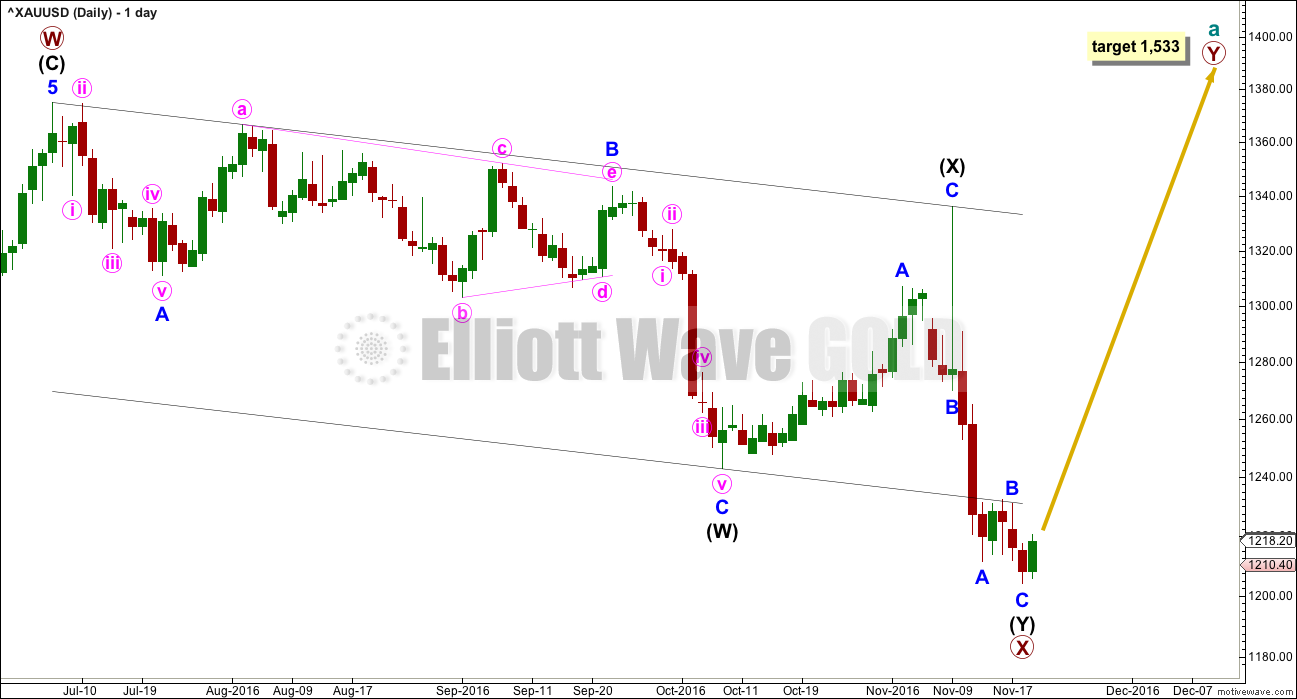
The larger structure of primary wave X may be either a double zigzag or a double combination. The second structure in this double for primary wave Y may be either a zigzag (for a double zigzag) or a flat or a triangle (for a double combination).
It is my judgement at this stage that it is more likely primary wave X will be a double zigzag due to the relatively shallow correction of intermediate wave (X). Although intermediate wave (X) is deep at 0.71 the length of intermediate wave (W), this is comfortably less than the 0.9 minimum requirement for a flat correction. Within combinations the X wave is most often very deep and looks like a B wave within a flat.
However, there is no minimum nor maximum requirement for X waves within combinations, so both a double zigzag and double combination must be understood to be possible. A double zigzag is more likely and that is how this analysis shall proceed.
Within the second structure, minor wave A should be a five wave structure. This now looks complete.
Minor wave B found resistance at the lower edge of the wide parallel channel about primary wave X. Minor wave C may now be complete at the hourly chart level. Minor wave C has no Fibonacci ratio to minor wave A. Intermediate wave (Y) is just 0.02 longer than equality in length with intermediate wave (W).
At 1,533 primary wave Y would reach equality in length with primary wave W.
Primary wave W lasted seven months. Primary wave Y may be expected to be about even in duration.
HOURLY ELLIOTT WAVE COUNT
Click chart to enlarge.
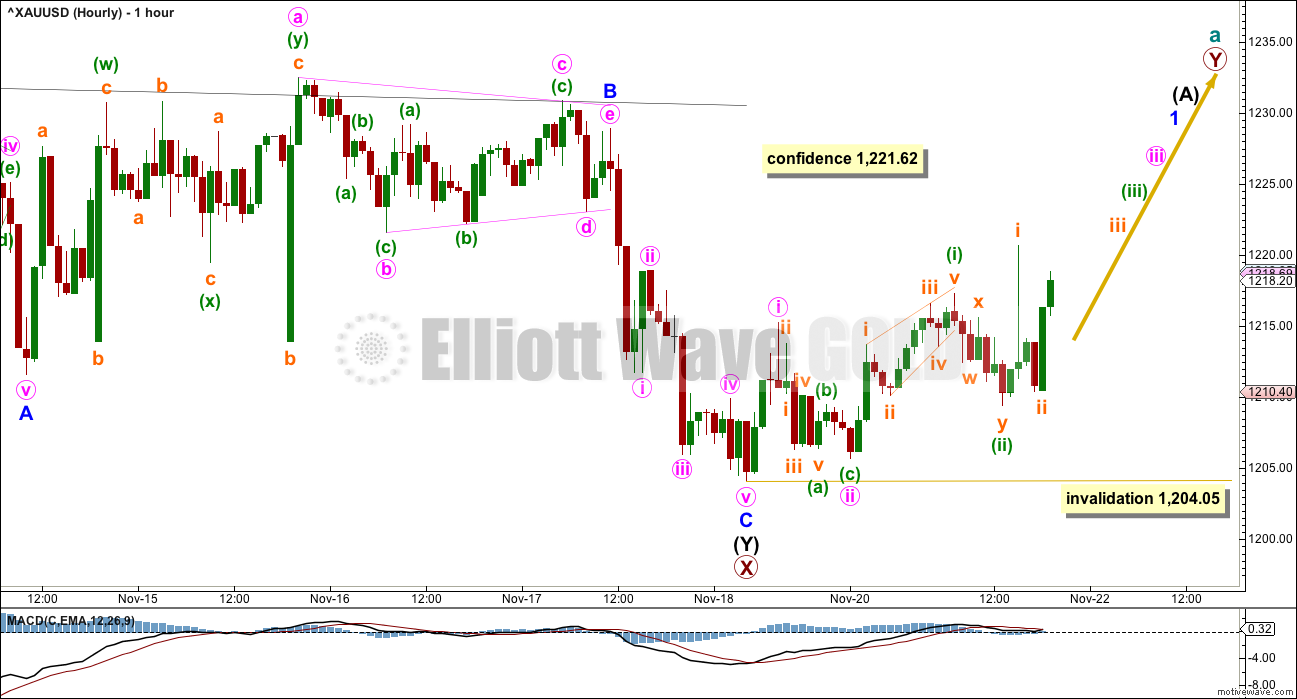
Minor wave B completed as a regular contracting triangle. Gold often exhibits surprisingly short waves out of its triangles.
Minor wave C has moved slightly below the end of minor wave A, avoiding a truncation. The structure now looks complete at the hourly chart level.
Within minor wave C, there are no adequate Fibonacci ratios between minute waves i, iii and v.
Within the new upwards movement, the spike labelled subminuette wave i may disappear from BarChart data tomorrow. It is not noticed on other Gold data feeds.
Intermediate wave (A) should subdivide as a five wave structure if cycle wave a is a double zigzag. Within intermediate wave (A), the upcoming correction for minor wave 2 may not move beyond its start below 1,204.05.
When there is a clear five up on the hourly chart, then more confidence may be had in this wave count.
A new high above 1,221.62 would add confidence. At that stage, the second hourly chart below would be invalidated.
SECOND HOURLY ELLIOTT WAVE COUNT
Click chart to enlarge.
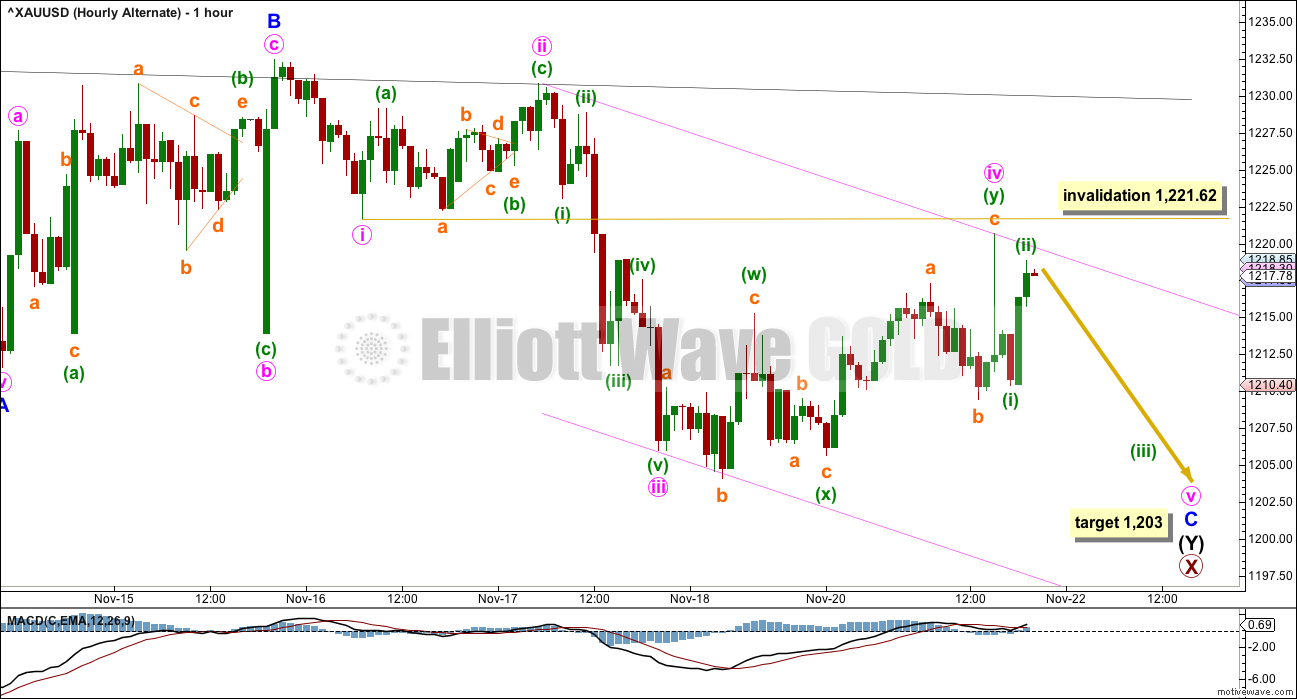
What if minor wave B was not a triangle but completed as a zigzag? Minor wave C may have begun earlier.
Minor wave C must complete as a five wave structure. It may need on final new low to end minute wave v within it.
Within minor wave C, there is alternation between the zigzag of minute wave ii and the combination of minute wave iv.
At 1,203 minute wave v would reach 1.618 the length of minute wave i. There is no Fibonacci ratio between minute waves i and iii, so a ratio for minute wave v is likely.
Minute wave iv may not move into minute wave i price territory above 1,221.62.
While this wave count is entirely possible, it is judged to have a lower probability than the first hourly chart today.
ALTERNATE DAILY ELLIOTT WAVE COUNT
Click chart to enlarge.
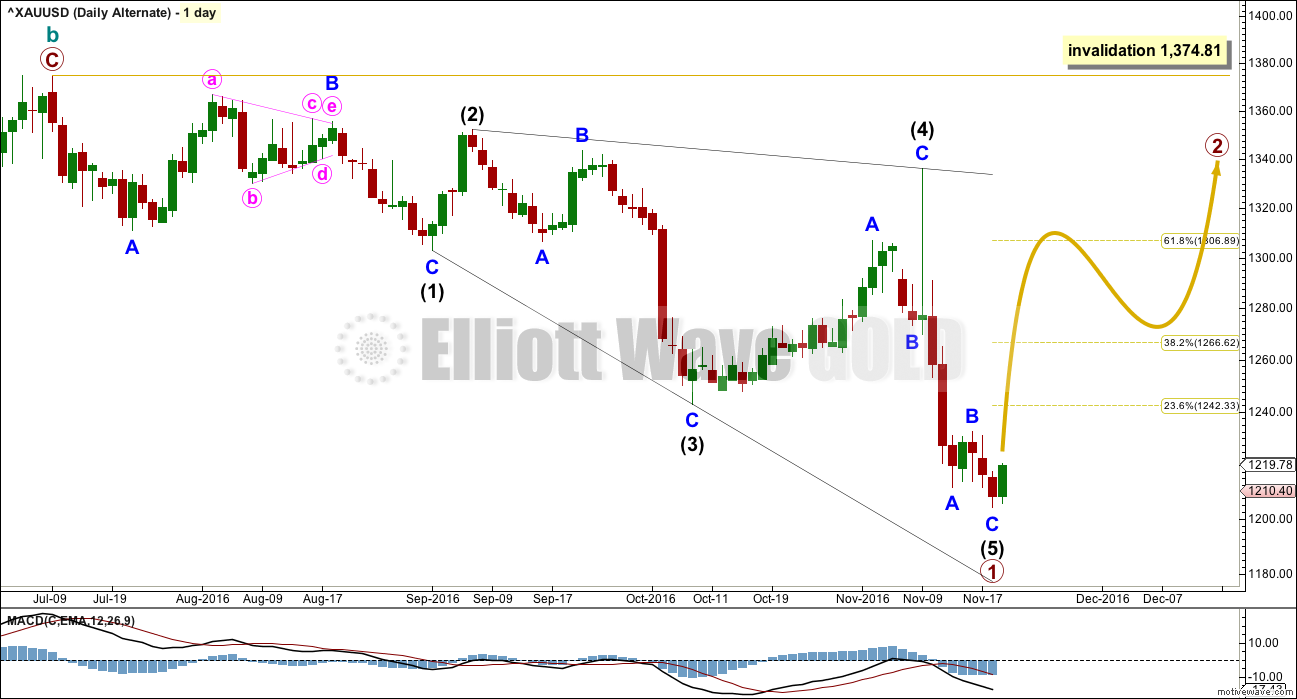
This alternate wave count expects that the large upwards zigzag from the low of 1,046 in December 2015 to the last high of 1,374 in July 2016 is a complete correction. The trend is still down; Gold is still in a bear market.
If there has been a cycle degree trend change at the high labelled cycle wave b, then the new wave down must begin with a five wave structure. At this stage, there looks to be too much overlapping for an impulse, so a leading diagonal is considered.
Within leading diagonals, sub-waves 2 and 4 must subdivide as zigzags. Sub-waves 1, 3 and 5 are most commonly zigzags but sometimes may also appear to be impulses.
Within this structure, all sub-waves subdivide as zigzags. This wave count meets all Elliott wave rules. This diagonal looks correct.
Primary wave 1 lasted 94 days. Primary wave 2 may initially be expected to last about a Fibonacci 55 or 89 days. It should be a big three wave structure.
At this stage, there is no divergence in expected direction between this alternate and the main wave count. The structure of upwards movement, if it is clearly a three or five, may assist to tell us which wave count is correct in coming weeks. For now this alternate must be judged to have a low probability due to the problems outlined. It is published to consider all possibilities.
TECHNICAL ANALYSIS
WEEKLY CHART
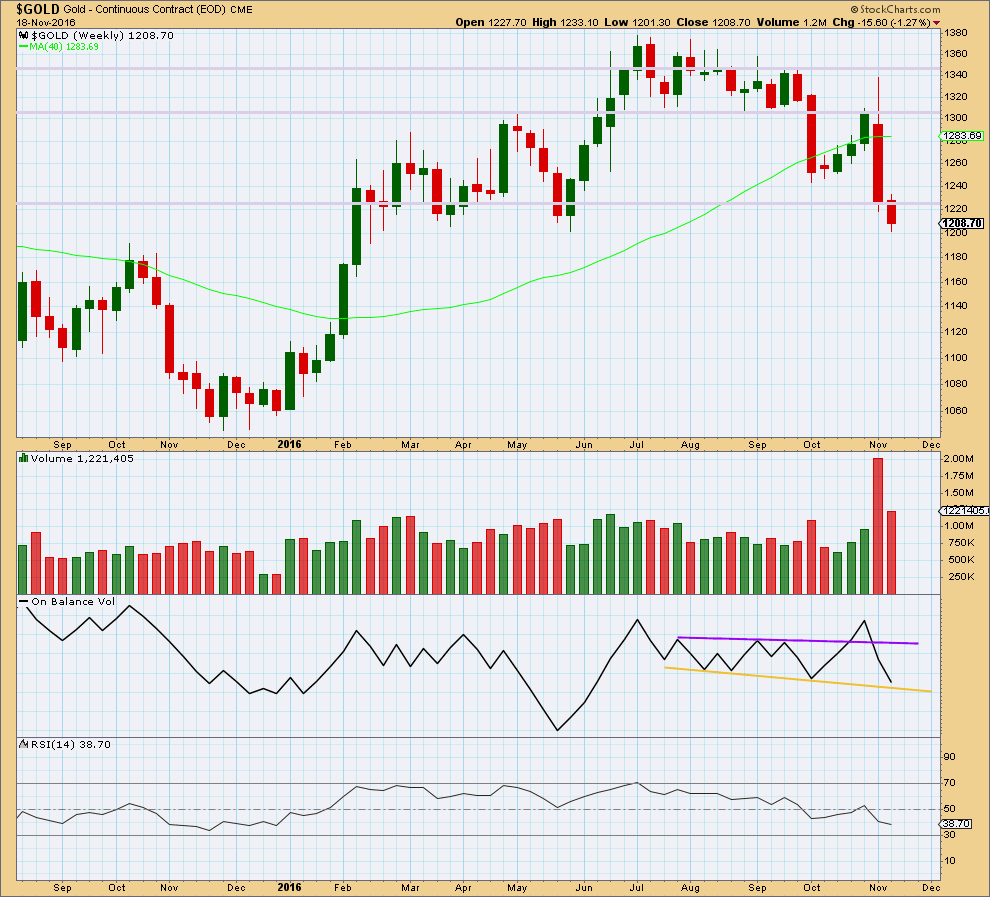
Click chart to enlarge. Chart courtesy of StockCharts.com.
Last week completes with a smaller range and a substantial decline in volume. The fall in price is not supported by volume, so it is suspicious. It looks like bears are tired.
Price may find support here about 1,200.
On Balance Volume has come down to almost touch the yellow support line. There is a very little room for more downwards movement. This line should be expected to provide support and assist to halt the fall in price either here or very soon.
RSI is not extreme and does not exhibit divergence with price. There is room still for price to fall further.
DAILY CHART
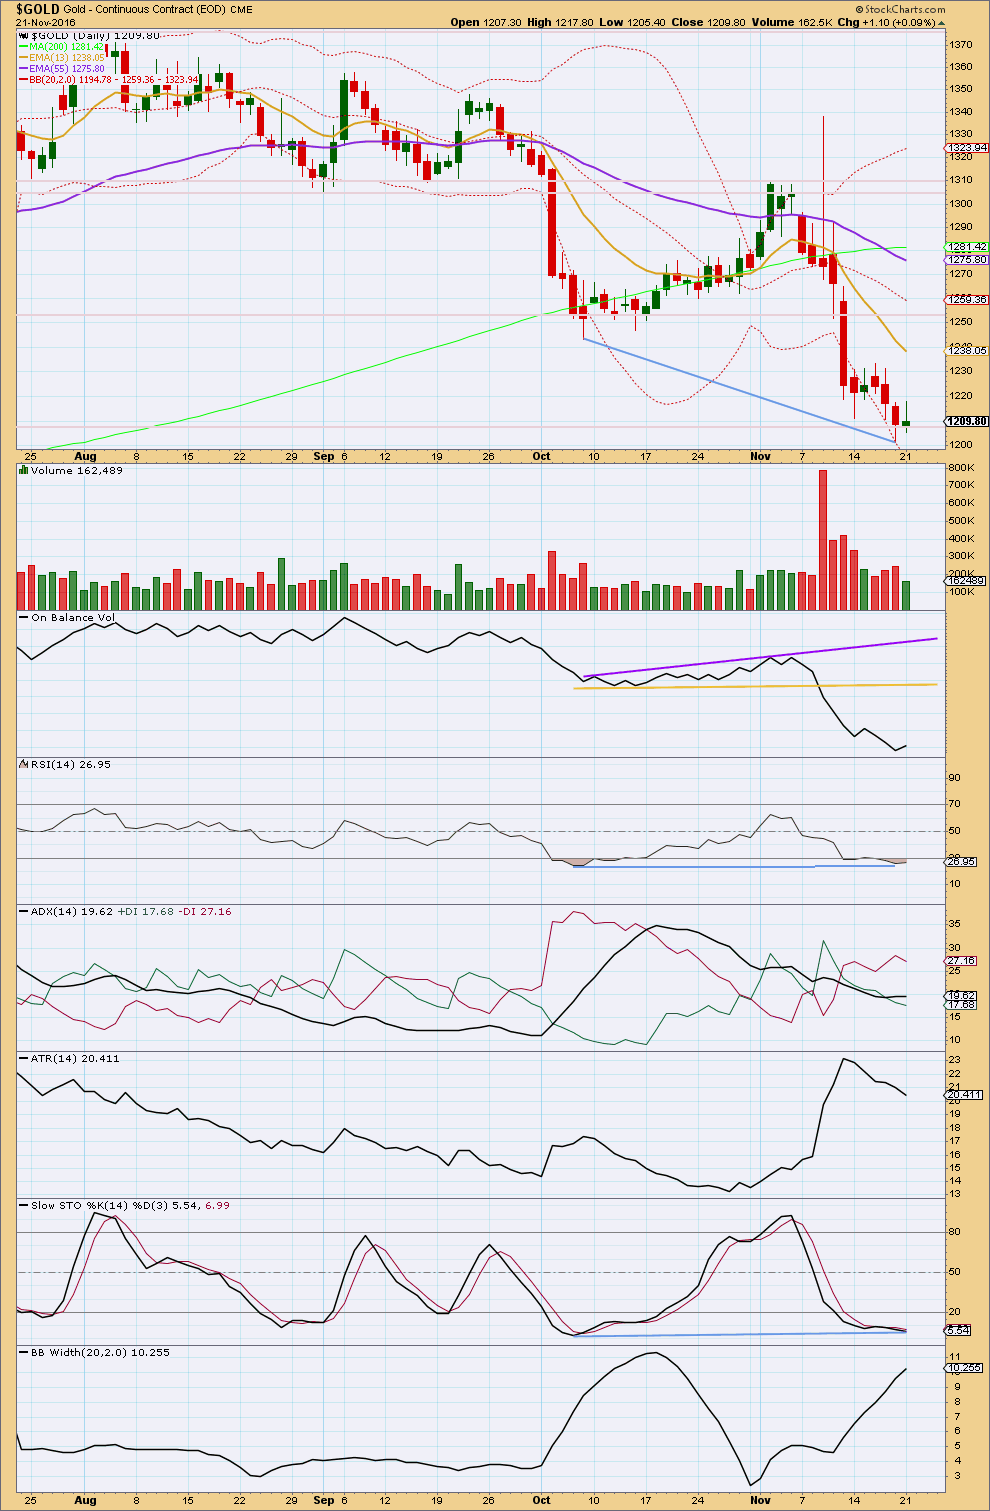
Click chart to enlarge. Chart courtesy of StockCharts.com.
A small upwards day with higher high and a higher low has moved price higher. The upper wick of today’s candlestick is relatively long and the real body is small. This is not a strong upwards day. Volume is light; the rise in price today did not have support from volume. This candlestick looks like a small counter trend correction.
Sometimes Gold’s new waves do begin with some hesitancy. However, at this stage, today’s candlestick favours the second hourly chart which expects Gold to make one more slight new low before turning.
There are no support lines at the daily chart level for On Balance Volume to help stop a fall in price here.
There is still mid term divergence between price and RSI and Stochcastics at the two lows of the 7th of October and the 18th of November. This is regular bullish divergence and indicates bears are exhausted.
ADX has slightly increased further today. It still indicates a downwards trend is in place. This is a lagging indicator though as it is based upon a 14 day average.
If there is a downwards trend, then it is showing some signs of weakness; ATR is declining.
Bollinger Bands continue to widen though indicating a trending market.
The Elliott wave count here is indicating a trend change before these indicators. If the main Elliott wave count is wrong, then the second hourly chart may be right and Gold may make one more low before turning.
This analysis is published @ 09:02 p.m. EST.
[Note: Analysis is public today for promotional purposes. Member comments and discussion will remain private.]
thanks giving – every year the same question. Can you sell what you have or can you buy what you desire 🙂
Hang tight john, I’ve been there many times…..I think we are within a few weeks if not at a good turn soon
Miners filled the gap from yesterday and closed near the daily high, although volume was anemic. A small win on a sideways to down day for gold.
A few thoughts:
1. Commitment of traders report did not show heavy buying by commercials but there was a lot of liquidation of short positions, so they were nervous at about 1230 on Tuesday. Gold has dropped about 20 bucks since. There was a high probability that more shorts were closed out and some longs taken. This weeks Cot will show this.
2. We haven’t had a flush “oh my gosh” moment in gold going down hard. I expect this may happen between now and dec 15 the next fed meeting but could just bounce around here and form a bottom before commercials are buying contracts at a higher volume.
3. The line in the sand might be 1200 for a lot of stops and if that gets taken out we might have a flush of gold selling from week hands.
4. Probably best to keep nibbling your fav stocks and positions. anything can set this keg of dynamite off.
Just thinking out loud
Might be….. in just saying if it falls below 1200 a lot of people will throw in the towel. I have been nibbling here and this may hold over1200, so I’ll keep some dry powder for a selling climax or a move up over 1221.62
The spike on BarCharts data is still there.
Upwards movement from the last low to the last high won’t subdivide as a motive structure; neither an impulse nor ending diagonal fit.
The motive wave may have ended earlier, and that upwards movement and todays downwards movement may be part of the following correction. It will fit well as a combination; zigzag – X – regular flat.
One more low possibly below 1,206.77 but not below 1,204.05 could complete the structure. Or micro 4 could be a short quick correction within the end, seen on a lower time frame.
Price still has not given us confidence in a trend change above 1,221.62.
Short term a new high above 1,216.61 would add confidence that subminuette c of minuette (y) of minute ii must be over. Upwards movement could not be micro 4, so micro 4 would have to be over.
Expecting more up for GDX
Thank you Dreamer for posting the GDX chart and the onfo from GannGlobal.
GannGlobal thinks now is a good time to buy gold
http://www.gannglobal.com/webinar/2016/November/GGF/16-11-GGF-Video3.php?inf_contact_key=1ffd7bdabc4572cf94476faa4e918acc72944df4bc024d29e159e4a1aae4a2e7