
Upwards movement continued to the target on the main hourly Elliott wave count.
Summary: Targets for upwards movement to end are 1,219 (about 40% likely) or 1,238 (about 60% likely). In the short term, a new low below 1,207.34 would indicate a deeper correction may be beginning. But for confidence a breach of the gold channel would still be required.
New updates to this analysis are in bold.
Last monthly and weekly charts are here. Last historic analysis video is here.
Grand SuperCycle analysis is here.
MAIN ELLIOTT WAVE COUNT
DAILY CHART
Click chart to enlarge.
This main wave count has a better fit for prior movement. To see the difference between this main wave count and the alternate below please refer to last historic analysis linked to above.
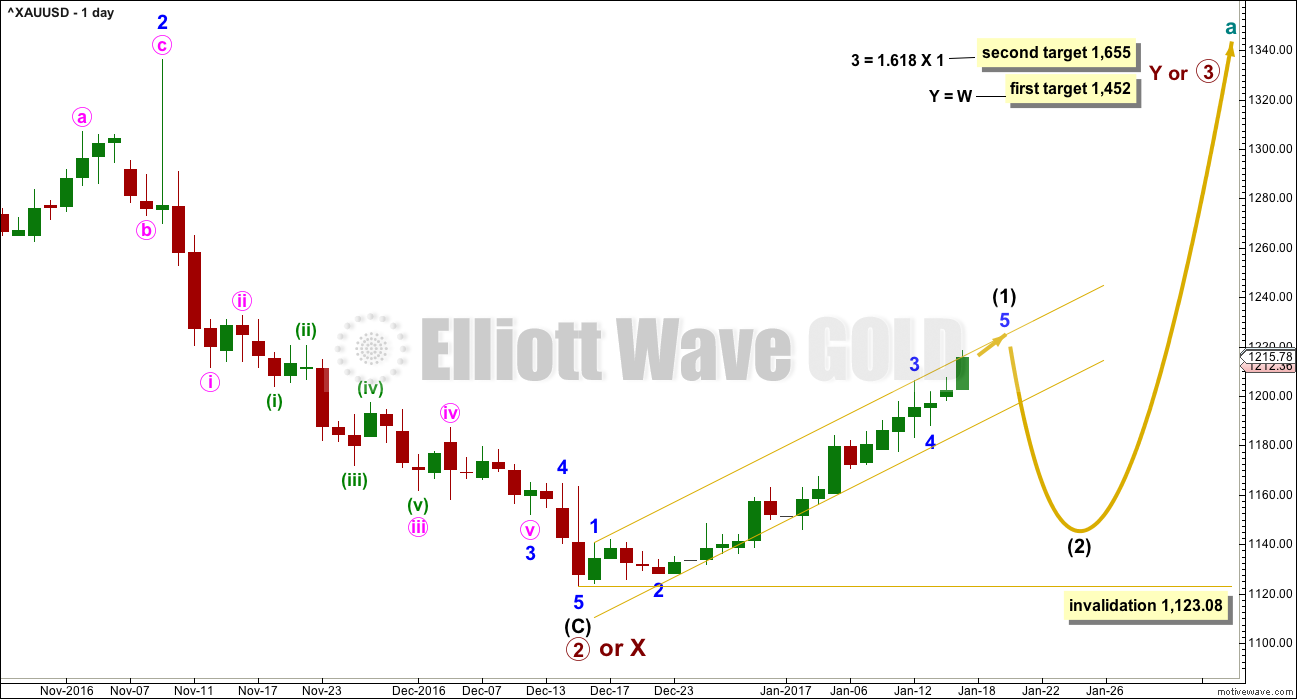
This main wave count expects Gold has had a primary degree trend change in December 2016. The new upwards wave is either a primary degree third wave, or a primary degree zigzag to complete a double zigzag.
Intermediate wave (1) is still not over and may not exhibit a Fibonacci duration. So far price remains within the gold channel. A breach of the gold channel on the daily chart would provide strong indication of a trend change.
The first in a series of second wave corrections for Gold’s new impulses is usually very deep. Intermediate wave (2) is expected to be at least 0.618 the depth of intermediate wave (1), and very likely may be deeper. It may not move beyond the start of intermediate wave (1) below 1,123.08.
The upcoming correction for intermediate wave (2) should present an opportunity to join a new trend.
Intermediate wave (2) may be at least as long in duration as intermediate wave (1), and fairly likely it may be longer. A Fibonacci 21 or 34 sessions will be the expectation. Corrections are often more time consuming than impulses.
HOURLY CHART
Click chart to enlarge.
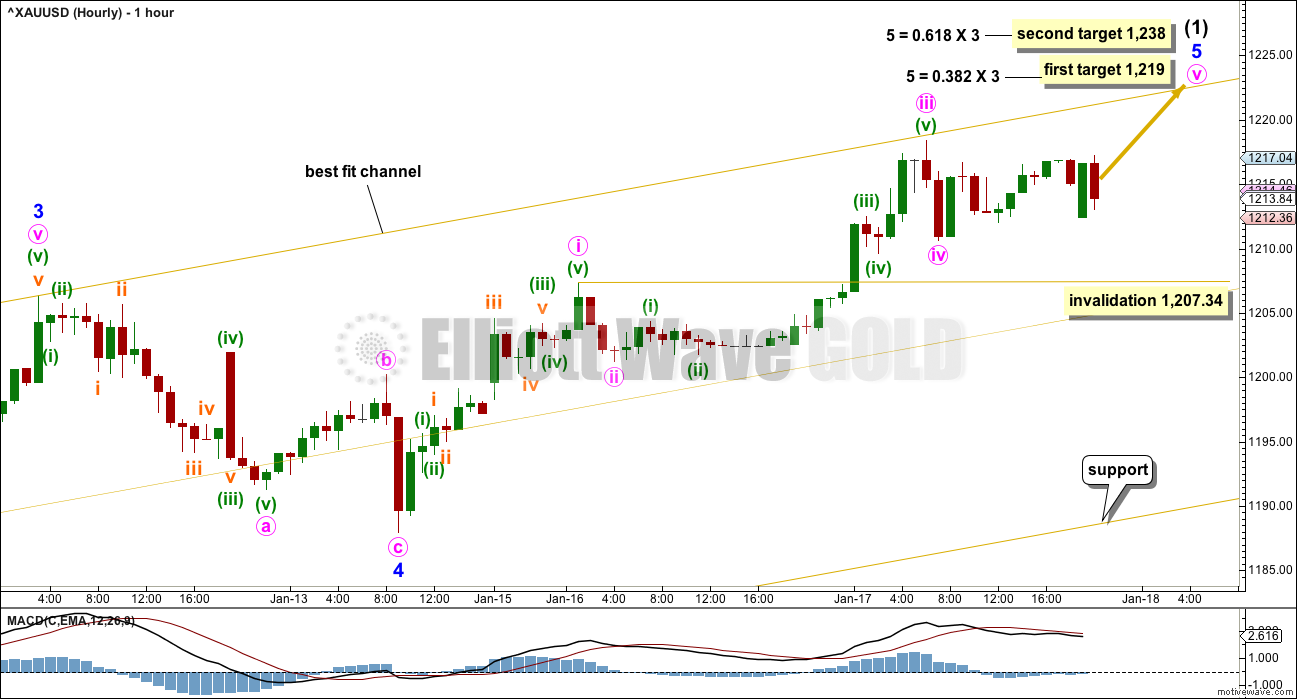
The structure of minor wave 5 is still incomplete.
Gold often exhibits swift strong fifth waves, and in a bull market these are seen as blow off tops. Look out for this tendency for the end of minute wave v.
The first target now again looks too low. The second target may have a higher probability, especially if minute wave v is swift and strong.
Minute wave iv, if it continues, may not move into minute wave i price territory below 1,207.34.
The best fit channel is redrawn, as shown on the daily chart, and a mid line is added here on the hourly chart. Price may remain in the upper half while minute wave v ends. If price moves into the lower half of the channel, then the probability of an end to intermediate wave (1) would increase. If price breaks below the lower edge of the channel, then expect that intermediate wave (1) is finally over and intermediate wave (2) has begun.
So far intermediate wave (1) has lasted 24 sessions. The next Fibonacci number in the sequence is 34, which would see it continue for two more weeks, another 10 sessions. This is possible, or it may not exhibit a Fibonacci duration and end sooner.
ALTERNATE ELLIOTT WAVE COUNT
DAILY CHART
Click chart to enlarge.
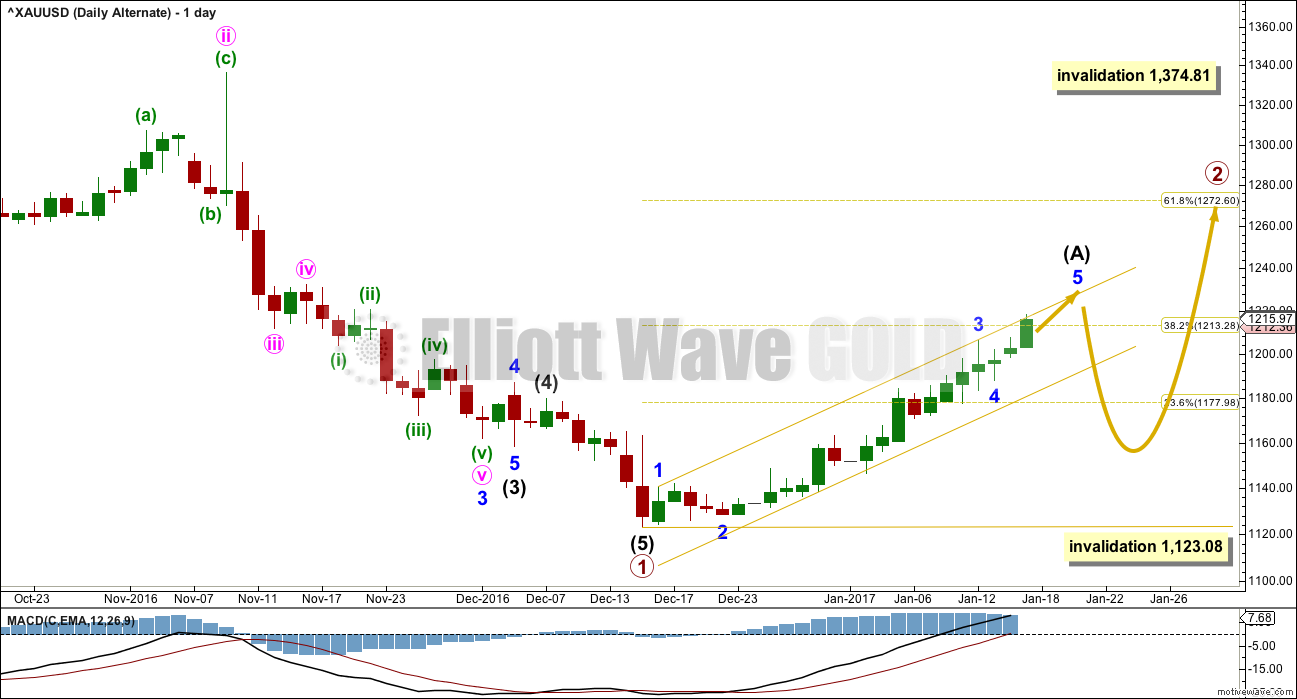
This alternate wave count expects that Gold is still within a bear market. Targets for new lows can be seen on weekly and monthly charts.
Within the bear market, a primary degree correction is underway.
Primary wave 2 is most likely to subdivide as a zigzag. So far it looks like a five up is either complete now or very close to completion. This may be intermediate wave (A). Intermediate wave (A) may now be complete lasting a total Fibonacci 21 sessions.
It is also possible to move the degree of labelling all down one degree within upwards movement for intermediate wave (A). It is possible that only minor wave 1 within intermediate wave (A) is complete. Either way the invalidation point remains the same. If a five up is complete, then the following three down may not move beyond its start below 1,123.08.
Primary wave 2 may not move beyond the start of primary wave 1 above 1,374.81.
TECHNICAL ANALYSIS
WEEKLY CHART
Click chart to enlarge. Chart courtesy of StockCharts.com.
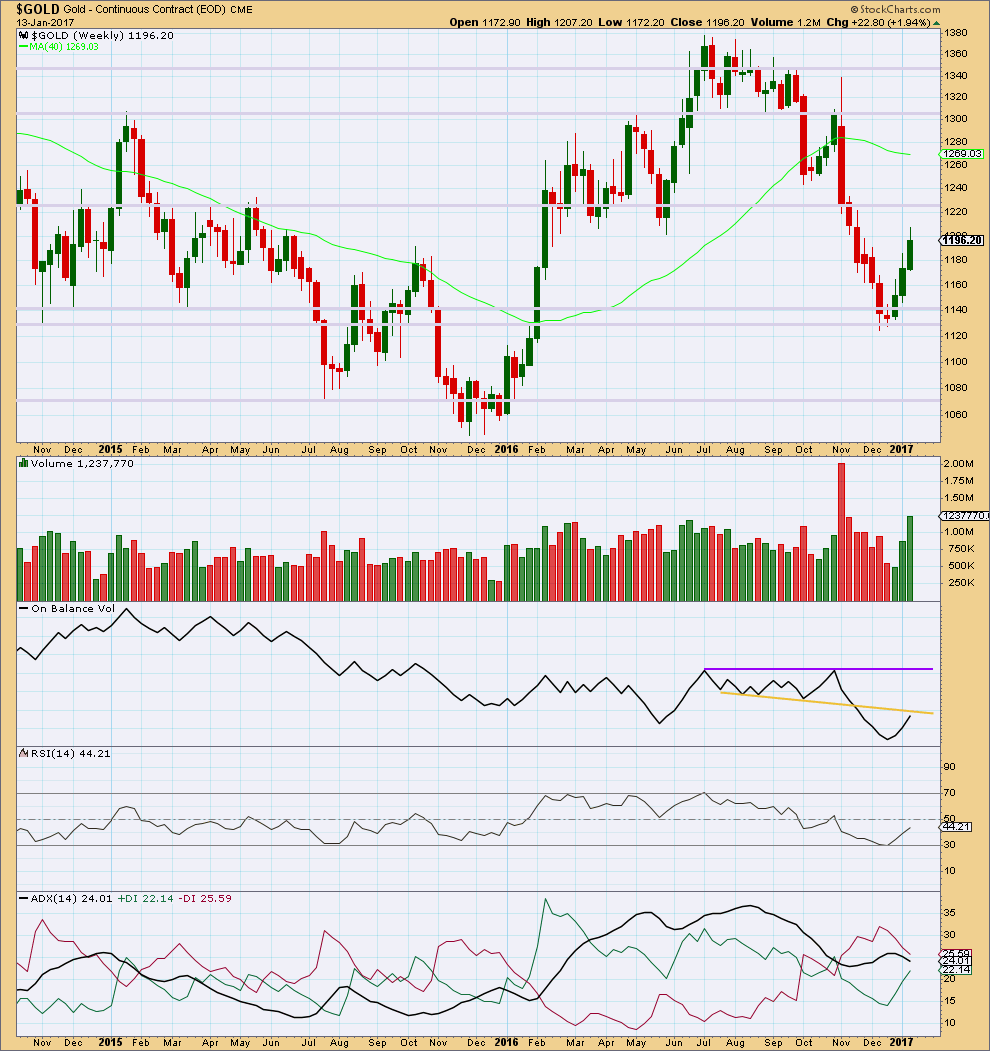
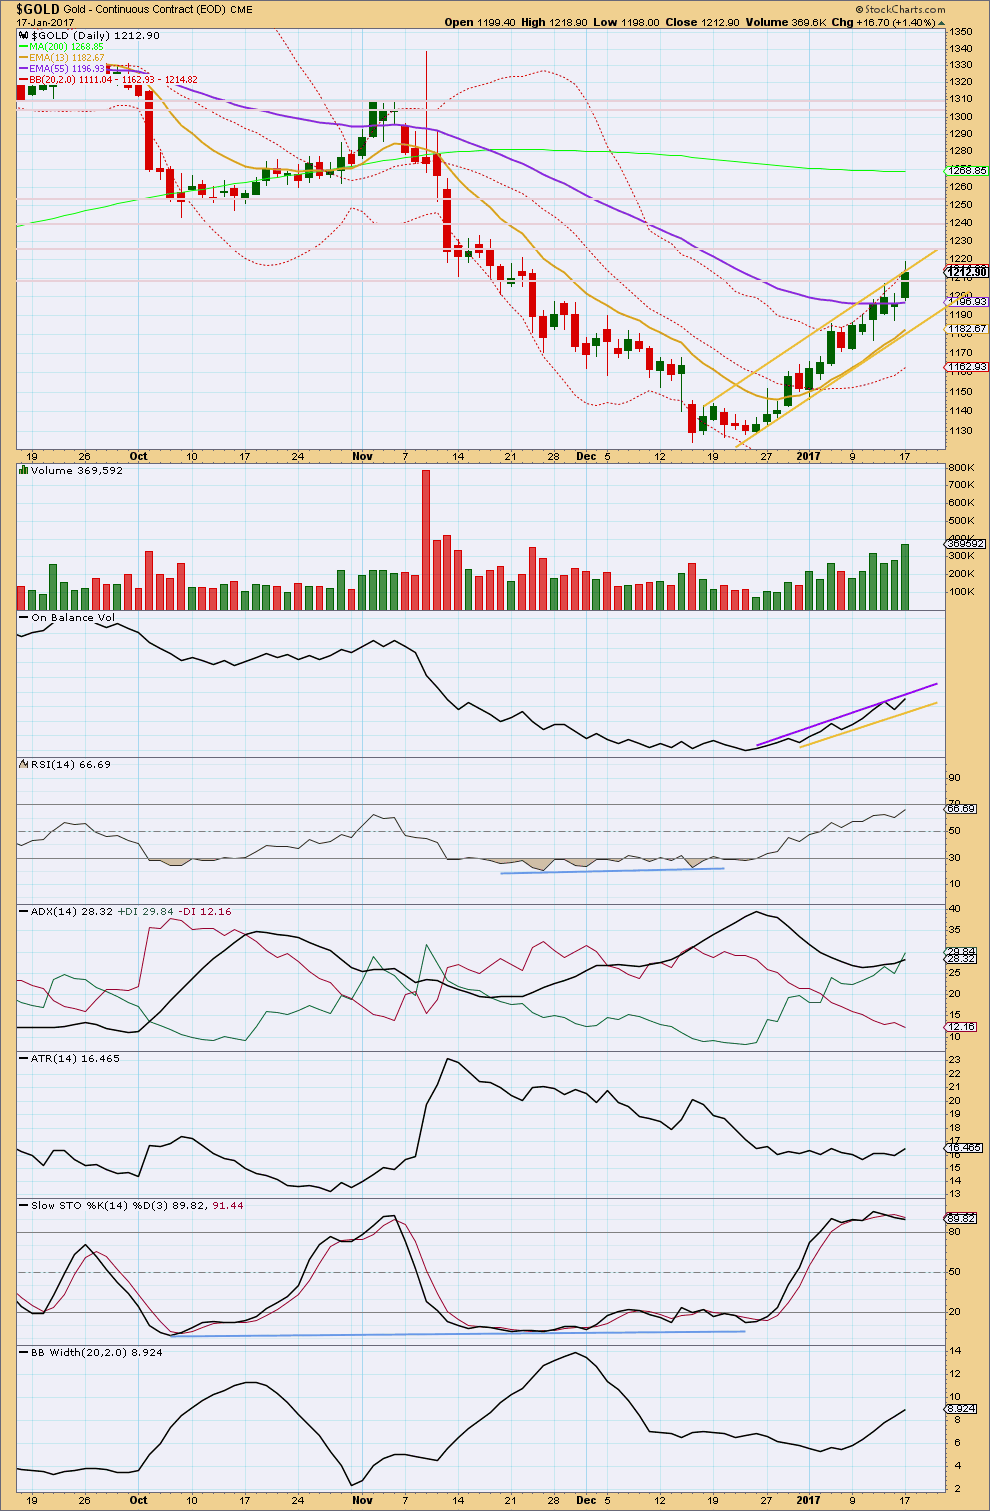
Gold has moved higher for three weeks in a row on increasing volume. The rise in price is well supported by volume. This upwards movement looks healthy.
A Morning Star candlestick pattern at the last low indicates a possible trend change there.
Next resistance is about 1,225.
On Balance Volume may provide resistance before that price point is reached though. It is coming up to almost touch the yellow trend line that previously provided support. However, there is some leeway in exactly how this line may be drawn, so it is not possible to tell with accuracy exactly where resistance is. It may be here or it may be just a little higher.
RSI shows increasing strength to upwards movement.
ADX does not yet indicate a trend change (this is a lagging indicator). The black ADX line is declining, indicating only a consolidation. The -DX line remains above the +DX line. No trend change is yet indicated at this time frame.
DAILY CHART
Click chart to enlarge. Chart courtesy of StockCharts.com.
Price continues to move higher finding resistance at the upper gold trend line. Price has today closed above the horizontal resistance line about 1,210. After looking left back three years, three more horizontal lines are added. Next resistance may be about 1,225, then 1,240, then 1,250. Thereafter, there is very strong resistance about 1,305 to 1,310.
Price has just crossed the mid term Fibonacci 55 day moving average. This mid term average looks like it may be turning upwards. It may now offer support.
Volume strongly supports the rise in price, but there has been no blowoff top yet to indicate an end to this trend.
On Balance Volume is bullish. Trend lines are adjusted.
ADX is increasing, indicating the market is trending; the trend is up. The trend is not yet extreme as ADX is below 35 and is below one of the directional lines. There is room for this trend to continue.
ATR is overall flat while this trend continues. This is normal for the first wave within Gold’s trends, and also for a counter trend movement. It is impossible still to tell which situation is occurring here.
Stochastics is overbought and today exhibits divergence with price. However, this oscillator may remain extreme for reasonable periods of time during a trending market and may exhibit sustained and multiple divergence before price turns. I would not expect this trend to end here because Stochastics is overbought.
Bollinger Bands are widening as volatility returns during this trend. This looks normal. Bollinger Bands are not yet extreme. There is room for the trend to increase volatility further. Price is at the upper edge of Bollinger Bands, but during Gold’s trends this can persist for reasonable periods of time. Example: from 10th to 25th November, 2016, price sat at the lower edge of Bollinger Bands with only three days moving sideways or higher within that trend.
GDX DAILY CHART
Click chart to enlarge. Chart courtesy of StockCharts.com.
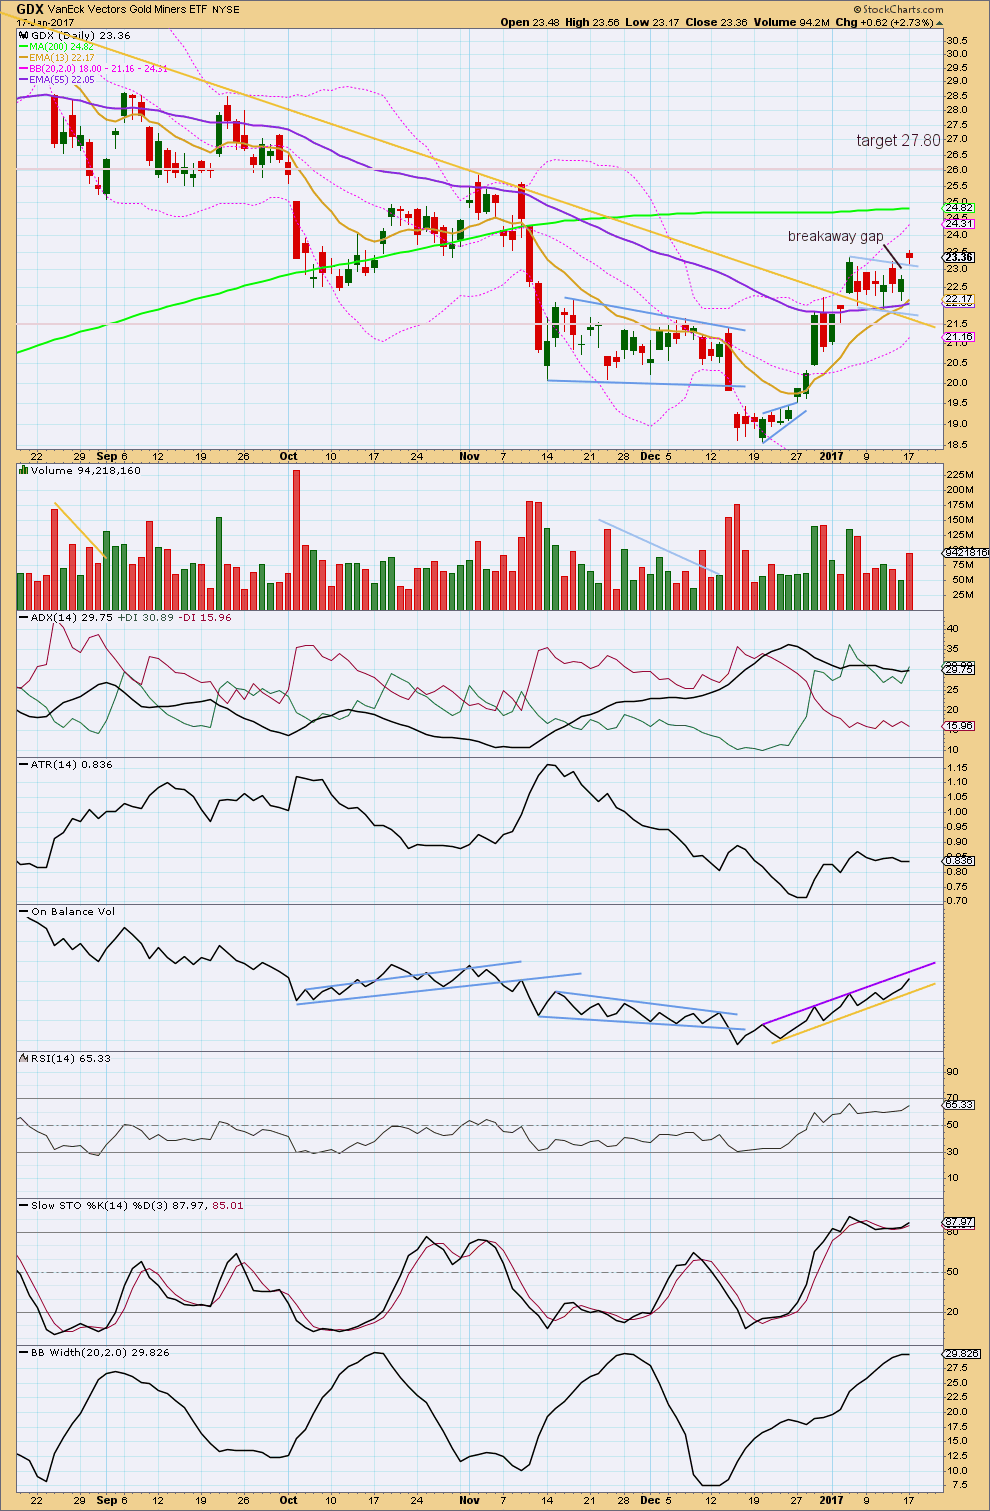
GDX today broke above the bull flag pattern. Price gapped up above the pattern, which has now provided support. With strong volume, the balance of which was up for the session, this looks like a classic breakout. The breakaway gap may offer support now.
The trend for GDX is up. ADX today is increasing and the +DX line is above the -DX line. All three moving averages are pointing up. The short term average crossed above the mid term average today.
The target using the measured rule for the flag pattern is now calculated at 27.80. This would fit with the second higher target for Gold.
ATR is now overall flat; this may be a lag from the flag pattern. ATR may now be expected to show some increase.
On Balance Volume is bullish and remains constrained. A break below support may indicate a deeper correction has arrived, but first if OBV comes down to the yellow line expect it to provide support.
After looking left for a period of three years, two more horizontal resistance lines are added. Next resistance may be about 25.00. Thereafter about 26.10.
RSI is bullish and is not yet overbought. There is room for price to rise.
Stochastics is overbought and exhibits single divergence today with price. However, this can develop further as Stochastics can remain extreme for reasonable periods of time during a trending market. This alone is not enough to signal the end to this trend.
Bollinger Bands are now extreme though. The target calculated by the measured rule looks too optimistic for GDX. This may mean that the second higher target for Gold may also be too optimistic.
This analysis is published @ 09:02 p.m. EST.
This will be an alternate today while price remains above 1,187.97.
The main wave count will move everything in minor 5 down one degree, this downwards movement today may be a correction for minute ii within minor 5.
We should assume the trend remains the same, until proven otherwise. The bottom line is still that while price remains within the gold channel and above the confidence point we should assume that the upward trend is intact.
Watch carefully how price behaves when it gets to the lower gold trend line. If it slices through quickly then the probability of this wave count will substantially increase. But if it bounces up from the line it may just be a correction within the ongoing upwards trend, and that would offer another opportunity to join the trend.
Silver had a fail BO above 17.23 and now below the NL on 4 hour inv HnS.
May be Lara’s deep correction has begun.
Waiting to read today’s report.
Using PMBULL, gold fell below the 1207.34 figure which Lara indicated might be the start of a larger correction.
That’s right. I reckon it is the third wave of an ABC, Lara’s Minute 4. (Possibly, my minuette 2).
Falling below 1207.34 would mean that Minute 4 has entered into Minute 1 territory. Minor 5 had to be an ED as I alluded. Hopefully Lara can draw the trendlines for that. I have difficulty doing so.
If the fall drops below 1201.20, then my model is invalidated. Minor 5 has most likely ended.
An ending diagonal doesn’t work, the rule regarding wave lengths cannot be met. Minute i would be 19.37 long, minute iii shorter at 17.23 indicating a contracting diagonal.
But now minute iv would be much much longer than minute ii, indicating an expanding diagonal.
So it can be neither.
My conclusion is that my labelling of minor 5 may have been wrong, it may be over, this may be the start of the deep correction I was looking for.
I think so. There was some above the upper BB cavorting in quite a few charts and while extremes have of late been persisting for longer than usual, it may be that the upper BB penetration, actually the third in the last few days, was signaling third and fifth waves completing.
Hi Alan, I think minor 4 finished at 1177 area – otherwise this minute 4 looks way out of proportion to the rest of this 5th wave.
Hi Nick. That is a possibility.
Lara had thought so two or three posts ago. She had changed it in preference to 1187.97 recently. That makes Minor 3 longer in duration, which is normal.
My thinking is that Minor 5 is going to be extended, just like Minor 3. So far, only Minute 2 is completed, as Lara posted.
It would be a bit atypical to see multiple extensions within the same impulse I think.
The system doesn’t allow me to post the original. Perhaps it was already there.
In short, I’m just stating that the high labelled 1218.43 may only be Minuette 1 of Minute 3.
Lara.
I tried to upload a post the whole afternoon, but I git a 404 error. I’m testing to see if I can post now.
What I was trying to state is that, as labelled, Minute 3 is shorter than Minute 1, necessitating Minute 5 to be less than Minute 3. In that scenario, only the first target can be reached.
If one looks at the 4 hour chart gold has retraced to the resistance area of Nov 11 to Nov 22 trading price.
A correction here per EW may be in the cards. Price can drop to 1207-1205 to form RS of large HnS from Nov 14 to today. Lara’s invalidation level 1207.
GOT GOLD .
Hi Papudi. 1207.34 is the invalidation for Lara’s Minute 4. Once price reaches the end point of Intermediate 1, that no longer applies. I’m expecting a much deeper correction than this, 0.618 of Intermediate 1 or even higher.
By the way, price has dropped lower than the point labelled Minute 4. If you look at my posts, I expect that to be only Minuette 2 of Minute 3. If correct, the next move up will be fairly strong, a third of a third.
Thanks Alan,
” a third of a third.” is a very strong wave. Normally the strongest of all.
What is the target for wave 2 ? 0.618 of Int (1) – 1159??
Papudi.
Agreed. Actual value, of course, depends on where Intermediate 1 ends.
Trump is waving adios to the longstanding ‘strong dollar policy’
http://www.marketwatch.com/story/trump-is-waving-adios-to-the-longstanding-strong-dollar-policy-2017-01-17
That is the right thing to do. A strong dollar is stifling American companies. Their products are selling at a disadvantage compared to countries with cheaper currencies.
The question is will the currency market do what Trump wants to do? Too early to tell.