
Upwards movement was expected for Monday’s session.
The target on the hourly Elliott wave count is not yet met, so the analysis today will focus on whether or not this bounce is complete.
Summary: It looks more likely that the bounce is complete today and a third wave down may begin from here. If price makes a new high above 1,199.23, then the bounce is not over; the target is at 1,205.
New updates to this analysis are in bold.
Last monthly and weekly charts are here. Last historic analysis video is here.
Grand SuperCycle analysis is here.
MAIN ELLIOTT WAVE COUNT
DAILY CHART
Click chart to enlarge.
This main wave count has a better fit for prior movement. To see the difference between this main wave count and the alternate below please refer to last historic analysis linked to above.
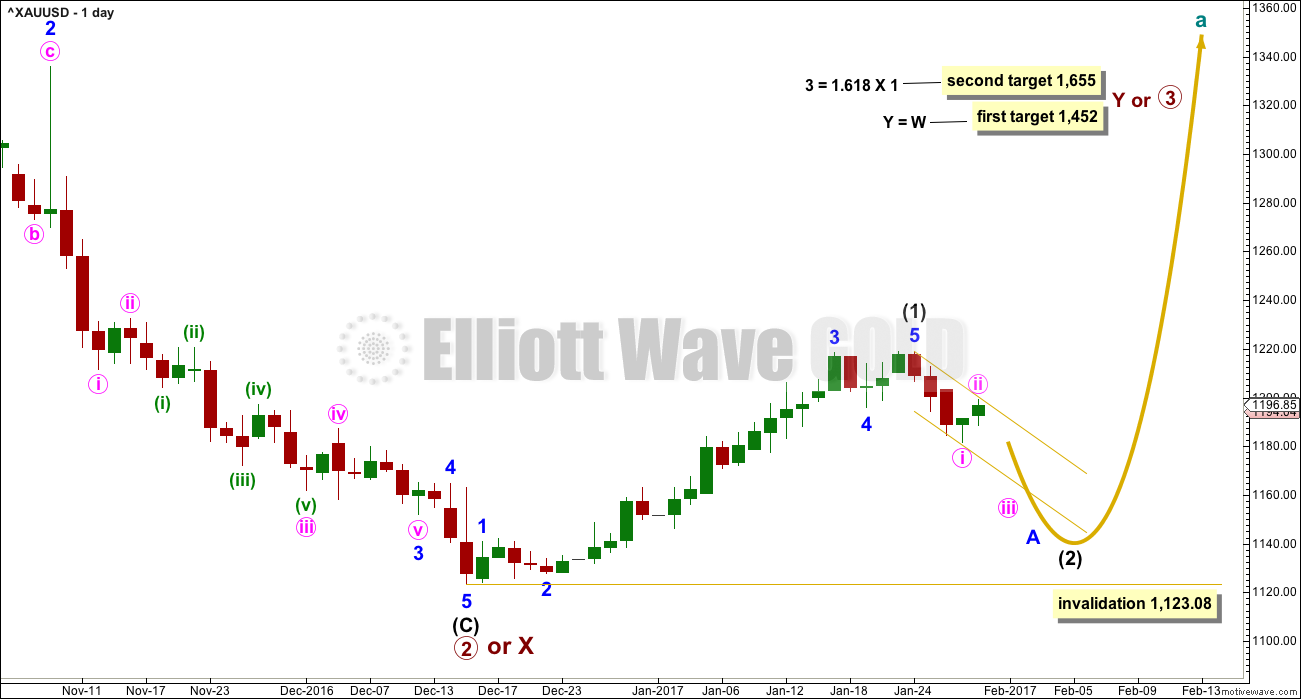
This main wave count expects Gold has had a primary degree trend change in December 2016. The new upwards wave is either a primary degree third wave, or a primary degree zigzag to complete a double zigzag.
Intermediate wave (1) lasted 30 days. Intermediate wave (2) may be about even in duration (it may last a Fibonacci 34 days), or it may be longer lasting because corrections are often more time consuming than the impulses they correct. If it does not end in a total Fibonacci 34 days, then the next Fibonacci number in the sequence is 55.
At this stage, intermediate wave (1) has completed a five down and a three up. This is labelled minute waves i and ii rather than minor waves A and B. Because intermediate wave (1) so far has lasted only four days and is expected to last close to 30 days in total (if not longer), then it looks premature to move the degree of labelling within this correction up one degree.
The first in a series of second wave corrections for Gold’s new impulses is usually very deep. Intermediate wave (2) is expected to be at least 0.618 the depth of intermediate wave (1), and very likely may be deeper. It may not move beyond the start of intermediate wave (1) below 1,123.08.
HOURLY CHART
Click chart to enlarge.
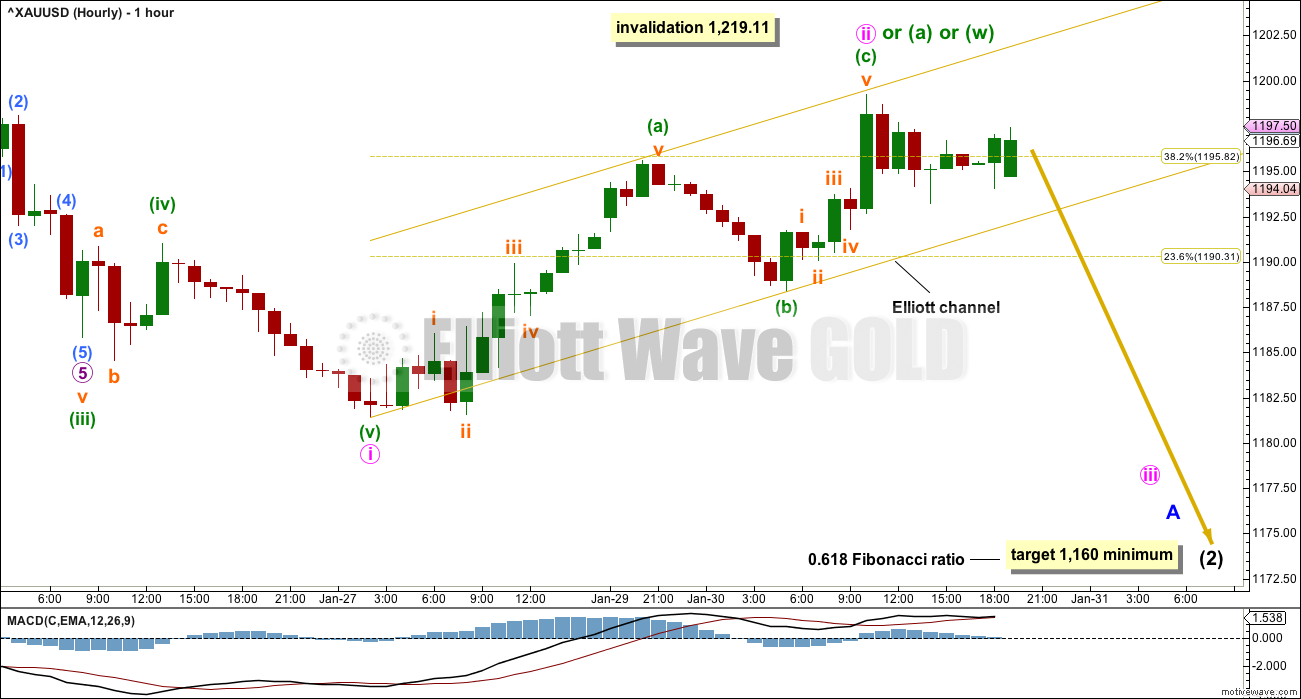
A movement at intermediate degree should begin with a five down at the hourly chart level. This is now complete.
Minute wave ii may not move beyond the start of minute wave i above 1,219.11.
Minute wave ii so far subdivides perfectly as a zigzag. This looks most likely to be the entirety of the correction, but it must be accepted that it could continue higher. This may also be only minuette wave (a) of a larger flat correction, or minuette wave (w) being the first zigzag in a double zigzag. Classic technical analysis today favours the view that this correction is over.
The next wave down looks most likely to be be minute wave iii. It should show an increase in downwards momentum over the next one to three days.
Watch price behaviour carefully when it gets down to the lower edge of the Elliott channel. If price slices easily through this channel, then the probability that minute wave ii is over and minute wave iii is underway would be very high. If price finds support and bounces up from the lower edge of the channel, then the probability that minute wave ii is continuing would increase.
The target of 1,160 for intermediate wave (2) is a minimum. It is fairly likely to be deeper than the 0.618 Fibonacci ratio of intermediate wave (1). Within intermediate wave (2), when it arrives minor wave B should be a reasonable upwards or sideways movement. At that stage, it would be wisest to exit this market and wait patiently for minor wave C downwards to arrive. B waves do not present good trading opportunities.
ALTERNATE ELLIOTT WAVE COUNT
DAILY CHART
Click chart to enlarge.
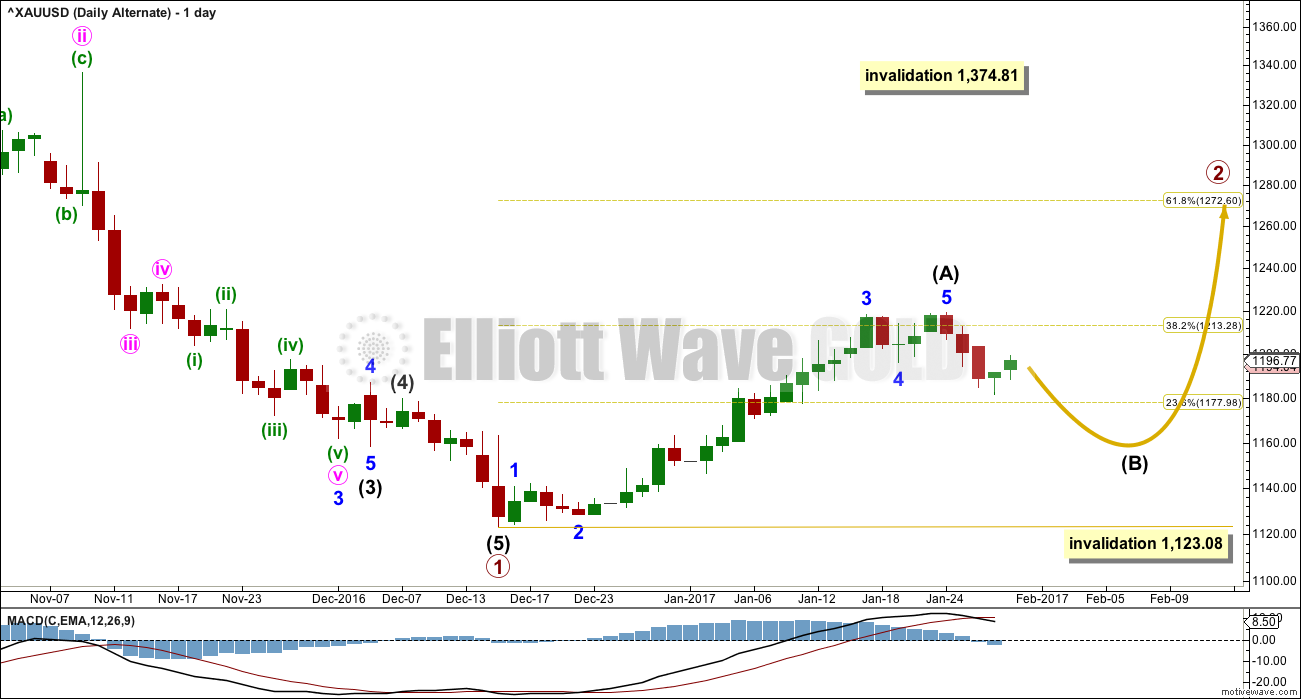
This alternate wave count expects that Gold is still within a bear market. Targets for new lows can be seen on weekly and monthly charts.
Within the bear market, a primary degree correction is underway.
Primary wave 2 is most likely to subdivide as a zigzag. Intermediate wave (A) is complete and a correction for intermediate wave (B) has begun.
Intermediate wave (B) may not move beyond the start of intermediate wave (A) below 1,123.08.
Primary wave 2 may not move beyond the start of primary wave 1 above 1,374.81.
TECHNICAL ANALYSIS
WEEKLY CHART
Click chart to enlarge. Chart courtesy of StockCharts.com.
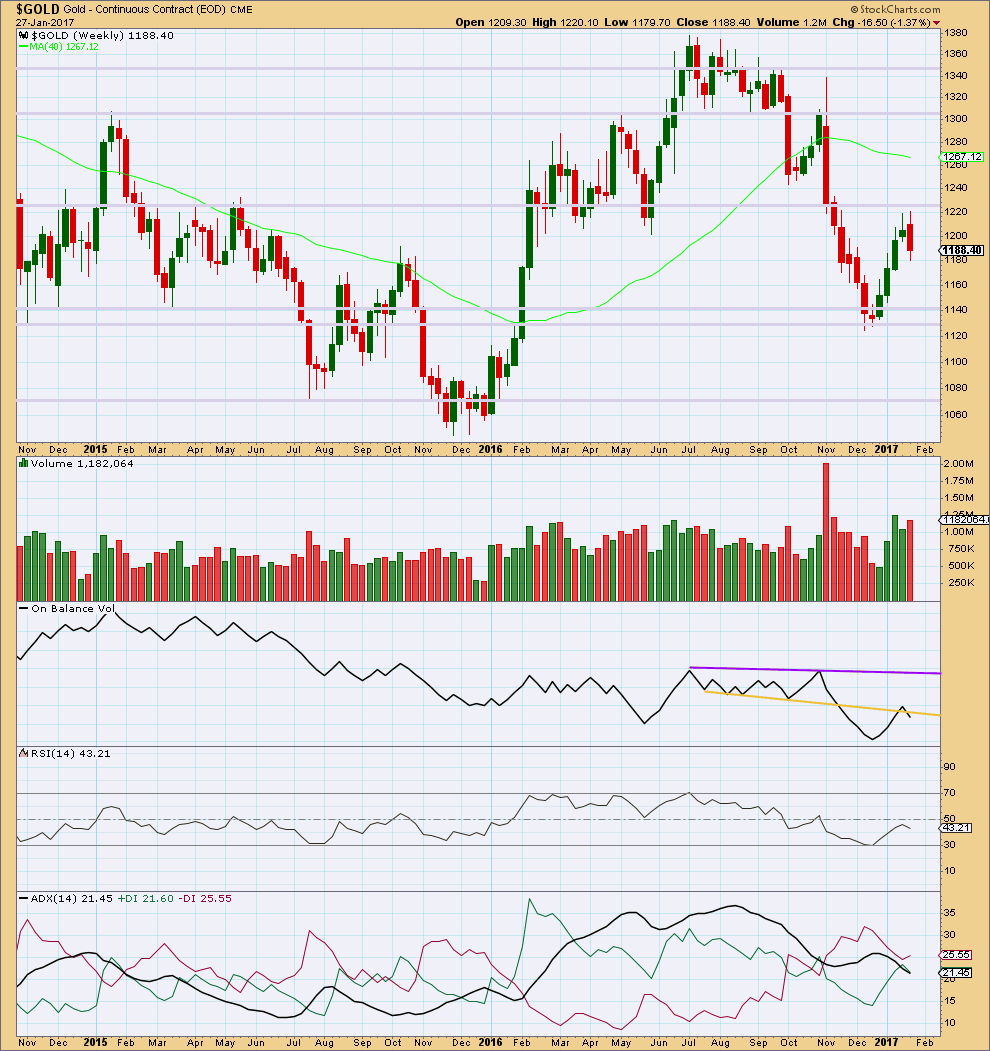
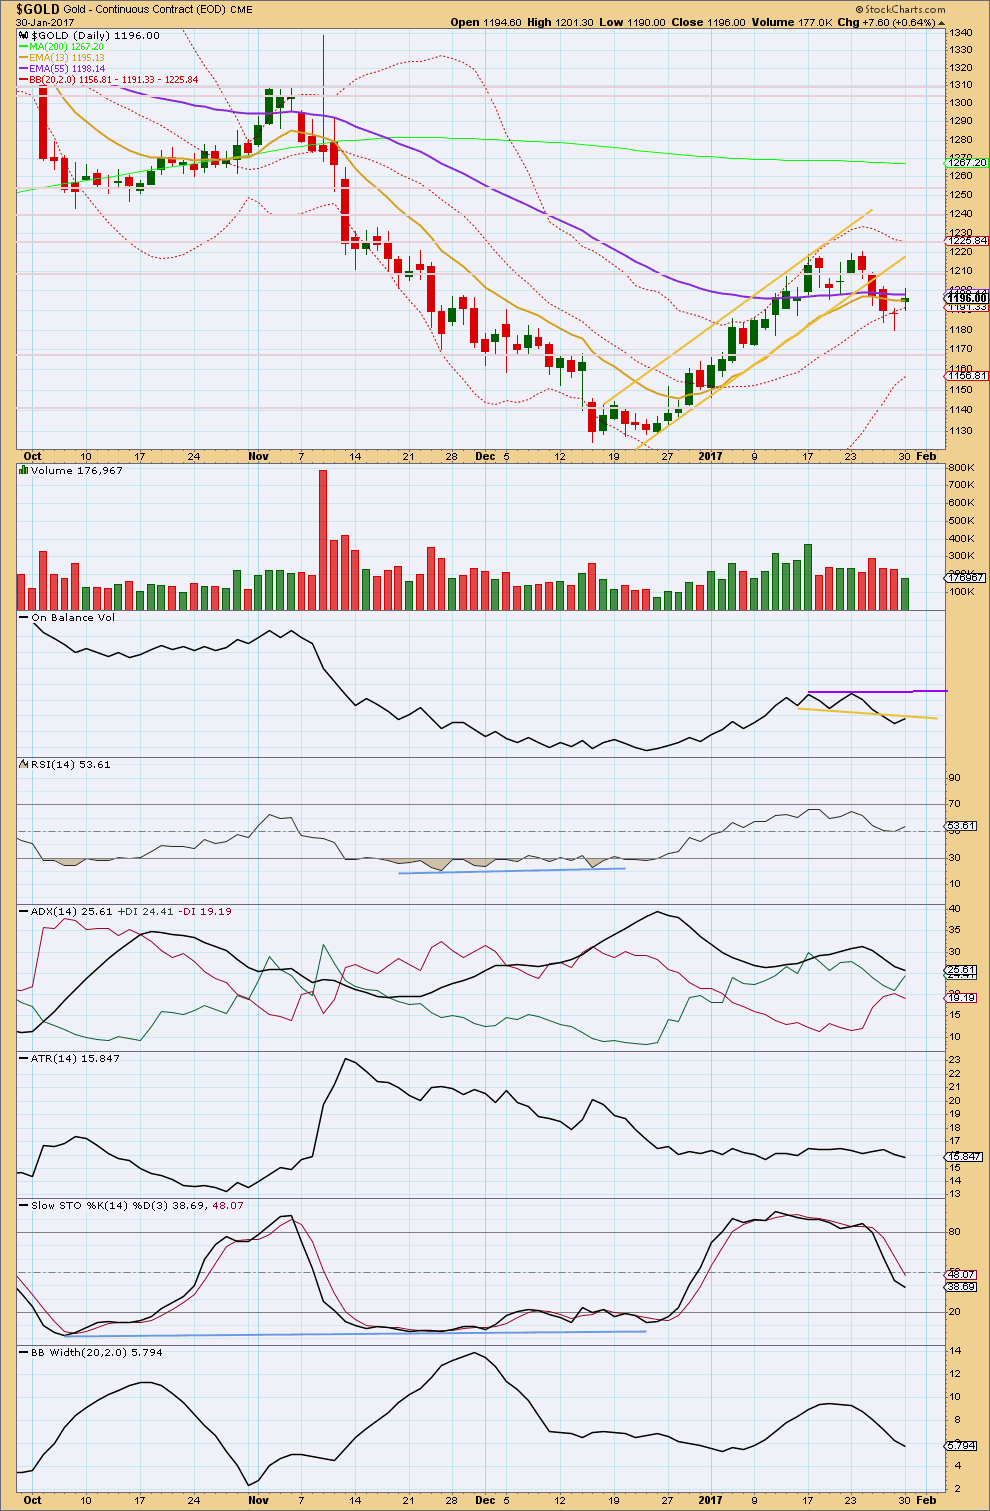
Last week completes a bearish engulfing candlestick pattern. This is the most reliable reversal pattern. It is supported by an increase in volume from the prior week. Price has found strong resistance about 1,220.
On Balance Volume gives a weak bearish signal last week with a break below the yellow line. The signal is weak because the line has been broken before.
At the weekly chart level, ADX indicates no clear trend.
DAILY CHART
Click chart to enlarge. Chart courtesy of StockCharts.com.
A small range upwards day completes with a decline in volume. The rise in price is not supported by volume and that may indicate this is a small counter trend movement, which may now be complete.
On Balance Volume has turned up to touch the yellow line. This may assist to halt the rise in price here; it may offer resistance.
RSI is not extreme. There is plenty of room for price to rise or fall.
ADX is still declining, indicating the market is not trending; it is consolidating. ADX has not yet indicated a trend change from the prior upwards trend, only a consolidation.
ATR is flat to declining in support of ADX.
Stochastics reached overbought while price reached resistance, and there exhibited divergence. Now Stochastics is returning from overbought and price is moving lower. Downwards movement may be expected to continue within a range bound market and only end when price finds support and Stochastics reaches oversold. Next support for price is about 1,170, then about 1,140.
Price has found some support about the mid line of Bollinger Bands. If it breaks through to the lower half of the Bollinger Band range, then it may be expected to find support about the lower edge of the range.
GDX DAILY CHART
Click chart to enlarge. Chart courtesy of StockCharts.com.
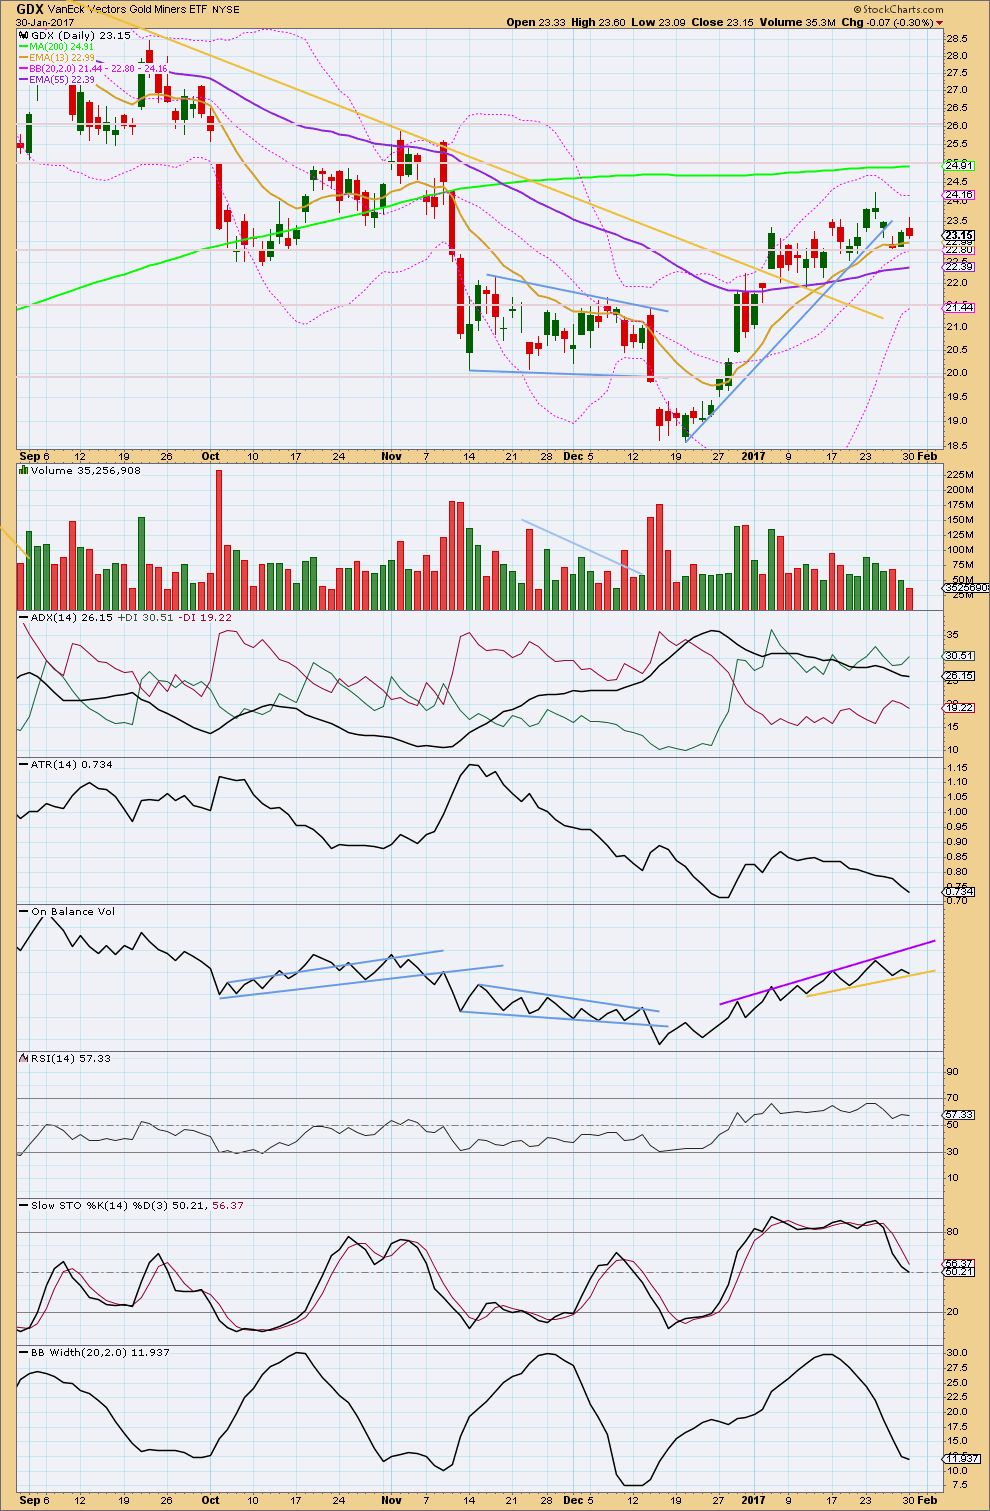
Price moved higher today for GDX with a higher high and a higher low. But the session closed red, and the balance of volume during the session was downwards.
GDX is range bound with resistance about 22.80 to 24.25, and support about 22.55 to 22.00. Stochastics is returning from oversold and price is returning from resistance. Overall downwards movement may be expected until price finds support and Stochastics is oversold at the same time.
Volume is declining as price moves overall sideways, which is typical of a consolidation.
ADX shows a further small decline today. It still indicates GDX is consolidating. ATR continues to decline also in agreement.
On Balance Volume is today at support. A break below the yellow line would be a bearish signal for GDX.
Bollinger Bands have contracted as price moves sideways, also supporting the idea that GDX is currently consolidating.
During the consolidation, it is the first downwards day of the 6th of January and the next downwards day of the 17th of January, 2016, that have the strongest volume. This suggests a downwards breakout may be more likely than upwards. This is in line with the analysis for Gold.
This analysis is published @ 08:11 p.m. EST.
Hi Lara,
thank you very much for your diligent work:) Would it be possible to do USD/CAD? As over all it seams to go in the oposit direction to Oil. Hence interesting for the once trading Oil.
Thanks
Lara and David,
Based on David’s chart below.. Is there any validity to the idea that we may actually be in 5 of Intermediate (1) and that 4 of (1) ended on 27JAN rather than 19JAN? Does it break and Elliott rules and if not, does it make sense to consider as a possibility?
Thomas
Thomas,
If you look @ my 10:25am post w/chart, this is one of the counts Arkady suggests.
It is his 1st ALT: in blue… (i). The only issue with this idea is that the 4th wave is very large compared to 2nd wave. This may be why Lara does not consider this possibility.
I am wondering if we are still in correction of (ii) of (2), but (ii) may take it to the extreme of 1218 to 1220ish, another words, almost 100% retrace of (1) (depending on chart one follows) before turning down?? Of course we have the FED tomorrow.
Perhaps Lara will comment on our thoughts tonight.
Hi..thank you. i’ll wait to hear what Lara says then. Definitely interesting wave developments…way beyond my level of understanding at this point.
Oh..listened to the pod cast.. lots of interesting info to consider..thanks again!
Hi Lara,
In reference to Jan 30 eve update, under Main Dly wv count, you say…
“At this stage, intermediate wave (1) has completed a five down and a three up. This is labelled minute waves i and ii rather than minor waves A and B. Because intermediate wave (1) so far has lasted only four days and is expected to last close to 30 days in total (if not longer), then it looks premature to move the degree of labeling within this correction up one degree.”
Did you mean to refer to Intermediate wave (2) in above description, or am I just simply not understanding your description of the count?
In your 1:24pm comment below you again refer to your expectation of Intermediate (1) lasting a Fib 21, 34 o 55 days. Do you mean to say Intermediate (2)?
I’m a bit confused…thanks..
Melanie,
In reading the non bold paragraphs before and after the one you cite, I would gather that Lara meant Intermediate (2) instead of (1). The 5 down and 3 up would refer to Intermediate (2) which we currently would be in based on the labeling. The 3 up in this wave, I think would finish as circle ii.
I hope I’m not creating more confusion.
Thanks…Thomas and Verne…
I was reading last nights commentary and thought that it had to be a typo.
Apparently her comment this afternoon is about wave (2), not (1). (Mr. Proofer must be away from his desk (:
You may want to take a listen to Tim Wood’s audio on Howe Street. He cover cycles in Gold, Equities and Crude and Commodities in general.
http://www.howestreet.com/author/tim-wood/
Thanks, I’ll listen to it!
So sorry everybody, Thomas is right, I mean intermediate (2).
Cesar did proof, but we both missed that typo. Will fix and make much clearer today.
In short, intermediate (2) has only just begun, it should not be even approaching halfway through because it should be expected to be in proportion to intermediate wave (1).
So I wouldn’t want to label it minor wave A down complete and minor B up completing.
You are both right. I saw that and meant to shoot Lara and e-mail but figured folk would figure out what she meant…as you clearly have…. 🙂
Thanks Verne..that’s a relief.
I was curious about what the banksters would do to try and muck up a clear wave count and now we know. I think Lara’s original count of intermediate one complete is correct, and this relatively low volume counter-trend move is a second wave morphing into a more complex wave to keep short-side traders off balance…but that is just me! 🙂
Lara’s count on the Euro was right on the money and my proposed ED was not.
I am curious as to whether they correlation with Gold and the market will continue and that a down-turn in Euro and the metals necessarily implies a reversal of the current market down-trend. Nothing can be safely assumed these days it would appear, although Lara was again right in thinking either her Gold or SPX count would have to at least be modified…
I’m watching EURUSD, NZDUSD, Gold and the S&P for entry points this week.
I don’t think the fifth wave for minor C is quite done, on the hourly chart it looks like it needs just a little more. If the target is wrong it may be a bit too low, price may not turn until it touches the maroon trend line and the upper gold line again.
I’ll wait to see price break below the best fit channel. When that happens I’ll enter short.
I need to do something extra here on EWG today, maybe I’ll do EURUSD for members.
ATR for this upwards movement is now about even with the strongest ATR in the prior downwards movement.
There is some concern (David points this out below) that I share that this upwards movement is looking strong. But on checking ATR we can see it is the same strength / range as the prior wave down. So I’m slightly less concerned now.
The last wave down still subdivides well as an impulse, but when this session is closed I’m going to take a look and see how well it fits as a zigzag. Minor A may be a flat correction.
Minute ii is now very deep. Second waves are often deep, so far this is okay. It should be over now. Maybe it’s ended with a small blowoff top?
The chart is squished up so we can see all of minute i and ii.
I’ll be giving some more thought to the degree of labelling here, but I’m still expecting intermediate (1) to be a Fibonacci 21, 34 or 55 days.
FOMC rate decision is tomorrow. 2:00 EST
Gold will move, but which direction?
I get the feeling most here are gold bears. I am no EW expert by any means but on the 60 min chart today’s move up (green circle) looks more impulsive than the move down from the 1220 high on 1/23 to the 1182 low on 1/27 (circled in red). No?
David,
I’m Bullearish most of the time. Well at least I think I am, maybe?!
Seems kind of quite on here today for how much movement there’s been in metals. I’m still waiting for more info too. But I think Lara was pretty clearly saying for us to be cautious right now, because of the uncertainty of the exact count.
I agree David, it looks like this upwards movement is stronger. The candlesticks are longer, momentum is building.
David, I’m actually bullish on Gold. I see this downwards movement from the last high I have labelled intermediate (1) as a counter trend pullback. An opportunity when it is ending to join the trend.
But the pullback is expected to be relatively long lasting, somewhat in proportion to intermediate wave (1) which lasted 30 days.
Gold retraced .382 of wave 1 at about 1182. With trump trashing the dollar and the commercials not increasing their short position on the move up from 1180 or so any move down below 1180 will be a gift, hopefully we will get one more big buying opportunity. The gold stocks are not taking off here and I would think that would have to happen for a convincing wave 3 up.
SLV not only demolished the 16.32 pivot, it blasted above its upper BB. I don’t know how much longer this move up will persist but the BB action suggests that a substantial decline in the Silver price is ahead.
Hi Verne,
Is there an inverse ETF for SLV?
Disregard, I did a google search
ZSL 2x and DSLV 3x short…perhaps there are more?
Spreads on those ETFs are usually awful and tend to make it almost impossible to benefit from the additional leverage.
Thanks…I’ll stay away from them
Probably the smart thing; especially when the main trend is in doubt. The spreads on SLV (and even some mining stocks) are much tighter and offer better chances of executing profitable trades.
Since the 1212 was broken and now we’ve seen at least 1215, does a double zig zag in this C wave need to go higher, or would the 1215 meet the requirements to call this wave complete and iii down of (2) could commence? Or are we looking at something entirely different now?
Thanks to anyone who might give some clarity!!
This chart is from free trial- Avi Gilburt’s site. Chart presented by Arkady- one of his analysts…several ideas.
1.Main Count: (ii) complete…now in (iii)
2. alt in blue: (i) Not complete…then we go down in (ii)…but to about 1200
3. ALT in Green: Bigger picture, we are in a Minor? A-B-C with B complete, now in C…up. He’s just not sure of route C up is taking.
4. Red count: Arkady still showing possible (ii), not reached yet…therefore we are still in a wv ‘b’. If 1220 proves resistance, we could turn down thru 1180 to complete wv(ii).
5. He suggests resistance @ 1220, then 1248 which could stop gold rally for wv (i), then 1440…strong resistance.
ANY thoughts?
1. This is Gold (spot)? Hourly? I can’t see on that chart.
2. He has wave A down with a triangle in the middle, which means it’s a zigzag. When A subdivides as a three the structure is a flat. But B is less than 0.9 retracement of A. So this labelling is invalid.
It’s not following Elliott wave rules.
USD/Yen unwinding is very bullish gold. I think we need a bullish gold count from here. If USD/Yen continues down, gold should soar. Breaking support today. Let’s see if this break is a real or false breakdown to stop out the weak longs.
Papudi, here is the updated 240 min Silver chart. This breakout MAY be important as it appears to be breaking above the downtrend channel that has held since July.
If this breakout holds, the gold count may be wrong. Time will tell.
Thanks Dreamer.
Your labeling of left shoulder should be on 12/11 low. OR way back in Nov low.
If silver breaks here to upside there is a symetry all the way to 18.5.
Yesterday I saw 4 hour HnS pattern.
A break out has happen. Silver target to 18 -18.5.
———————————–
January 30, 2017 at 6:45 am
Silver 4 hour chart has long HnS developed since Nov 15 2016 YTD.
If silver breaks above 17.28-17.30 a rapid upward movement to 18 to 18.5.
That fits with Lara’s wave count on hourly chart.
Updated Gold idea
As Lara stated, the gold correction could go higher. One option is an extended C wave with a possible target of about 1,212.78
This idea is out. Likely a double zigzag is forming.
Dreamer,
With the double zig zag idea, is 1212 low or high for the target?
Thanks for your great analysis!
1,212 should be it. See new chart above as it could go higher.
Will be watching today. Thanks
Looks like 1212 was broke twice now. 1214 plus so far.
Rambus on the USD, YEN, Gold
http://www.talkmarkets.com/content/us-markets/dollar-chartathon?post=120378