
Friday’s session moved price lower as expected.
A strong bounce has found resistance right at the lower edge of a trend channel. This also was expected as reasonably likely behaviour from price.
Summary: Probability has shifted back to a deep pullback beginning here. The target is at 1,148.
Follow my two Golden Rules of risk management:
1. Always use a stop.
2. Invest no more than 1-5% of equity on any one trade.
New updates to this analysis are in bold.
Last monthly and weekly charts are here. Last historic analysis video is here.
Grand SuperCycle analysis is here.
MAIN ELLIOTT WAVE COUNT
DAILY CHART
Click chart to enlarge.
This main wave count has a better fit for prior movement. To see the difference between this main wave count and the alternate below please refer to last historic analysis linked to above.
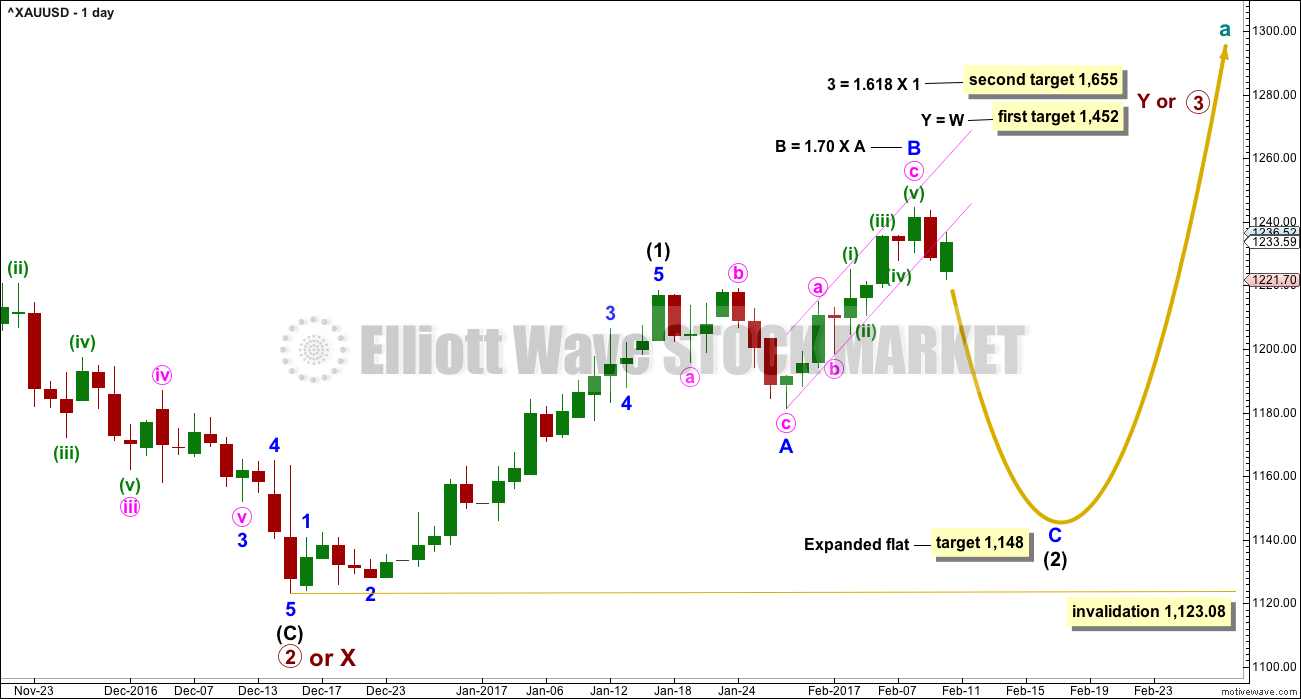
This main wave count expects Gold has had a primary degree trend change in December 2016. The new upwards wave is either a primary degree third wave, or a primary degree zigzag to complete a double zigzag.
The labelling within the end of intermediate wave (1) and the start of intermediate wave (2) is changed today. This has a better fit on the hourly chart. Intermediate wave (1) is an impulse that may have lasted 23 days, two longer than a Fibonacci 21. Intermediate wave (2) may be unfolding as a very common expanded flat correction.
Within intermediate wave (2), minor wave A fits best as a regular flat and minor wave B is a zigzag. Minor wave B is longer than the common length of 1 to 1.38 times A, but within the allowable convention of up to two times the length of A.
The appropriate target for minor wave C is 2.618 the length of minor wave A.
So far intermediate wave (2) has lasted sixteen sessions. Minor waves A and B have lasted a Fibonacci eight sessions each. If intermediate wave (2) exhibits a Fibonacci duration, it may be either a total 21 or 34 sessions; 21 is possible but may be too quick, so 34 looks more likely.
Alternatively, intermediate wave (2) may not exhibit a Fibonacci duration.
HOURLY CHART
Click chart to enlarge.
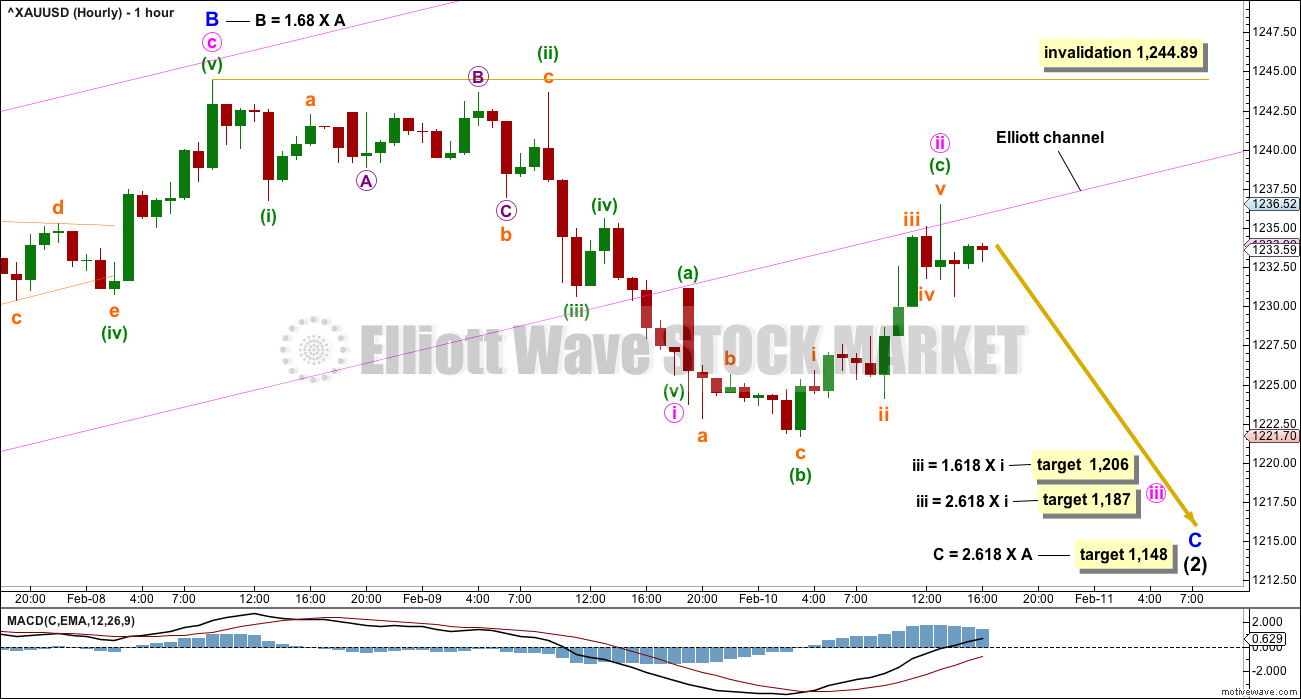
Minute wave i fits as an impulse.
Minute wave ii fits as a completed expanded flat and the subdivisions have a good fit on the five minute chart.
Minute wave ii may be over here, or it may still continue higher if minuette wave (c) within it extends. If it is over here, then it is just short of the 0.618 Fibonacci ratio of minute wave i. So far minute wave ii is 0.58 the depth of minute wave i.
Minute wave ii has come up to find resistance at the lower edge of the Elliott channel. This is typical behaviour of price.
The risk here to short positions is at 1,244.89. Stops should be set just above this point; allow the market room to move, allow a little extra for widening brokerage spreads in times of high volatility.
If price behaves as expected and moves downwards on Monday, then move stops to breakeven to eliminate risk. The next wave down should be a third wave if this wave count is correct.
Two targets are provided for minute wave iii. If price gets to the first target and the structure is incomplete, or if price keeps falling through the first target, then use the second target.
Once there is some downwards movement to draw a channel around, then a channel may be used to show where price may find support and resistance along the way down. A resistance line may be used to add to short positions.
Any members entering short here must accept the possibility that this wave count is wrong. This wave count would be invalidated above 1,244.89. Minute wave ii may not move beyond the start of minute wave i.
ALTERNATE ELLIOTT WAVE COUNT
DAILY CHART
Click chart to enlarge.
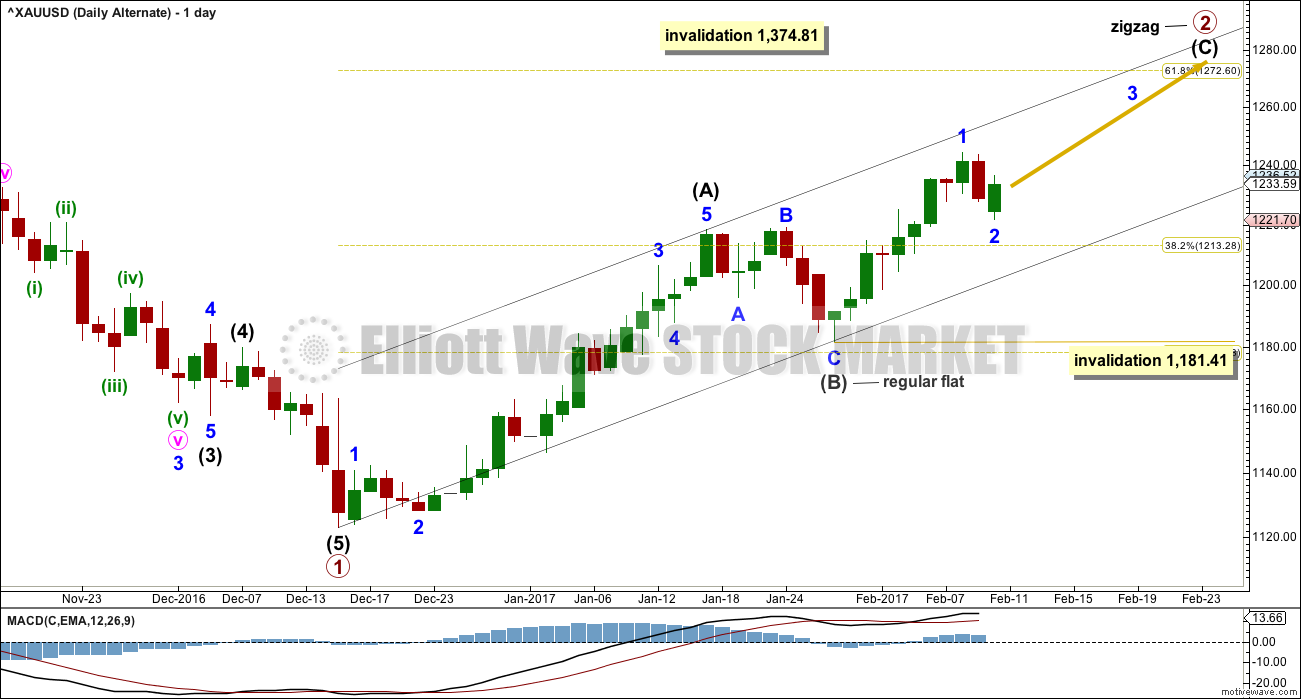
This alternate wave count expects that Gold is still within a bear market. Targets for new lows can be seen on weekly and monthly charts.
Within the bear market, a primary degree correction is underway.
Primary wave 2 is most likely to subdivide as a zigzag. Intermediate wave (A) is complete.
The alternate idea today reverts back to seeing the correction here labelled intermediate wave (B) (and for the main wave count it would be labelled intermediate wave (2) ) as a complete regular flat.
The next five up, for this alternate labelled intermediate wave (C) (and for the main wave count labelled intermediate wave (3) ), may have begun.
Within the impulse upwards, a first wave labelled minor wave 1 may now be complete. Minor wave 2 may not move beyond the start of minor wave 1 below 1,181.41.
Primary wave 2 may not move beyond the start of primary wave 1 above 1,374.81.
HOURLY CHART
Click chart to enlarge.
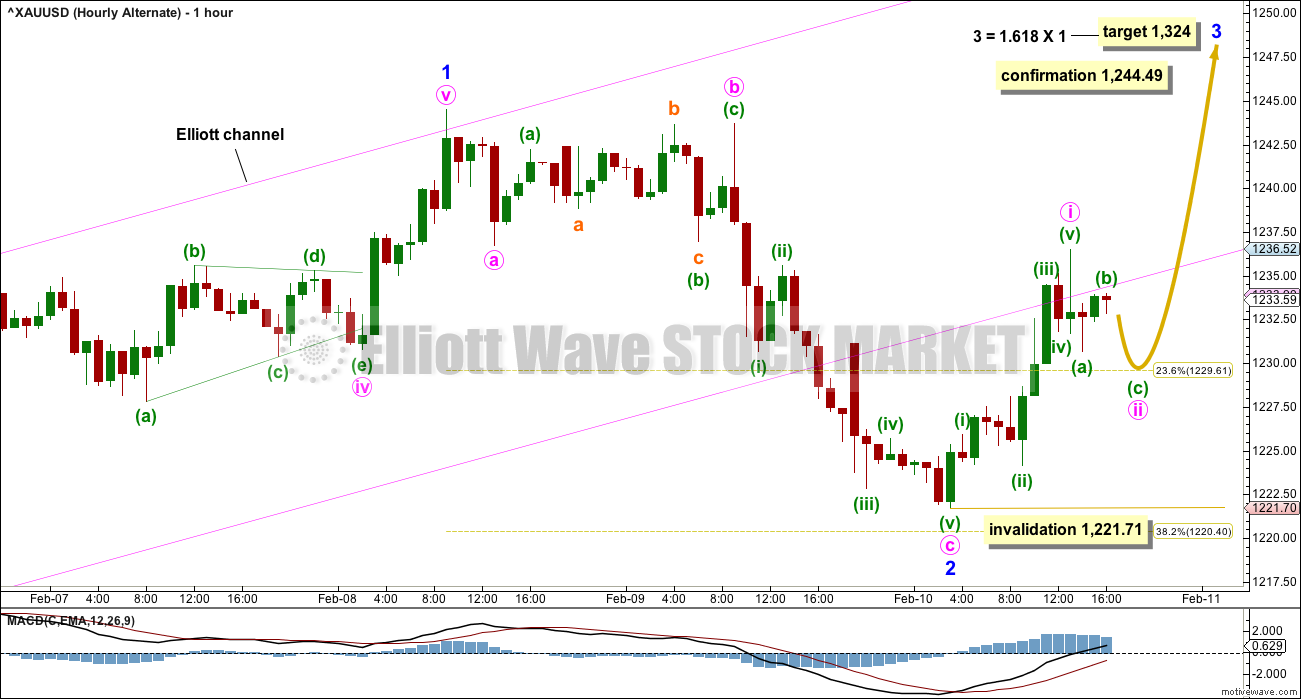
What if downwards movement for Friday’s session is a completed three?
Minor wave 2 may be over as a relatively brief shallow zigzag, and as labelled it does look better as a three than as a five. This fits with this wave count.
However, there is still the problem (shown on yesterday’s alternate hourly chart) within minor wave 1, so this still reduces the probability of this alternate wave count.
Within minor wave 3, no second wave correction may move beyond the start of its first wave below 1,221.71.
If price makes a new high above 1,244.49, then the main wave count would be invalidated and this alternate confirmed.
TECHNICAL ANALYSIS
WEEKLY CHART
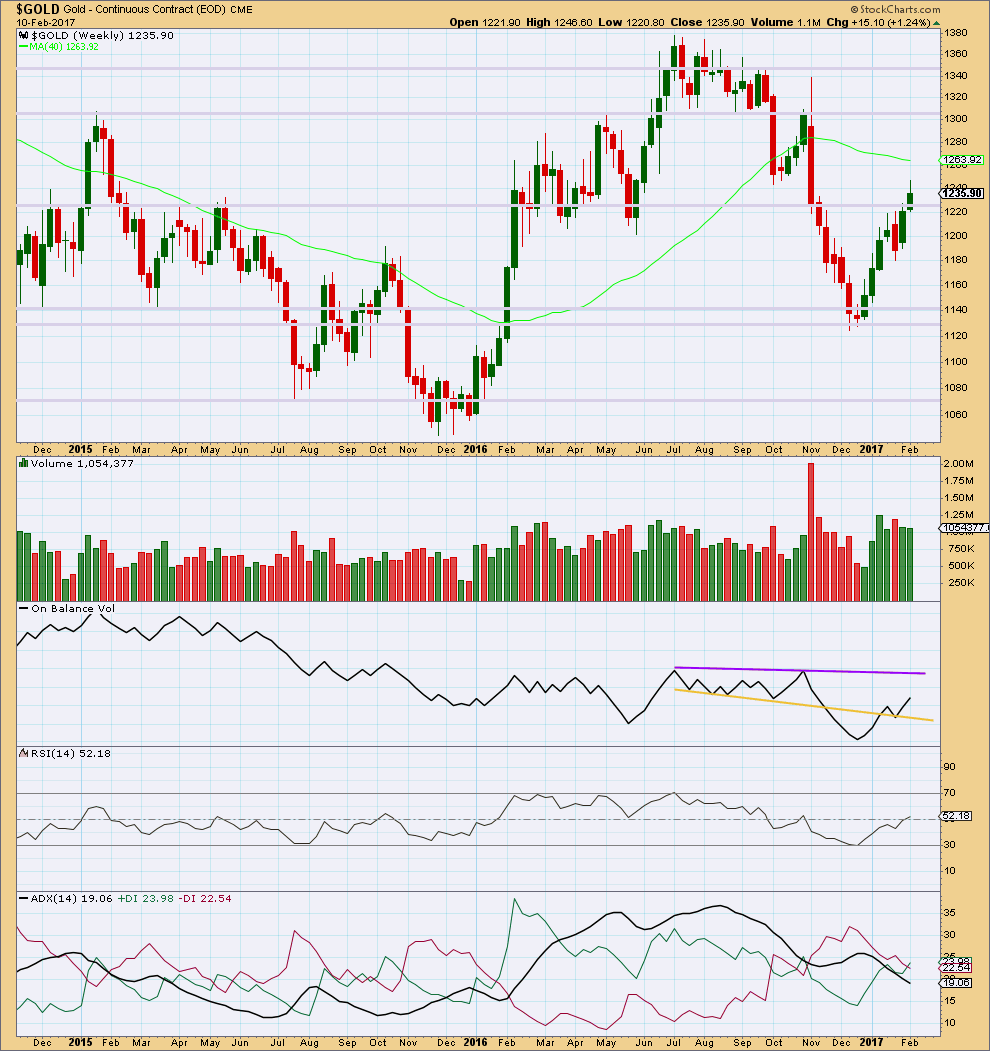
Click chart to enlarge. Chart courtesy of StockCharts.com.
The long upper wick and smaller real body on this week’s candlestick is slightly bearish. The decline in volume is also bearish.
The strongest weekly volume in recent weeks is a downwards week, and this too is bearish.
On Balance Volume is some distance away from resistance.
ADX continues to decline indicating no clear trend.
DAILY CHART
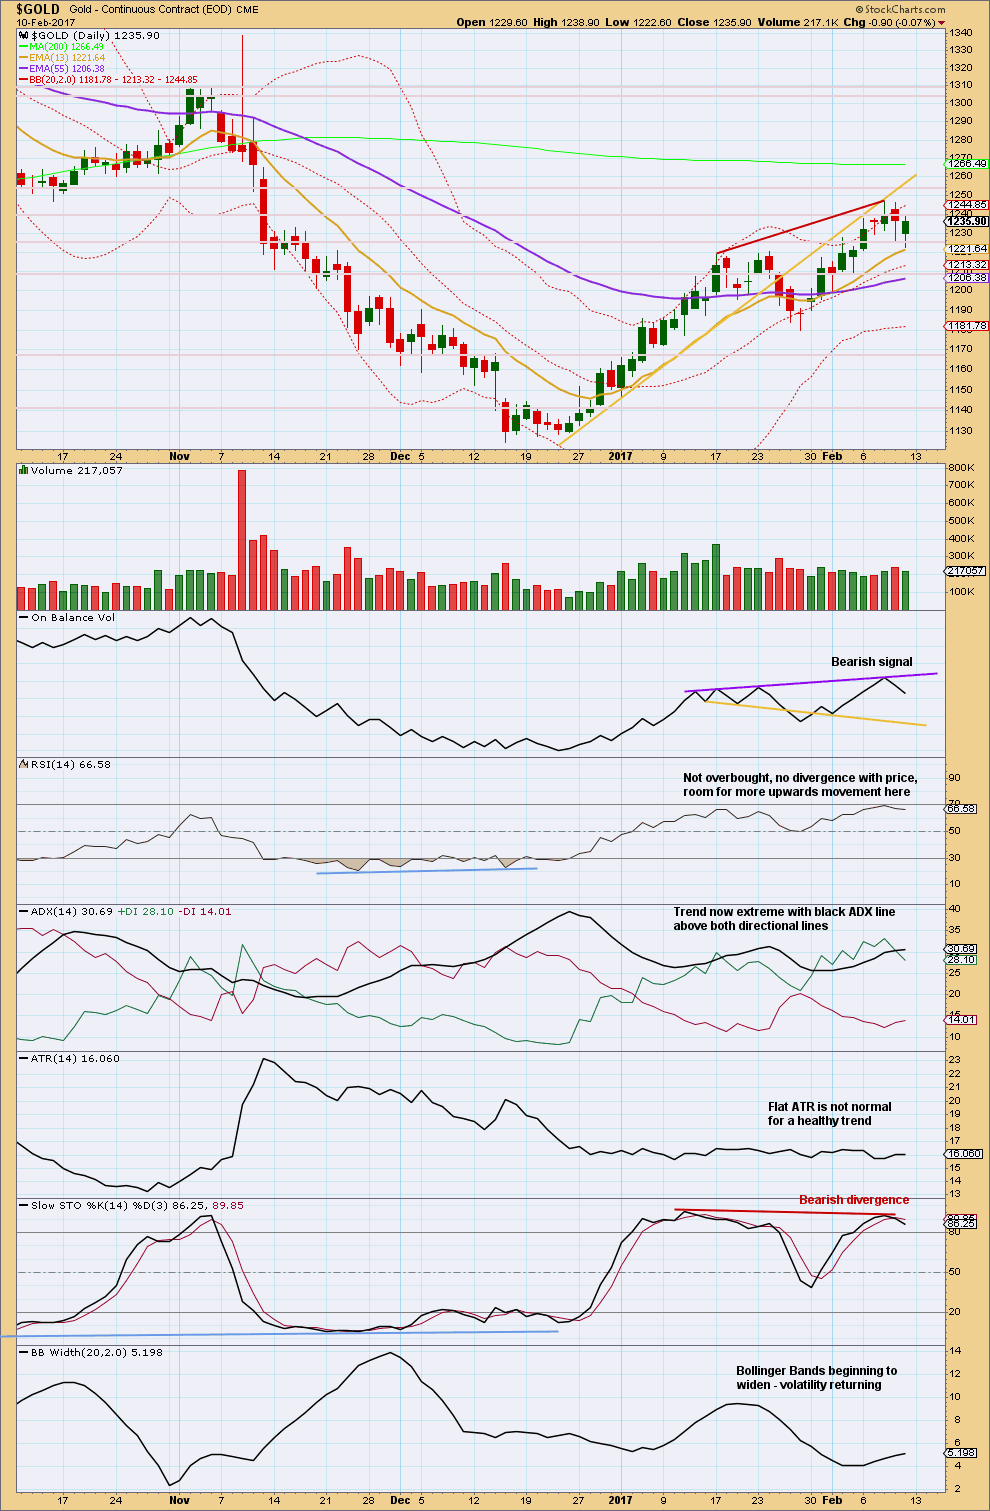
Click chart to enlarge. Chart courtesy of StockCharts.com.
Friday’s session has a lower low and lower high, compared to Thursday’s session, although it closed green. The balance of volume during the session was down and volume was lighter than the prior downwards day. The market fell of its own weight on Friday.
The bearish signal from On Balance Volume may possibly now be resolved. There is some distance before OBV finds support.
Price is finding some support about 1,225 and resistance about 1,235. Next support is about 1,205.
GDX
DAILY CHART
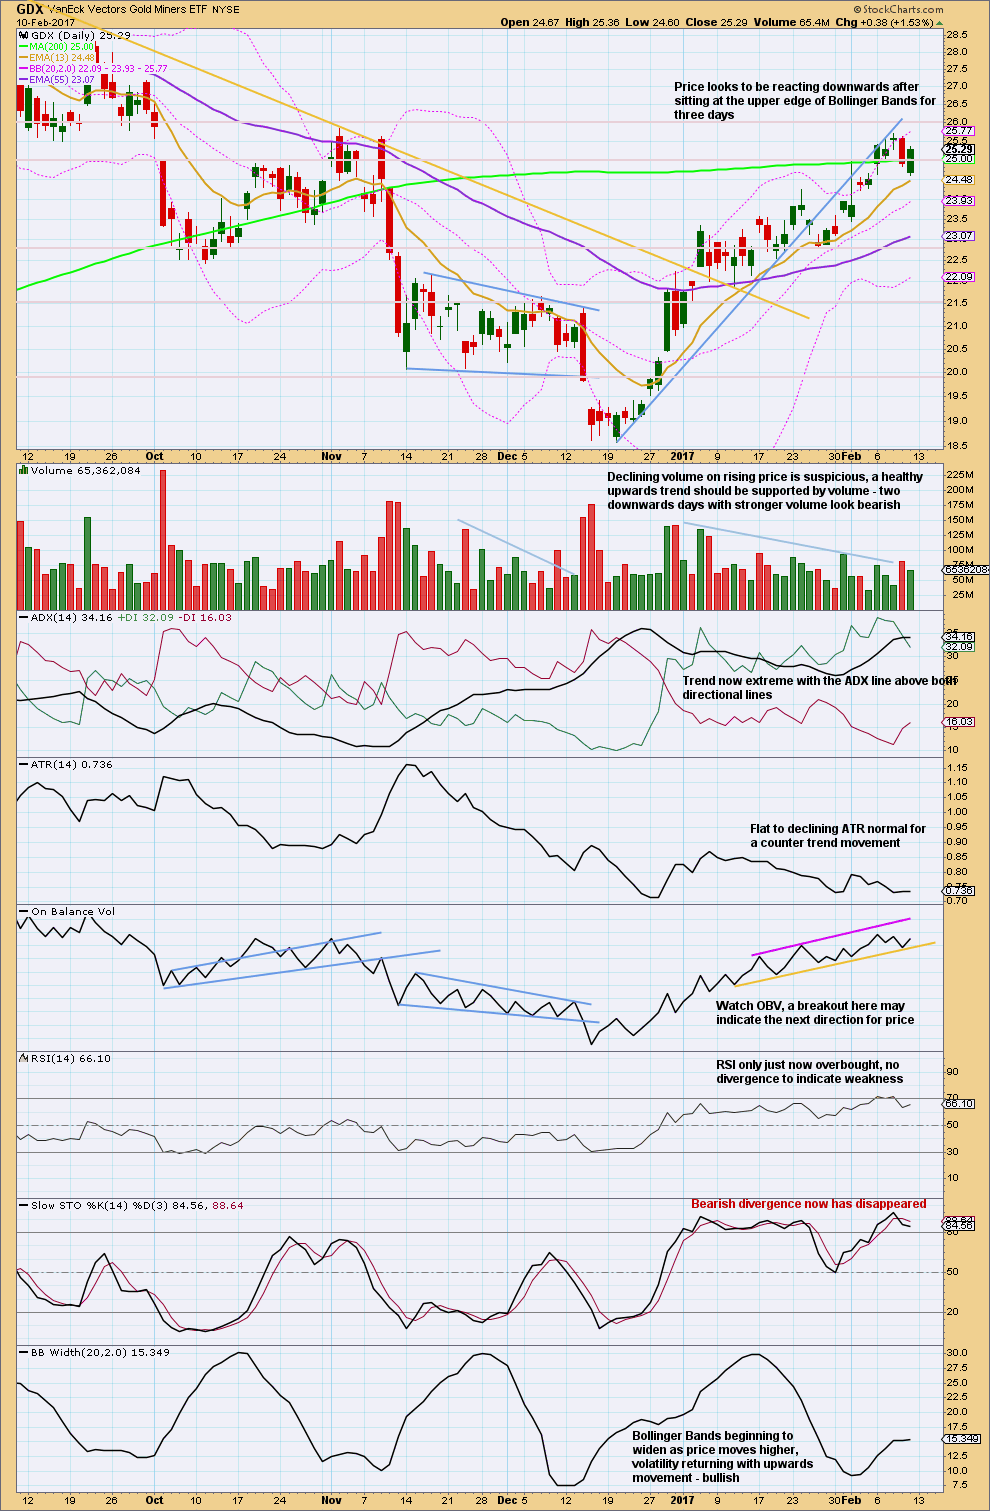
Click chart to enlarge. Chart courtesy of StockCharts.com.
A pullback looks to have begun for GDX.
Price made a lower low and lower high, the definition of downwards movement, during Friday’s session. But the session closed green and the balance of volume during the session was upwards. With lighter volume on Friday for upwards movement during the session, this rise in price does not have support from volume and is read as bearish.
Next support is about 22.80. First, price may find support about the 13 day moving average.
On Balance Volume did not break below the yellow support line. This line is very slightly adjusted today.
This analysis is published @ 06:43 p.m. EST on 11th February, 2017.
Joseph and Verne,
Verne…thanks for checking in….I know, this is UNnerving. I’ve already been in/out 2-3 times trying to get an entry. LIke Lara…I’m in now, just waiting to hopefully ad. {Though I Don’t like the word ‘hopefully’!}.
Joseph…Target of course depends on where you think we are in this trade. I currently have 3 XAUUSD charts going.
A. MAIN Count– w/ Minute ic & iic Orig. complet. That is why I mentioned Today’s poss. retrace of minuette (ii) [green] of Minute iiic [pink]
B. ALT Count
C. Lara’s Afternoon count Today–I have a slight bit of overlap between minuette (i) & (iv) as another member mentioned, BUT; I see Lara’s point…(ii) & (iv) are Well Balanced.
D. As far as targets, depending on which chart I place Fib Extensions/Retracements, I SEE:
1st Target: 1205-1199+
2nd Target: 1175-76 give/take
3rd Target: Here I am NOT sure….I think we need more wave formation and input from Lara
Everyone have a nice evening….
Thank you a lot, Melanie. I’m playing catch-up on my wave learning curve…and enjoying every bit of it. One day I’ll be fluent in all the lingo…and put my engineering degree to the test in interpretation…:)
Yep, let’s await Lara’s count and plot the next move.
Have a great night.
No problem Melanie.
I am going to see what my JNUG position does over the next day or two and try and figure out if it would have been more efficient to take profits early and reload.
Since I mostly trade options it could be that rolling the position as it becomes profitable might be a more profitable way to trade the trend as compared to staying put for the wave’s duration. I think I will do this with half the position as soon as it is again showing a profit and compare how actively trading the trend compares to letting it run. It may be that my hit and run approach works best for option trades, and the way to compound gains is to roll each small profitable trade into new strikes to continue to take advantage of the trend. I think I will add some 11.00 strike JNUG puts next trading session and see how they do compared to the already positioned 11.50 strikes after being rolled. Thinking out loud…. 🙂
Verne,
I had been thinking about this most of the day. The problem w/3X etfs and futures ( and of course holding futures overnight can be costly unless one has a full understanding of how to hold an options hedge on those contracts overnight ) is that if you do not take the profit during the ‘Heat’ of the trade,
( many times @ open ) it just melts away. So…I am tending to think that no matter whether buying these instruments outright or using options, your theory may well prove correct.
These are just not as ‘Holdable’ as GDX or even GDXJ.
Yep! Striking while the anvil is hot has been in my exoerience the safest way to handle option trades and I suspect the same goes for leveraged etfs. Lots of expanded flats are inimical to holding on to option trades. Winning ones can evaporate quickly.
A quick comment about Fukishima Daichi. It IS a terrible situation. In the US, Bill Gates and others are funding a Lab in the western states to try to bring more nuclear power to the US and globe in a ‘safer’ way. I am just not sure this is possible w/o serious incident. No matter, the risks seem to out weight the rewards for this type of energy resource.
I don’t know…can Bill and his scientists overcome earthquakes, tidal waves, etc???
“can Bill and his scientists overcome earthquakes, tidal waves, etc???”
Nope. Nature will prevail.
Our refusal to recognise that may be our downfall.
I often wonder what our friends in Japan were thinking when they located The power plant where they did…
I feel like I’ve arrived late to the party. Off the grid for the past few days. The reason the media does little to report on Fukushima is likely directed by government to prevent mass panic and by atomic energy lobby which wants this situation silenced…even though this catastrophe is silently spiraling out of control. 6 years of unimaginable levels of radiation spewing into the Pacific Ocean is having it’s effect and it’s not like having a microwave oven in your kitchen…it affects the ecosystem at all levels. Perhaps the unusual West Coast weather is a result of Fukushima? I agree Lara…Nature will prevail, but perhaps the billionaires can find a way to stabilize and clean up the worlds most catastrophic disaster, even worse than Chernobyl?! I hope they can..
I think many of the billionaires are busy buying bolt holes in New Zealand 🙁 Not so sure they want to spend their billions cleaning up.
Hi Verne,
I see the long wicks on Daily, but maybe this down trend is just getting going.
1. Could have just finished Minuette (i) [green] of Minutte iii [pink].
2. Now retracing in Minuette (ii) to poss. 0.618 about 1229-1230= fair intraday
resistance in this area. Maybe a chance to add to short position somewhere here.
3. Other opinions:
A. I subscribe to The Daily Gold: Jordan is expecting a pullback Now.
B. Avi- Seeking Alpha article this weekend– mixed about a pullback (but that was yesterday). If a pullback, could be sharp/quick.
C. Mike Swanson interviewed Ike Iossif and published interview and charts 2/10. Ike sees more than 1 path for gold. Have you taken a look at this yet?http://marketviews.tv/wsw/wsw021017.htm
i. If you Subscribe to Marketviews- Ike’s service– I’d like to know what you think about it.
4. I had written an email on Fri. late afternoon. If/When you trade 3X etfs, ie: JDST/JNUG, do you use Only Mental Stops because getting stopped out w/
i. Mkt Stop – one can get stopped out 15-20 decimals away from where you want to
get out. [another words one gets stopped out Prematurely w/no accuracy.]
ii. Stop Limits- can just pass you by!
So….how do you manage these 3X etfs if you are trading the actual instrument and NOT the options?
Have a good afternoon….
Hi Melanie.
I like Mike’s interviews with Ike and I did listen to that last one.
I think one source of the jitters I am experiencing is a recent tweak of executing my trades to better take advantage of Lara’s excellent price targets. I am so accustomed to taking profits quickly it is really tough for me to sit on a trade while the wave moves toward its target. I uncharacteristcally sat on a 25% gain on my jnug puts then went bqck to breakeven today. I am sticking with the more patient approach while the wave develops. I will keep you posted … 😉
Thanks, Melanie, for sharing….can I assume all roads are potentially looking for a pullback to 1205? I’m short…trying to figure an exit prior to going long. Next few days will be interesting, as it’ll give more confidence in targets and determine if the pullback will be shallower than forecasted…which I believe Lara is reaearching as well.
This may be happening. There is a good Fibonacci ratio here and very good alternation between minuette waves (ii) and (iv).
The green Elliott channel is drawn using the second technique. If price breaks above the upper edge then expect another bounce up to the 0.618 Fibonacci ratio of minute i. If it is deeper than that then we may see a second back test of the pink channel. That would now allow for a very deep second wave.
On my chart that would mean wave (iv) overlapped wave (i).
Different data feeds for this market will have slight differences in price points.
The data feed I’m using from BarChart has the low of minuette (i) at 1,236.74 and the high of minuette (iv) at 1,236.52. So no overlap.
It actually doesn’t matter if other data feeds have an overlap, they may have very slightly different wave counts. Because it’s different data.
This is always a problem that members raise for this market. Gold is a global market that does not have one central data collection point and so each data supply will have slight differences. As long as I am consistent in using the same data source the analysis should be accurate. Or at least, as accurate as I can make it.
Thanks
I don’t like to ignore long lower wicks in a bull trend…unless things change we will get one in Gold today…
I think you mean bear trend? Yeah, there’s a long lower wick there for today and the prior day too. But it’s not too long….
I think I can see a reason. I suspect a five down has just ended for Gold and now a three up to backtest the channel again. I’ll chart that and see how it looks and how the Fibonacci ratios stack up.
I was thinking since the main trend is up and this wave down is corrective, the previous quick turns came to mind. I know it is really quite early in C down though…
Gold has been turning quickly off its corrective moves. If it does this again it will really screw up my strategy of waiting for the expected wave targets…
I have a short I’m still holding on to. I’ll add to it on each bounce.
?Very sad what is happening at Fukishima Daichi. The structural supports of t’he buildings housing the reactors have been severely damaged including the one with the melting core. These reactors are all sitting on an active sesmic site so it is just a mater of when, not If, there will be more tremors. That single melting core makes that location unapproachable by 3ahumans for all time. If the building collapses, it will bé vaporised and the core will be exposed to the atmosphere. This is very bad. I do not hear any alarms going off…😫
Japan is dying. ..!
This should be front page news. I think it’s not mostly because our news outlets have very short attention spans, and there are very few proper investigative journalists left.
Apparently they hire young people (cheaper) to sit in the office and cut and paste stuff from other sources online.
Our NZ Herald does this, and they get “news” from what’s trending on FaceBook and Twitter. For real!
Meanwhile, Fukushima is melting and a massive environmental disaster is brewing and the world is distracted by meaningless drivel.
It really should. I am truly puzzled at how little is being said about this,escpecially considering the implications for Califòrnia. The radiation level measured in unit two is 530 sieverts, which translates to a mind blowing 53,000.00 rems! An exposure of 300 to 450 rems will kill half the population exposed over a thirty day period. Truly hearbreaking to not let people know…
The Japanese media may be covering this within Japan. I don’t know. We don’t currently have any members here from Japan to ask.
As for California, the ocean currents push all that radiation up from Japan and so they’re going to be affected. I would think that the media in California should be all over this 🙁
Even in Japan, TEPCO is seriously underplaying the potential dnanger unfortunately….Even IF they decide to decommission the plant, how on earth are they going to do it without it being a suicide mission?
Rambus public post on the USD
https://rambus1.com/2017/02/12/weekend-report-126/