
Today’s Trading Room looks at Copper and Natural Gas.
To learn what the Trading Room is about see first Trading Room analysis here.
Trading Room will focus on classic technical analysis. Elliott wave analysis will be for support and for targets / invalidation points.
Copper (Spot)
TECHNICAL ANALYSIS
Click chart to enlarge. Chart courtesy of StockCharts.com.
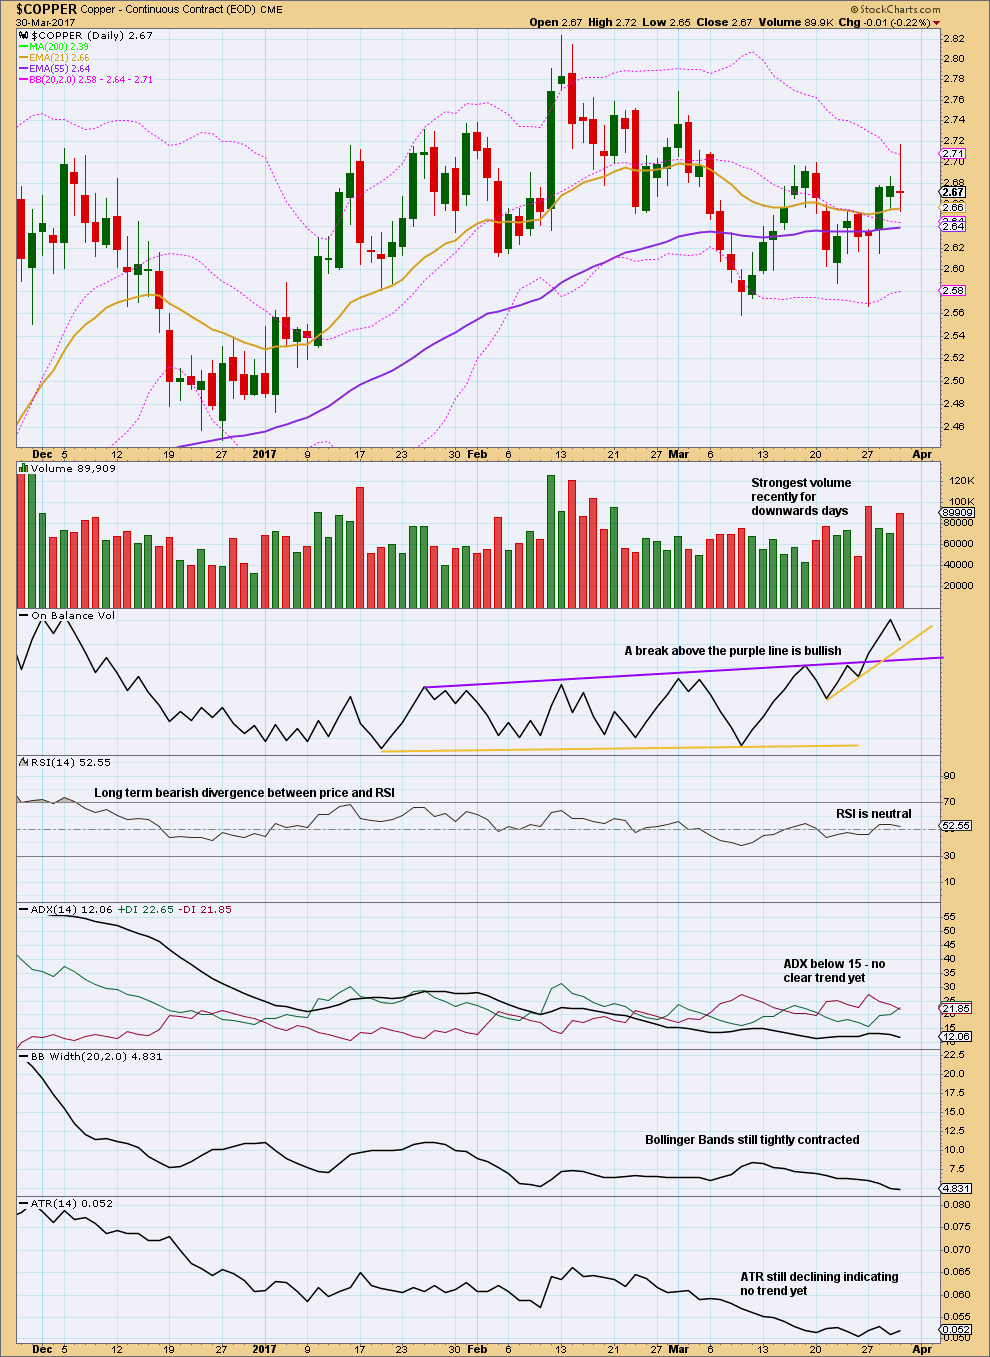
The last trade for Copper was closed on the 27th of March.
Now Copper has moved higher.
The long lower wick of the 27th of March is bullish. Now the long upper wick of the 30th of March is bearish. A reasonable expectation would be for Copper to print at least one red daily candlestick next.
Strong volume for a session with the balance of volume downwards supports downwards movement.
On Balance Volume may find some support at the yellow trend line, but this line does not have much technical significance as it is steep and only tested twice before. The purple line does offer reasonable significance, so this may halt a fall in price.
Copper is range bound with resistance about 2.700 and support about 2.560. During this range bound period, it is two downwards days that have strongest volume suggesting a downwards breakout is more likely than upwards.
TREND LINE
Click chart to enlarge.
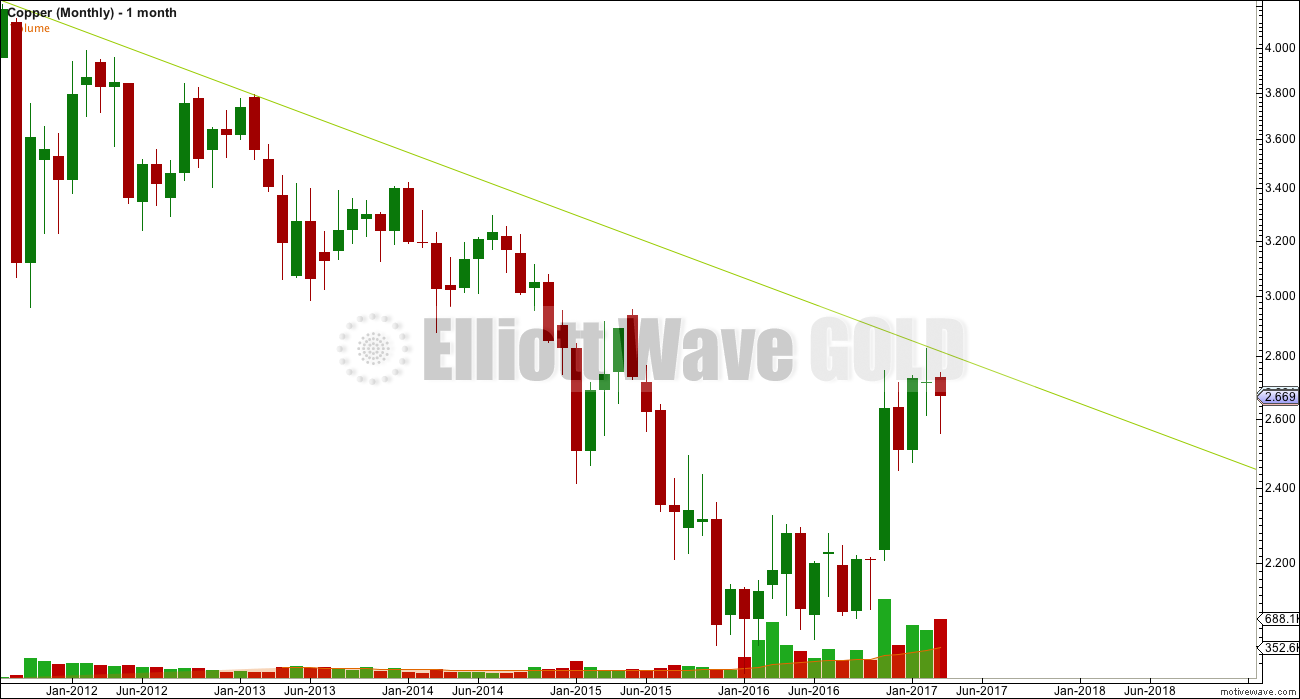
Copper has found very strong resistance at the green trend line, which goes back to at least August 2011. The doji candlestick for February puts the trend from up to neutral.
ELLIOTT WAVE ANALYSIS
Click chart to enlarge.
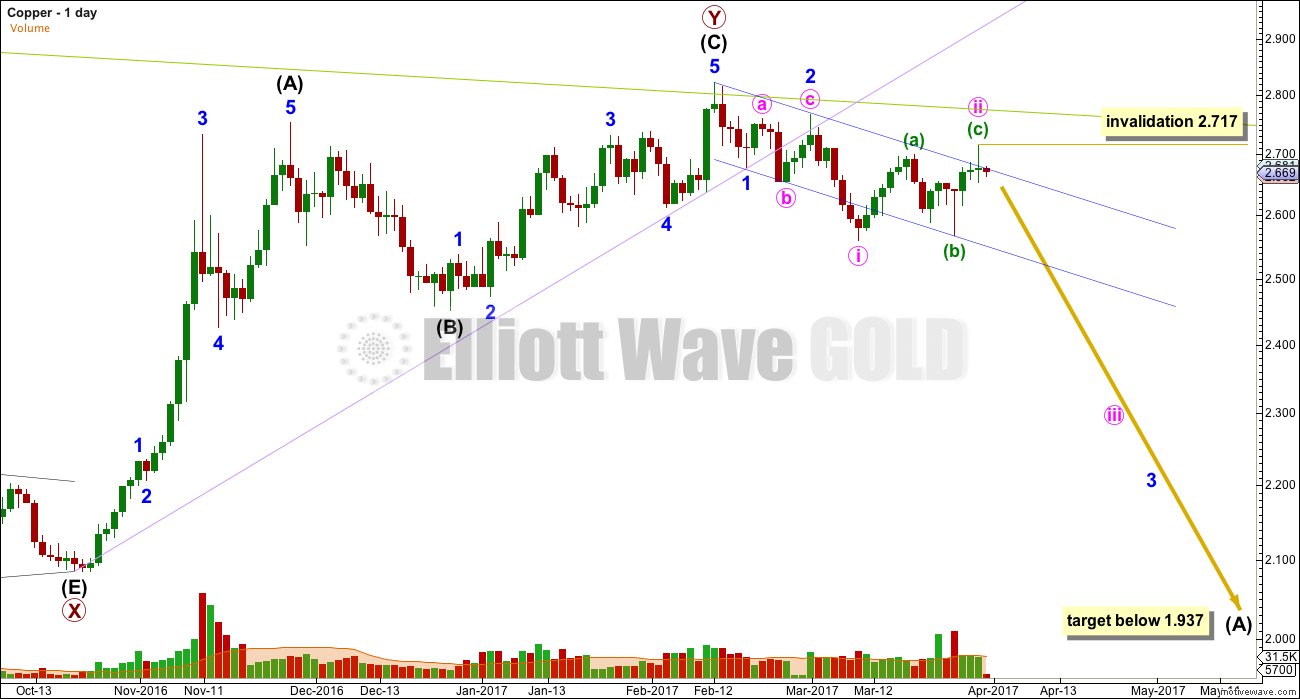
The upper edge of the blue channel has provided resistance, with a strong overshoot for the 30th of March. Copper may be ready to move lower in a third wave at two degrees and this should see an increase in downwards momentum.
Trading advice for members only: [wlm_private “GOLD Daily YT|GOLD Daily NT|GOLD Daily NTGR|GOLD DAILY 6M NT|GOLD DAILY 6M YT|GOLD DAILY 6M NT GFR|GOLD Plus Daily YT|GOLD Plus Daily NT|OIL SILVER Weekly YT|OIL SILVER Weekly NT|GOLD Plus Daily 6M NT|GOLDPLUSDAY6M|OIL SILVER Weekly 6M NT|GOLDPLUSDAY1M|GOLDPLUSDAY1MYT|GOLDDAY6M|GOLDDAY1M|GOLDDAY1MYT|OILSILVERWEEK6M|OILSILVERWEEK1M|OILSILVERWEEK1MYT”]Stops may be set just above the invalidation point. Allow for widening broker spreads in times of volatility, so set stops about 3X the normal spread above the invalidation point. Short positions should be profitable within 24 hours. If that happens, then move stops to breakeven to reduce risk.[/wlm_private]
Natural Gas
TECHNICAL ANALYSIS
Click chart to enlarge. Chart courtesy of StockCharts.com.
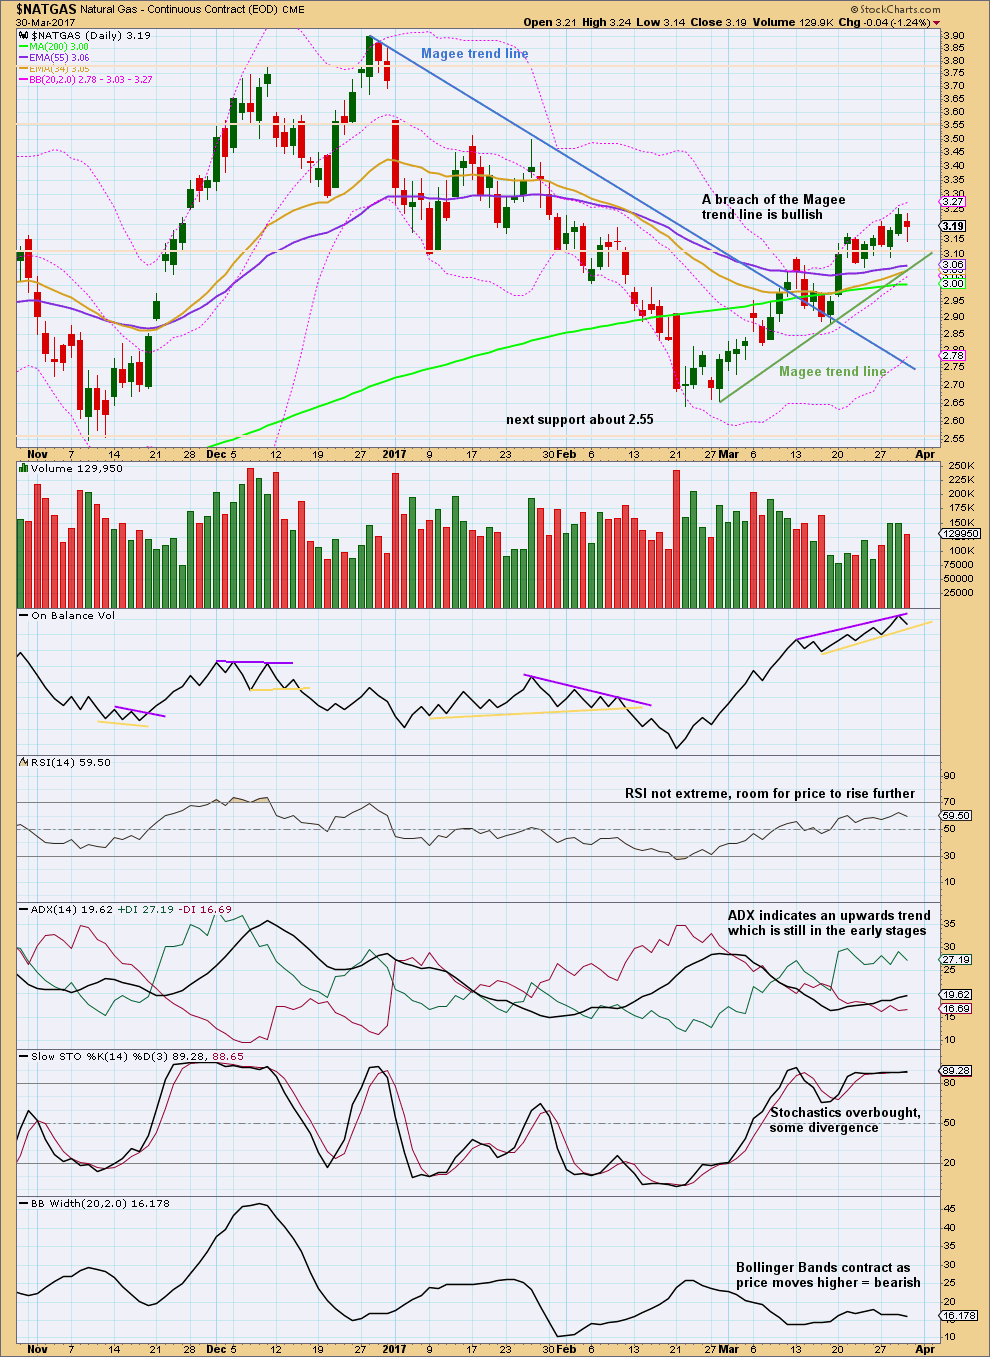
Natural Gas is now in an upwards trend. The breach of the blue bear Magee trend line indicated a trend change from bear to bull.
Now a new trend line is drawn for the new bull trend in green, so expect corrections to find support at this line. If it is breached, it would indicate a change.
Next resistance is about 3.550.
There is strong volume for upwards movement in recent sessions. The new trend has support from volume.
On Balance Volume is constrained within sloping lines. A breakout would be a bullish or bearish signal.
Stochastics can remain extreme for reasonable periods of time. With price sitting close to upper edge of Bollinger Bands and Stochastics exhibiting divergence with price at highs while extreme, it looks like in the short term a small pullback may unfold.
ELLIOTT WAVE ANALYSIS
Click chart to enlarge.
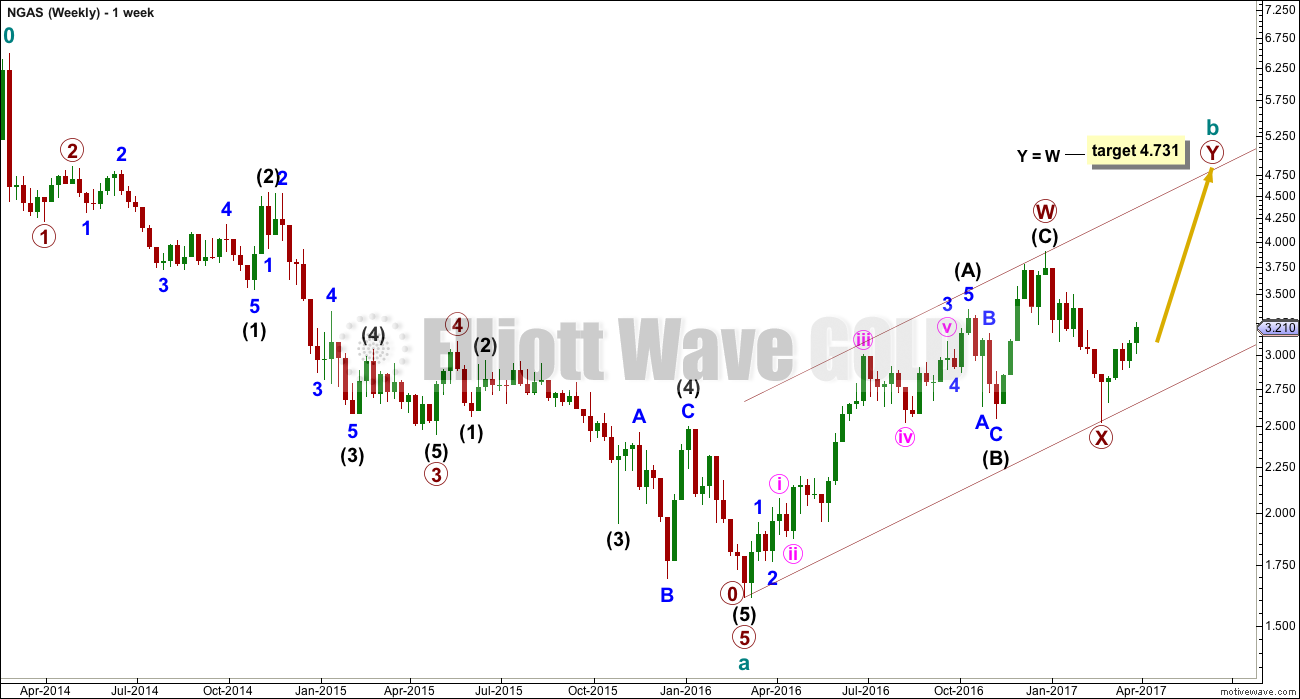
The last Elliott wave count was invalidated with a new high this week above 3.174. Cycle wave b may be continuing higher as a double zigzag.

Click chart to enlarge.
The downwards wave labeled primary wave X is now a complete structure. It fits best and looks most like a three wave movement.
Intermediate wave (B) may not move beyond the start of intermediate wave (A) below 2.522.
Trading advice for members only: [wlm_private “GOLD Daily YT|GOLD Daily NT|GOLD Daily NTGR|GOLD DAILY 6M NT|GOLD DAILY 6M YT|GOLD DAILY 6M NT GFR|GOLD Plus Daily YT|GOLD Plus Daily NT|OIL SILVER Weekly YT|OIL SILVER Weekly NT|GOLD Plus Daily 6M NT|GOLDPLUSDAY6M|OIL SILVER Weekly 6M NT|GOLDPLUSDAY1M|GOLDPLUSDAY1MYT|GOLDDAY6M|GOLDDAY1M|GOLDDAY1MYT|OILSILVERWEEK6M|OILSILVERWEEK1M|OILSILVERWEEK1MYT”]A trade set up is not seen at this time. Look for price to pullback to touch the green Magee trend line on the TA chart. If that happens, then enter long with a stop just below the line. Allow for overshoots, but exit long positions if the line is breached.[/wlm_private]
TRADING ROOM SUMMARY TABLES
OPEN POSITIONS

Click table to enlarge.
Trading advice for gold given to Elliott Wave Gold members will be included in Trading Room summary tables. However, so that it remains private for Elliott Wave Gold members only, it will not be included in Trading Room posts.
CLOSED POSITIONS
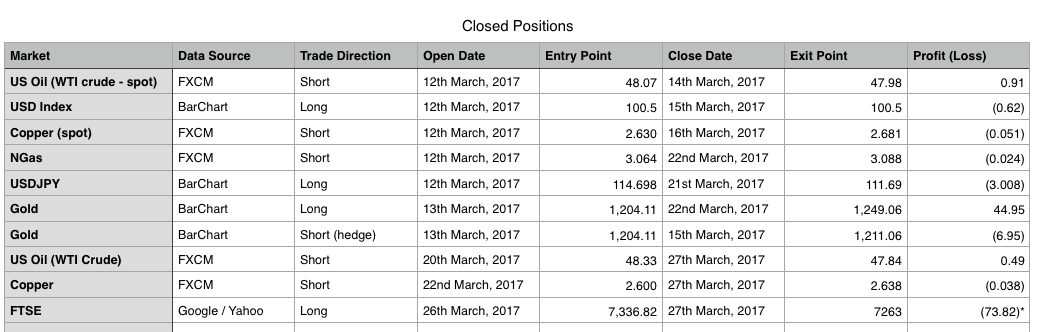
Click table to enlarge.
Trades advised to Elliott Wave Gold members for Gold have now been included in Trading Room summary tables.
*FTSE was a weak recommendation. Advice was given to only invest 1-2% of equity on this trade.
RECOMMENDATIONS
[wlm_private “GOLD Daily YT|GOLD Daily NT|GOLD Daily NTGR|GOLD DAILY 6M NT|GOLD DAILY 6M YT|GOLD DAILY 6M NT GFR|GOLD Plus Daily YT|GOLD Plus Daily NT|OIL SILVER Weekly YT|OIL SILVER Weekly NT|GOLD Plus Daily 6M NT|GOLDPLUSDAY6M|OIL SILVER Weekly 6M NT|GOLDPLUSDAY1M|GOLDPLUSDAY1MYT|GOLDDAY6M|GOLDDAY1M|GOLDDAY1MYT|OILSILVERWEEK6M|OILSILVERWEEK1M|OILSILVERWEEK1MYT”]
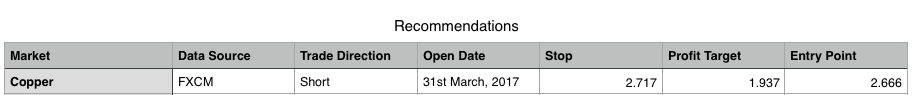
Click table to enlarge.[/wlm_private]
DISCLAIMER
As always, it is essential that anyone using this analysis for trading advice manages risk carefully. Follow my two Golden Rules:
1. Always use a stop.
2. Never invest more than 1-5% of equity on any one trade.
Trading is about probabilities, not certainties. Failure to follow my two Golden Rules of trading indicates failure to manage risk.
Accept that this analysis may be wrong. It is impossible for any analyst to predict with certainty what a market will do next.
This analysis is published @ 02:53 a.m. EST.
Exit Gold short for a profit now of about 4.89.
Copper should now be positive, but price has not move far enough below entry yet to move stops to breakeven. Risk on Copper remains the same.