
One of my favourite Technical Analysis texts is the classic “Technical Analysis of Stock Trends” by Magee. In this book Magee describes how to draw trend lines for bull and bear markets.
Click chart to enlarge.
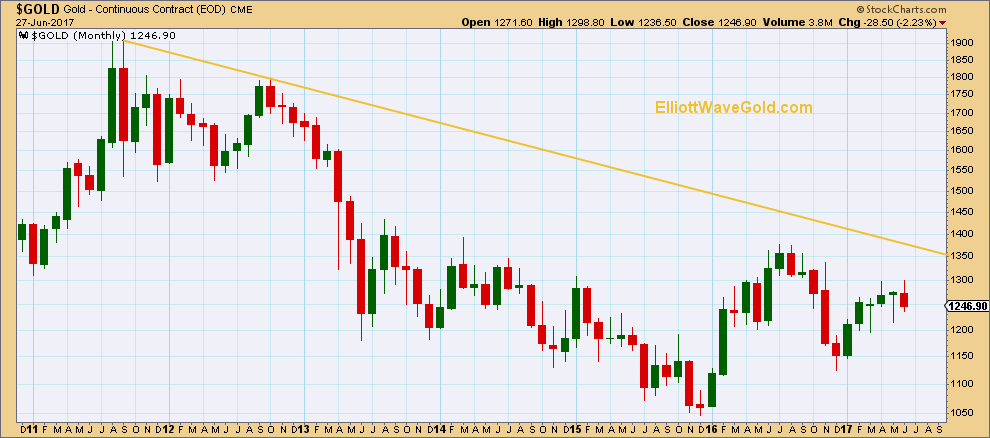
To draw a trend line in a bear market draw the line from the high to the first major swing high within the bear market. Extend the line outwards. Assume the bear market remains intact while price remains below the line. When upwards movement breaks above the trend line, it is an indication of a potential trend change from bear to bull.
My definition of a breach is a full candlestick above and not touching the trend line.
This technique works on all time frames.
This chart is on a monthly time frame and indicates that Gold may remain in the larger bear market, which began on September 2011.
This analysis is published @ 03:02 a.m. EST on 28th June, 2017.