by Lara | Jun 30, 2020 | Education, Public Analysis, Reference
Comprehensive List of Elliott Wave Rules and Guidelines The following is a comprehensive list of all Elliott wave rules and guidelines. Rules are almost the same as Elliott’s original rules as outlined in Frost and Prechter’s Elliott Wave Principle. A few...
by Lara | Nov 21, 2017 | AMZN, Education, Public Analysis
Unlike Google, Amazon does not have a neat a trend line. Click chart to enlarge. The solid yellow trend line is Amazon’s equivalent to the Google Forever trend line. The bottom line is that we should assume that Amazon remains in a bull market while price...
by Lara | Nov 13, 2017 | Bitcoin, Education, Public Analysis
Last analysis of Bitcoin expected more upwards movement, which is what has happened. Last published Bitcoin analysis is here. All charts are on a semi-log scale. FORTNIGHTLY CHART Click chart to enlarge. The data for this wave count begins from June 2010. What looks...
by Lara | Oct 31, 2017 | Education, GOOG, Public Analysis |
In keeping with the KISS principle, this trend line is very simple. I call it “Google’s Forever Trend Line”. Click chart to enlarge. This trend line has very strong technical significance. It is very long held and has been tested multiple times. It...
by Lara | Oct 18, 2017 | Education, Public Analysis |
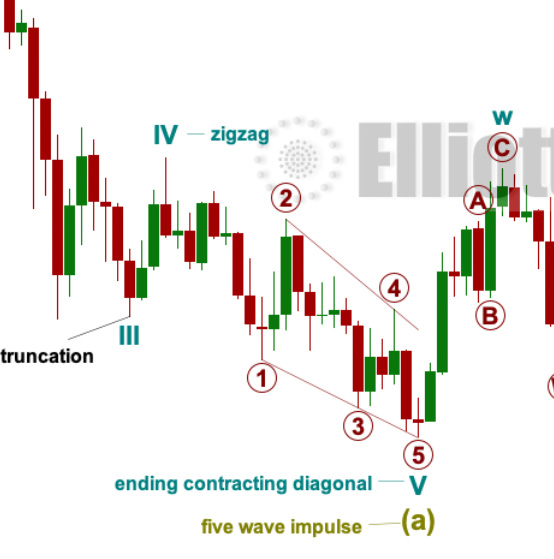
Another brain teaser to test your Elliott wave knowledge: Click chart to enlarge. I have tried to make it a bit easier by violating only core Elliott wave rules and making the mistakes really bad ones. Price points of all waves are given so you can calculate lengths...
by Lara | Aug 4, 2017 | Education, Public Analysis, S&P500, Trading Tips
A simple classic technical analysis pattern may answer the question of what direction to expect tomorrow from the S&P500 upon release of Non Farm Payroll data. This release is expected to move markets strongly:. Click chart to enlarge. Pennants are reliable...
by Lara | Aug 3, 2017 | Education, Gold, Public Analysis |
For those who want to hone their Elliott wave knowledge, have a go at spotting my deliberate mistakes: Click chart to enlarge. This one is easy (at least, I think it is and I’ve really tried to make it easy). There is one mistake in the triangle (just one!) and...
by Lara | Aug 2, 2017 | Education, Gold, Public Analysis
Volume analysis is essential to a full technical analysis. One of the simplest techniques is to look at volume during a consolidation and note which days, upwards or downwards, have strongest volume. Click chart to enlarge. Gold has been within a large consolidation...
by Lara | Jul 12, 2017 | Commodities, Education, Palladium, Public Analysis |
A second Elliott wave version of “where’s Waldo”. A fun exercise (for the geeks amongst us). Test your knowledge of Elliott wave rules. Review this chart and find five deliberate mistakes: Click chart to enlarge. Two mistakes break core rules, but...
