
Last analysis of Bitcoin expected more upwards movement, which is what has happened. Last published Bitcoin analysis is here.
All charts are on a semi-log scale.
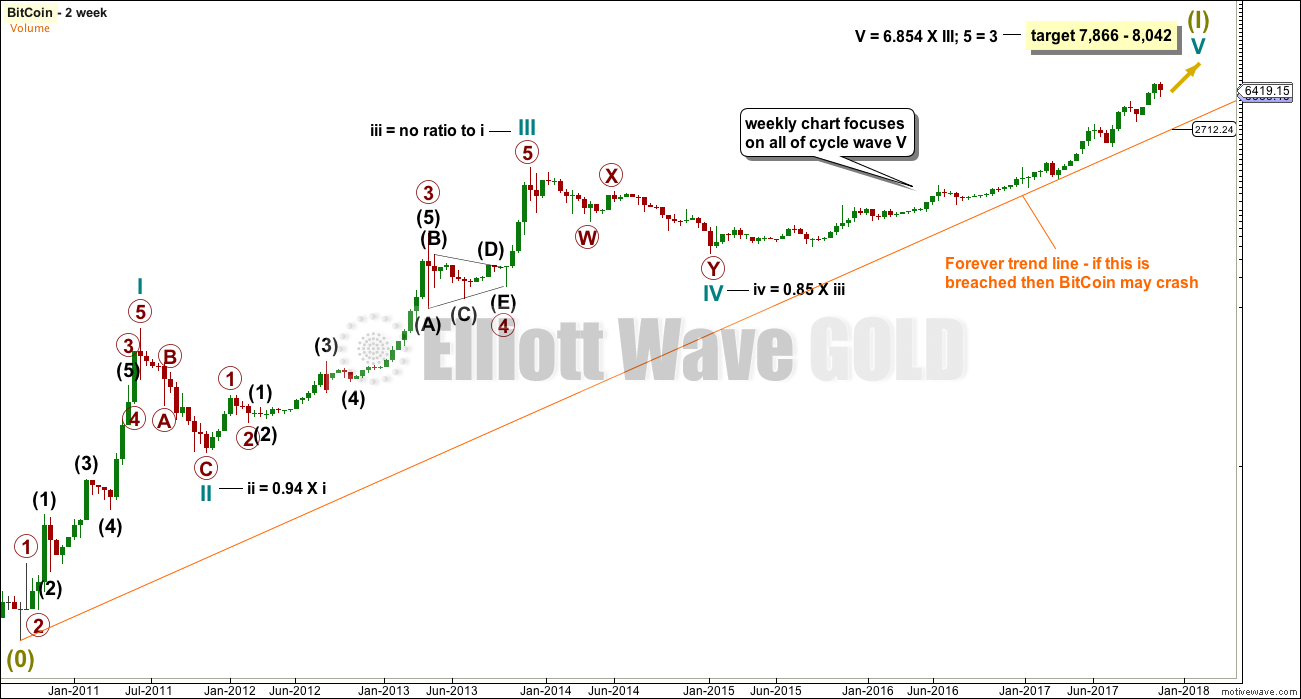
FORTNIGHTLY CHART
Click chart to enlarge.
The data for this wave count begins from June 2010.
What looks like a five wave impulse may be completing. With no Fibonacci ratio between cycle waves III and I, it may be more likely that cycle wave V will exhibit a Fibonacci ratio to either of III or I.
This movement does not fit well at all into a channel.
I have taken some time to look at the waves which now in hindsight are obviously complete, particularly the waves within cycle wave III. I have noticed some tendencies of this market:
– Bitcoin behaves like an extreme commodity. Its impulses have a curved look with slower second waves, quick fourth waves, and strong sharp fifth wave extensions. This tendency shows up in bullish and bearish waves.
– Third waves are much longer than first waves, and fifth waves are longer still. Again, this is an extreme version of typical commodity behaviour.
– The middle of its third waves may exhibit Fibonacci ratios within them, but overall it does not regularly exhibit good Fibonacci ratios. This would make target calculation particularly difficult.
– Candlestick reversal patterns are common at the end of Bitcoin’s strong fifth waves. These are engulfing patterns or star patterns with very long wicks on the final candlestick.
– Early second wave corrections are extremely deep, close to 0.8 and often deeper than 0.9 the depth of the prior first wave.
The “forever” trend line should be used to indicate when the top may be in for BitCoin. If this line is breached, the probability of a crash will increase (it will not be certain, only highly likely).
Notice that Bitcoin completed strong blowoff tops at the end of both cycle waves I and III. At the end of cycle wave I, the rise for the last eight weeks was vertical. Again, at the end of cycle wave III, the rise for the last eight weeks was vertical (remember, this is a two weekly chart).
Notice that at this time the current rise is not vertical. Current price action looks more like the early stages of cycle waves I and III than their ends.
If my targets are wrong, they may be woefully inadequate. I would not recommend using these targets for exit points for any Bitcoin purchases.
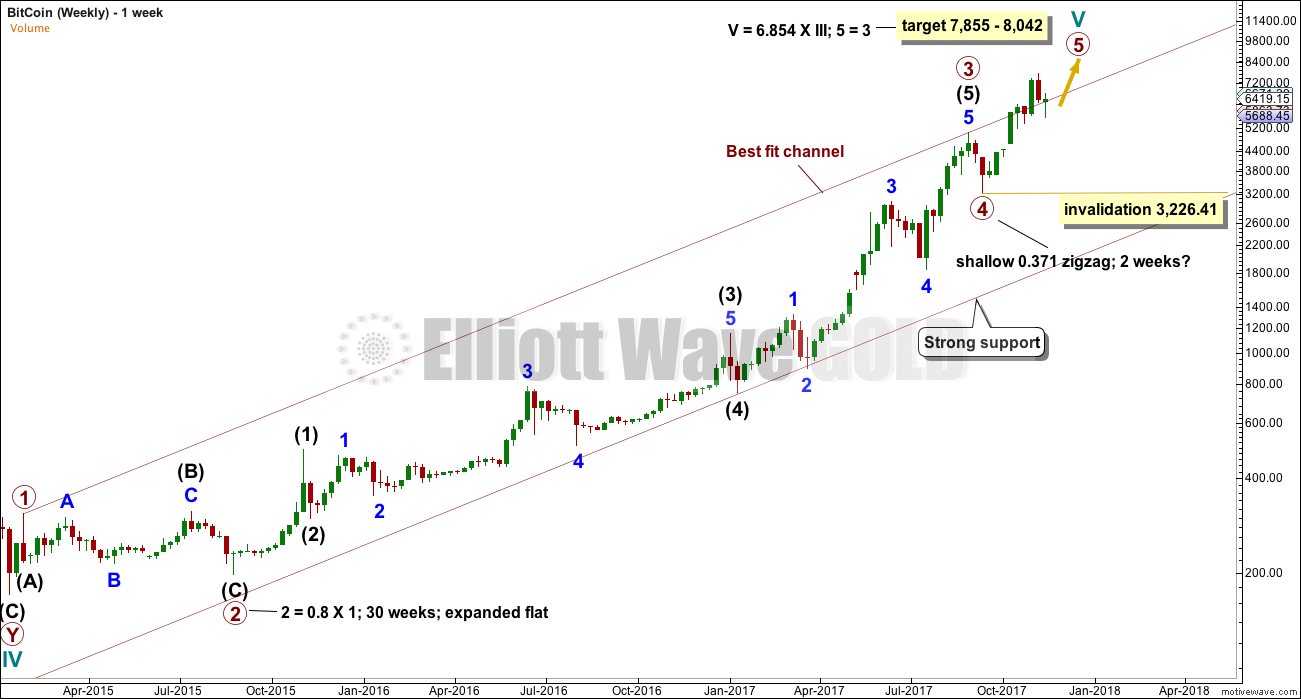
WEEKLY CHART
Click chart to enlarge.
Last analysis of Bitcoin expected more upwards movement, which is so far what is happening.
Primary wave 3 may be complete as labelled. Primary wave 5 may turn out to be only even in length with primary wave 3, but it may well be much longer than that. Within cycle wave III (not shown on this chart, see the two weekly chart above), primary wave 5 was just 26.45 short of 4.236 the length of primary wave 3.
Here, if primary wave 5 were to exhibit the same Fibonacci ratio to primary wave 3, the target would be at 23,626. While this target may seem extreme, it is possible.
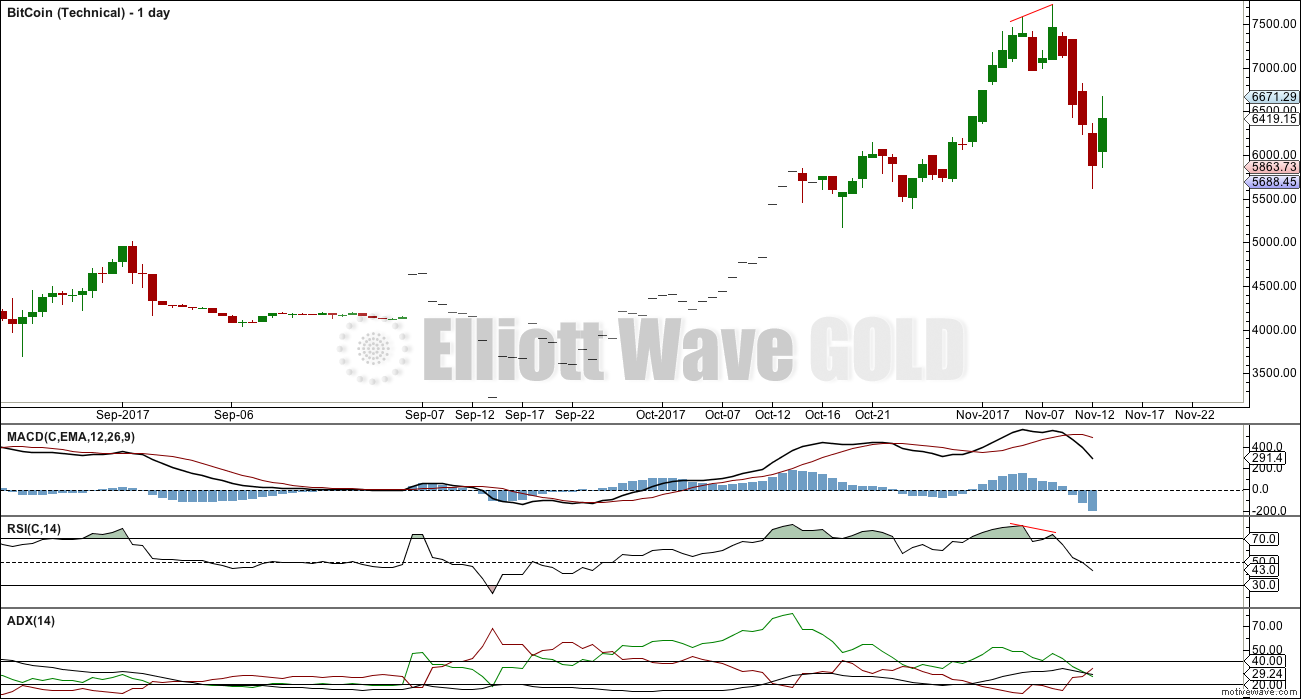
TECHNICAL ANALYSIS
Click chart to enlarge.
At major highs, Bitcoin often exhibits strong candlestick reversal patterns. That is not the case at the last high.
Single divergence with price and RSI at the last high signalled a likely pullback. The question right now is: is this pullback complete?
At the end of pullbacks, Bitcoin does not always see RSI reach oversold. So that may not be useful in timing an entry. There are usually strong candlestick reversal patterns though, and there is one here. The last two days have long lower wicks and the last daily candlestick is very bullish. It is not correctly an engulfing pattern as the open gaps higher, but the close is well above the close of the prior day, which is very bullish.
The risk here is that the pullback is not yet over. Some patience may be required. A smaller position may be entered here, and most powder kept dry for a larger position should Bitcoin move lower.
Published @ 05:45 p.m. EST.