by Lara | Oct 9, 2020 | Gold, Lara's Weekly, S&P500, US Oil
Lara’s Weekly: Elliott Wave and Technical Analysis of S&P500 and Gold and US Oil | Charts – October 9, 2020 S&P 500 Upwards movement continues as the first Elliott wave count expects. The target remains the same. Summary: A target for primary wave...
by Lara | Oct 9, 2020 | US Oil, US Oil Historical
US OIL: Elliott Wave and Technical Analysis | Charts – October 9, 2020 Upwards movement for the week remains within a trading range and below the short-term invalidation point. Summary: For the very short term, upwards movement may end next week slightly above...
by Lara | Aug 21, 2020 | US Oil, US Oil Historical
US OIL: Elliott Wave and Technical Analysis | Charts – August 21, 2020 A very small range week moved price higher, which did not make a new swing high. Both Elliott wave counts remain valid. Summary: Oil may have found a major sustainable low. A slow rounded top...
by Lara | Jul 3, 2020 | US Oil, US Oil Historical
US OIL: Elliott Wave and Technical Analysis | Charts – July 3, 2020 An inside week leaves all three Elliott wave counts the same. Summary: Oil may have found a major sustainable low. For the mid term, a multi-week pullback may end about 31.75 or 22.23. It is...
by Lara | May 15, 2020 | US Oil, US Oil Historical
US OIL: Elliott Wave and Technical Analysis | Charts – May 15, 2020 Upwards movement continues as expected. A new high slightly above 29.14 invalidates the alternate idea and adds confidence to the main Elliott wave count. Summary: Oil may have found a major...
by Lara | Mar 28, 2020 | US Oil
US OIL: Elliott Wave and Technical Analysis | Charts – March 27, 2020 A very small range inside week leaves the Elliott wave count mostly unchanged and the final target the same. Summary: A short to mid-term target for intermediate wave (3) is at 11.92....
by Lara | Feb 8, 2020 | US Oil
US OIL: Elliott Wave and Technical Analysis | Charts – February 7, 2020 The target for downwards movement to end was at 48.81. Price continued lower this week to reach 49.32, just 0.51 short of the target. Summary: Both the bullish and bearish Elliott wave...
by Lara | Dec 20, 2019 | US Oil
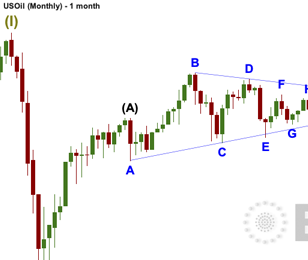
US OIL: Elliott Wave and Technical Analysis | Charts – December 20, 2019 Upwards movement for the week has continued. Price is now right at the upper edge of a triangle trend line. Summary: The triangle may again be complete. A downwards breakout may occur next...
by Lara | Aug 4, 2018 | US Oil
A bounce was expected for the very short term. An outside week closes as a doji. Price mostly moved sideways. Summary: This downwards swing may now continue to about 61.22. For the very short term, look out for a bounce to end at least above 70.17, and possibly about...
