
Last analysis of Silver on 31st December, 2013 expected a trend change and upwards movement. This is exactly what has happened so far. If price moves above 20.489 the new upwards trend would be confirmed.
The wave count remains the same.
Click on the charts below to enlarge.
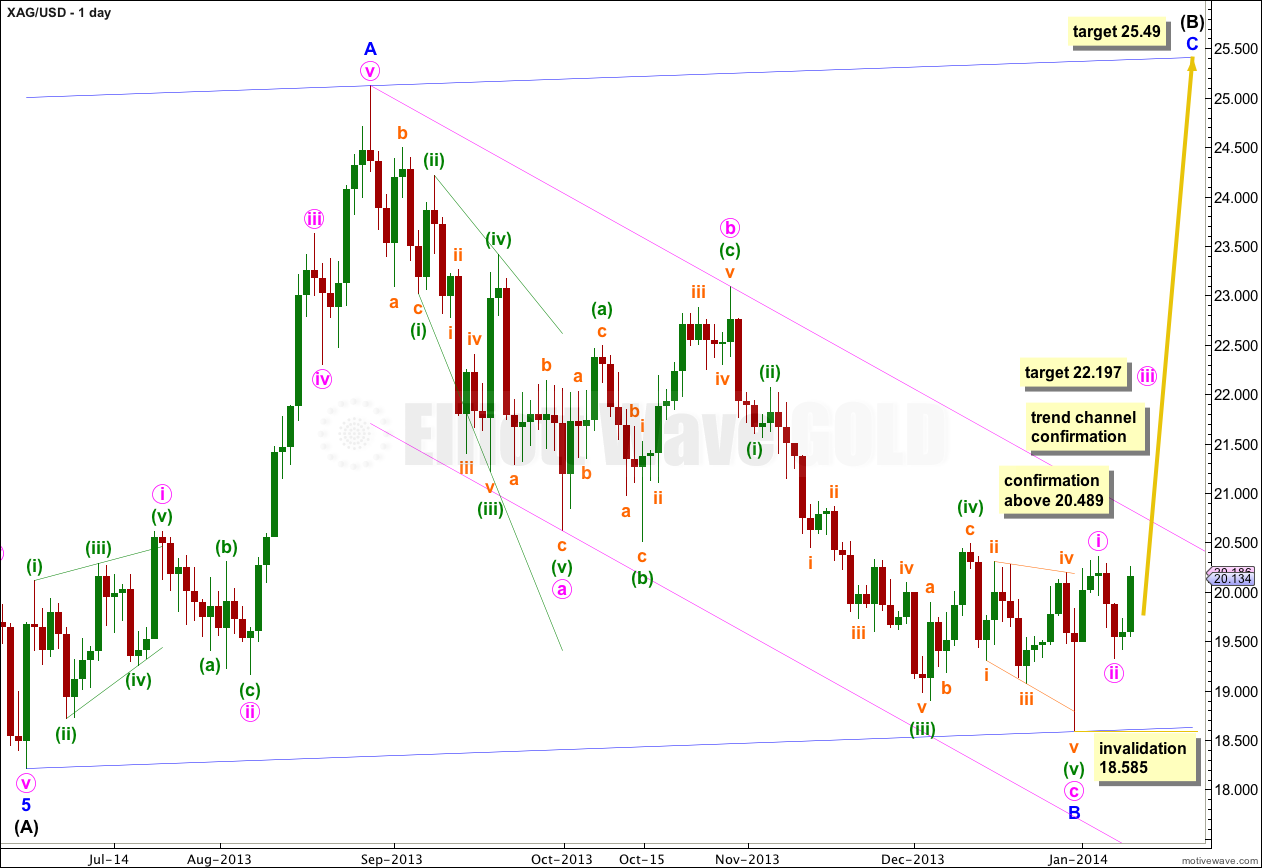
Minor wave B is now a complete zigzag, which is within a bigger zigzag trending upwards one degree higher for intermediate wave (B).
Price movement above 20.489 would provide confidence in this trend change. At that stage upwards movement could not be a second wave correction within the final fifth wave down of minuette wave (v), and so minuette wave (v) would have to be over.
Further upwards movement above the pink parallel channel would provide more confidence in this trend change. A clear channel breach with a full daily candlestick above this channel and not touching the upper trend line would provide this confirmation.
At 25.49 minor wave C would reach equality in length with minor wave A. Minor wave C should find resistance at the upper edge of the big blue channel about this large zigzag.
Minor wave B ended in 88 days, just one short of a Fibonacci 89. Minor wave C should last about 34 to 89 days, depending upon what structure it takes.
Minor wave C must subdivide into a five wave structure, either an ending diagonal or an impulse. An ending diagonal would be more time consuming. An impulse would be faster and is more likely as it is a more common structure.
Within the new upwards trend no second wave correction may move beyond the start of its first wave. This wave count is invalidated with movement below 18.585.
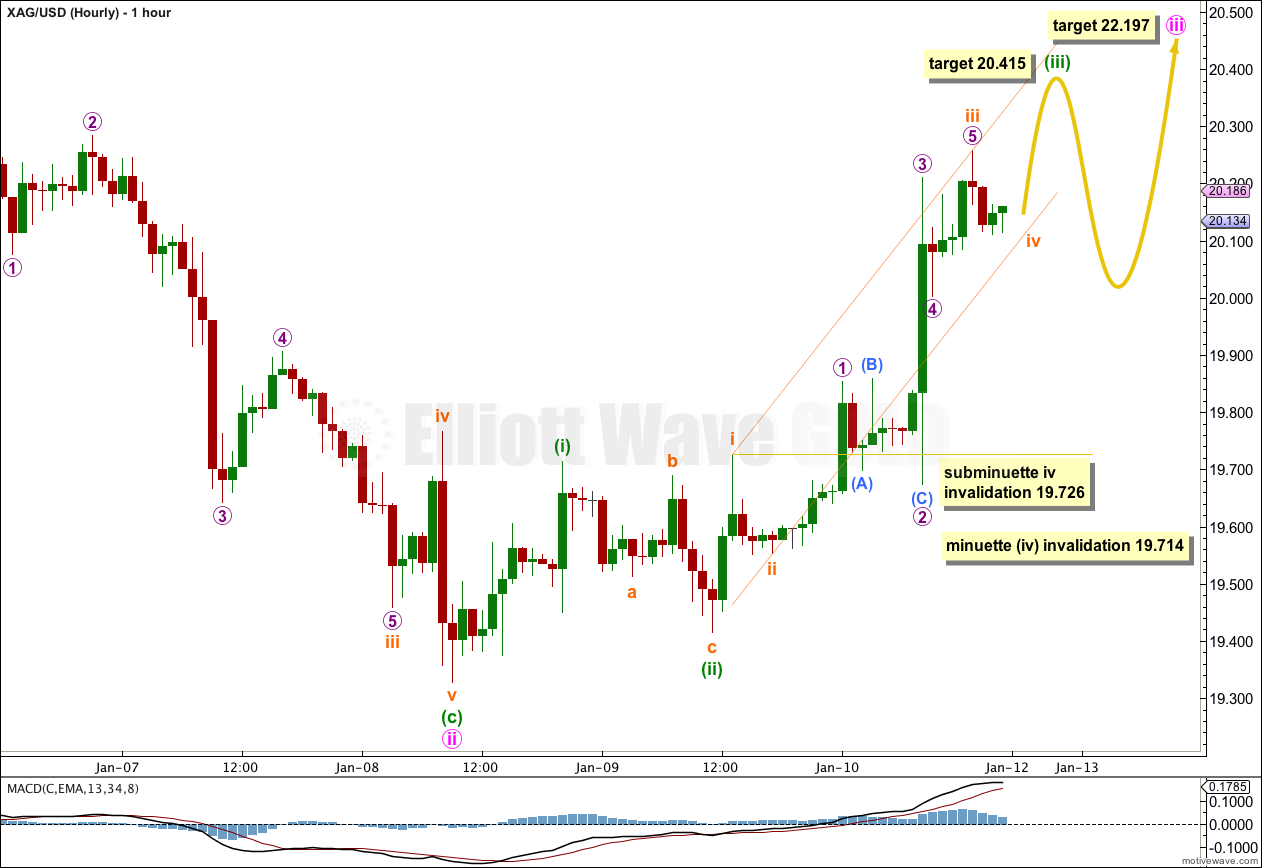
Minute wave i completed a five wave impulse upwards. Minute wave ii completed as a regular flat correction with an abnormally long minuette wave (c), but all subdivisions are correct. Minute wave ii was a deep 58% correction of minute wave i.
Minute wave iii shows an increase in upwards momentum beyond that seen for minute wave i, confirming this is a third wave unfolding.
At 22.197 minute wave iii would reach 1.618 the length of minute wave i. I would expect this target to be about three to five days away.
Within minute wave iii at 20.415 minuette wave (iii) would reach 2.618 the length of minuette wave (i). This target may be reached most likely on Monday, but may be reached on Tuesday.
Draw a parallel channel about minuette wave (iii) using Elliott’s first technique. Draw the first trend line from the highs labeled subminuette waves i to iii, then place a parallel copy upon the low of subminuette wave ii. I would expect subminuette wave iv to find support at the lower edge of this channel, and for the following upwards wave of subminuette wave v to find resistance at the upper edge of this channel. Subminuette wave iv may not move into subminuette wave i price territory. This wave count is invalidated with movement below 19.726.
When this channel is clearly breached by subsequent downwards movement that shall provide first indication that minuette wave (iii) is over and minuette wave (iv) is underway. I would not expect minuette wave (iv) to last longer than a day and it should not show on the daily chart as a red candlestick. Minuette wave (iv) may not move into minuette wave (i) price territory. This wave count is invalidated with movement below 19.714.
Overall this wave count expects more upwards movement with smaller corrections along the way.
Brilliant analysis Lara.
In this impulse wave scenario, Minute wave v will be the longest wave. Does this necessarily imply that wave v will be an extended wave?
Kind regards
Tham Kwok Liang
Yes, the target would imply that.
Or the target is too low.