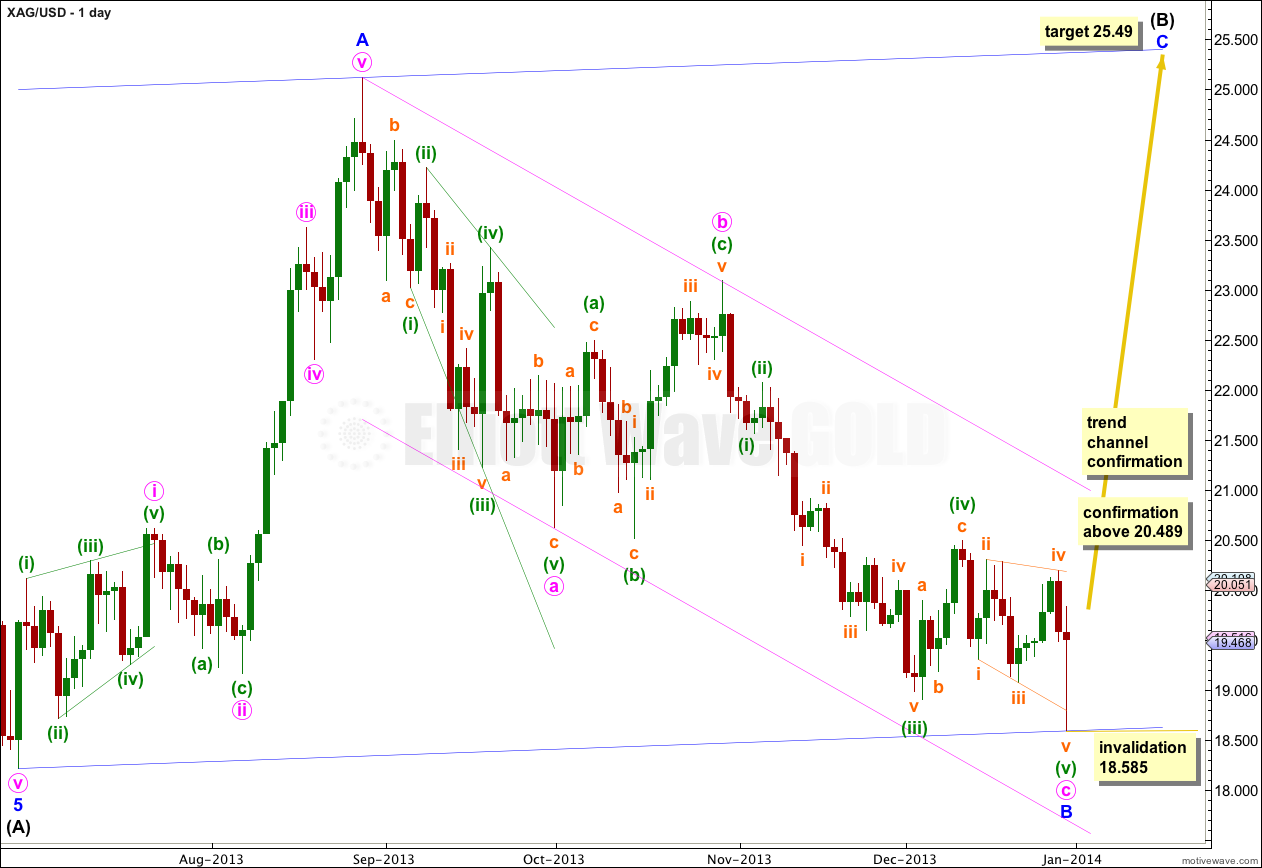
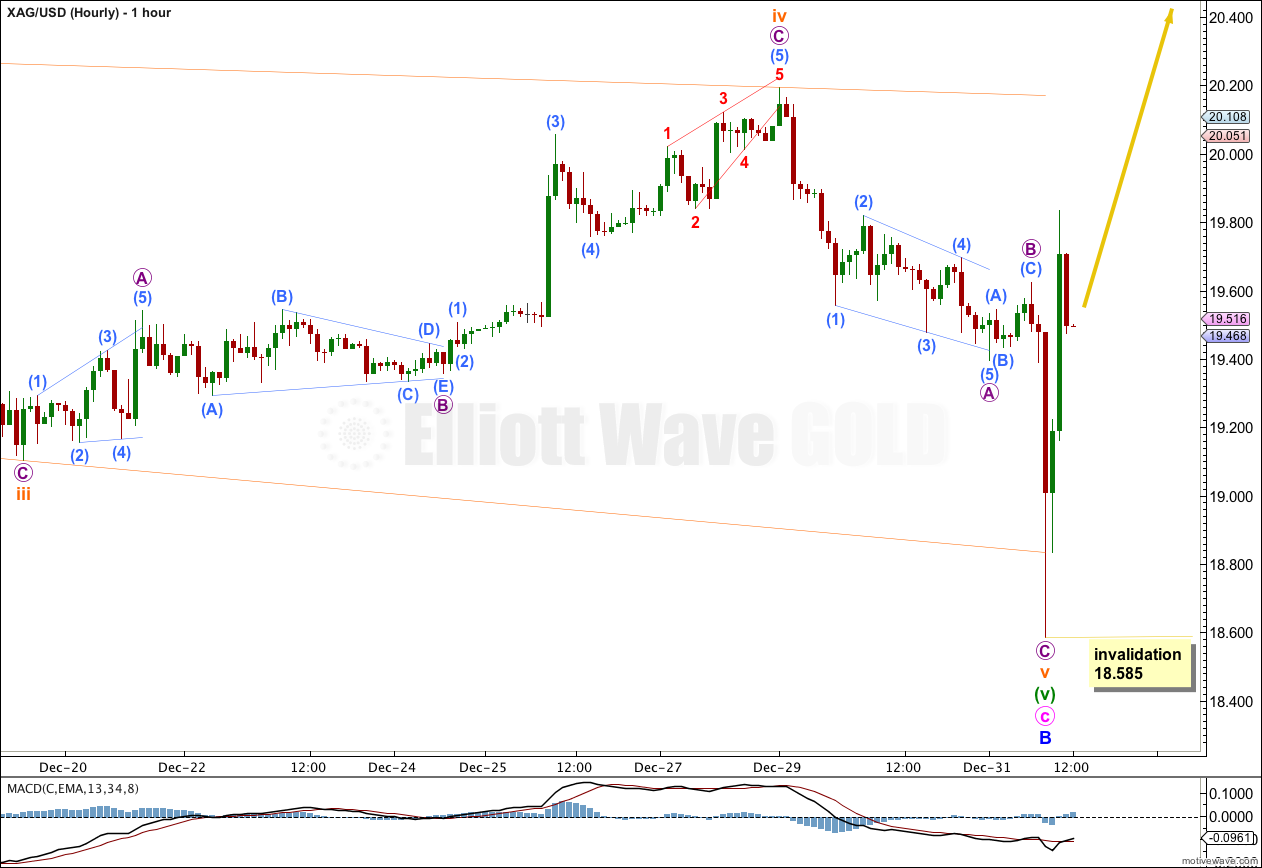
Last analysis of Silver expected more downwards movement towards a target at 18.999. Downwards movement continued, reaching 18.585, 0.414 below the target.
The wave count remains the same.
Click on the charts below to enlarge.
Minor wave B is now a complete zigzag, which is within a bigger zigzag trending upwards one degree higher for intermediate wave (B).
Within minor wave B minute wave a subdivides nicely as a leading expanding diagonal. Within the leading diagonal all the subwaves are zigzags except the third wave which is an impulse. For this piece of movement this structure has the best fit.
Minute wave b is labeled as an expanded flat correction. Within it minuette waves (a) and (b) both subdivide as three wave zigzags, and minuette wave (b) is a 106% correction of minuette wave (a). There is no Fibonacci ratio between minuette waves (a) and (c).
Minute wave c is now a complete impulse. Minute wave c is just 0.006 short of equality in length with minute wave a.
Ratios within minute wave c are: there is no Fibonacci ratio between minuette waves (iii) and (i), and minuette wave (v) is just 0.002 short of 0.618 the length of minuette wave (iii).
Minuette wave (v) subdivided into an ending expanding diagonal, where all the subwaves subdivided into zigzags. The structure is now complete.
Price movement above 20.489 would provide confidence in this trend change.
Further upwards movement above the pink parallel channel would provide more confidence in this trend change.
At 25.49 minor wave C would reach equality in length with minor wave A. Minor wave C should find resistance at the upper edge of the big blue channel about this large zigzag.
Minor wave B ended in 88 days, just one short of a Fibonacci 89. Minor wave C should last about 34 to 89 days, depending upon what structure it takes.
Minor wave C must subdivide into a five wave structure, either an ending diagonal or an impulse. An ending diagonal would be more time consuming. An impulse would be faster and is more likely as it is a more common structure.
Within the new upwards trend no second wave correction may move beyond the start of its first wave. This wave count is invalidated with movement below 18.585.


Two day’s price action can,t break $20.5, the trend will be possible revesal, even though sliver and gold got significant upward movement.
why? what technical analysis or indicators lead you to make this statement?
Hi Lara
I found this long-term count in a german forum for gold. Is that what you suspect as well?
Regards,
Peter
not quite
where this count has wave 1 within the larger (a) I’m seeing (a) (equivalent) in it’s entirety over there
although this wave count is entirely valid
Both the Germans (wave 2) and Lara (wave (b)) have the next wave going up… Be happy.
Why do all the charts I can find show the silver low at 18.818? Does it make any difference, other than upside target, since this is still below 18.999?
Not really. I have noticed that different data feeds sometimes have different points for highs / lows.
It should not be the case, but it is. TBH I think it’s really dodgy.
I’m using an FXCM data feed.