
I had expected a red candlestick for Friday’s session. This is not what happened, but the small green doji fits the wave count and price remains below the invalidation point.
The wave count remains the same.
Summary: I still expect that there has been a trend change at 1,332.28. A second wave correction is complete. Price should resume the downwards trend for Monday as a third wave down begins. Momentum should increase over the next few days. The target for this third wave to end is 1,263.
Click on the charts below to enlarge.
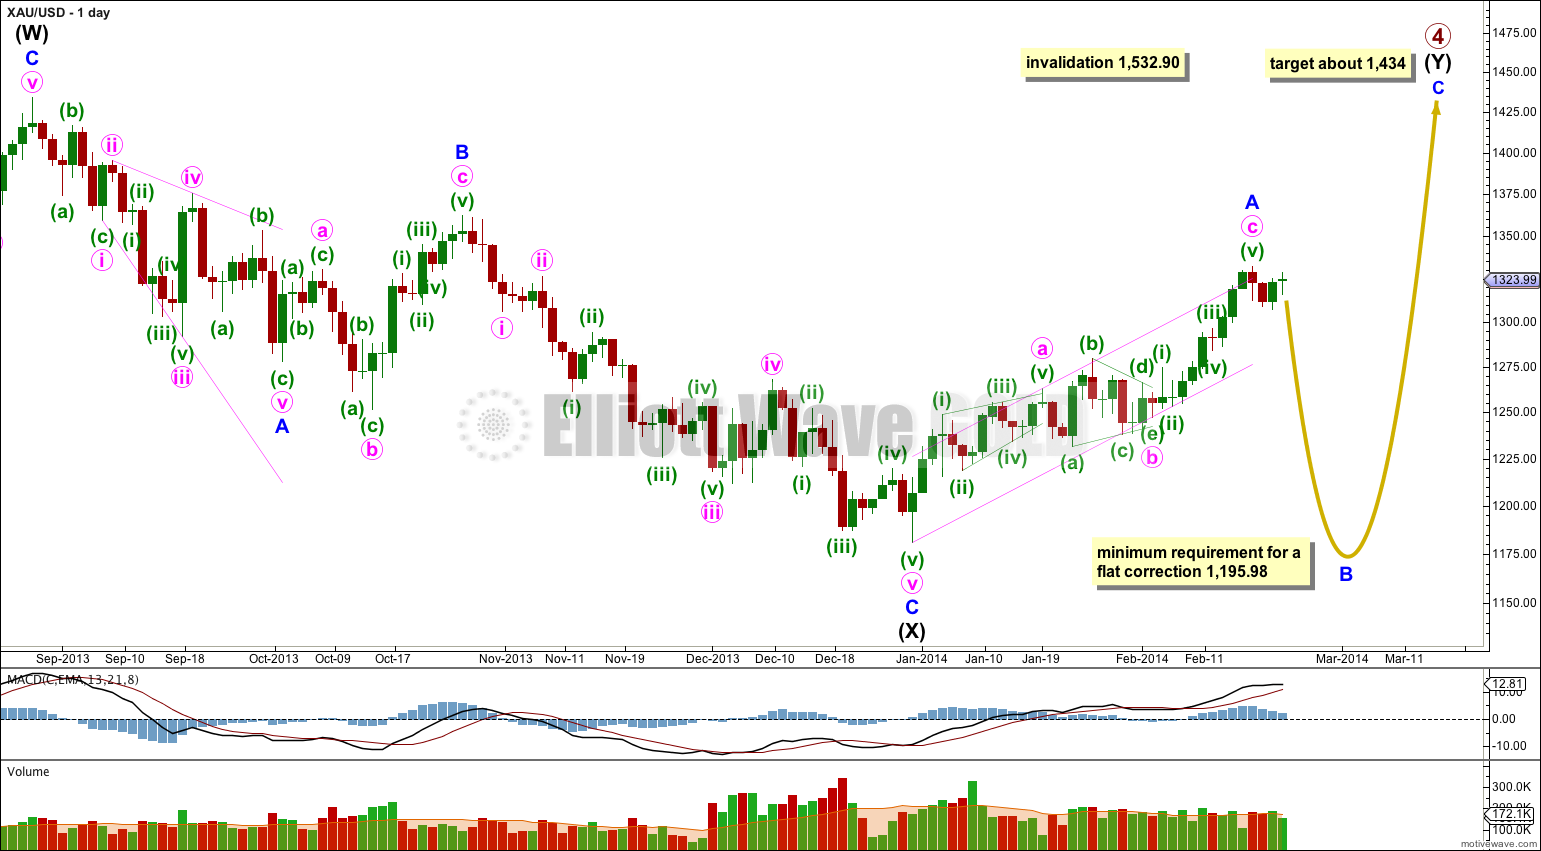
Gold is still within a large fourth wave correction at primary wave degree which is incomplete.
Primary wave 2 was a rare running flat. Primary wave 4 is unlikely to be a flat correction because it is likely to show structural alternation with primary wave 2.
The first upwards wave within primary wave 4 labeled here intermediate wave (W) subdivides as a three wave zigzag. Primary wave 4 cannot be an unfolding zigzag because the first wave within a zigzag, wave A, must subdivide as a five.
Primary wave 4 is unlikely to be completing as a double zigzag because intermediate wave (X) is a deep 99% correction of intermediate wave (W). Double zigzags commonly have shallow X waves because their purpose it to deepen a correction when the first zigzag does not move price deep enough.
Primary wave 4 is most likely to be completing as a double combination: zigzag – X – second structure. The second structure labeled intermediate wave (Y) may be either a flat or a triangle. For both these structures minor wave A must be a three, and is most likely to be a zigzag.
Minor wave A is a complete zigzag.
Minor wave B downwards must retrace a minimum of 90% the length of minor wave A at 1,195.98 if intermediate wave (Y) is a flat correction. If intermediate wave (Y) is a triangle then there is no minimum requirement for minor wave B within it.
Minor wave B must subdivide as a corrective structure, and there are more than thirteen possible corrective structures it may take. Within it minute wave a may be either a three or a five, and when it is complete and its structure is clear then we shall have a clearer idea of what structure minor wave B may be. In another couple of days or so I will publish alternate hourly wave counts to consider all the different possible structures for minute wave a. For now I am waiting to see the first 5-3-5 down complete.
Primary wave 4 may not move into primary wave 1 price territory. This wave count is invalidated with movement above 1,532.90.
Draw a channel about the zigzag of minor wave A: draw the first trend line from the start of minute wave a to the end of minute wave b, then place a parallel copy upon the end of minute wave a. A clear channel breach of this channel with a full daily candlestick below the lower edge and not touching the lower trend line would provide trend channel confirmation of a trend change at minor degree.
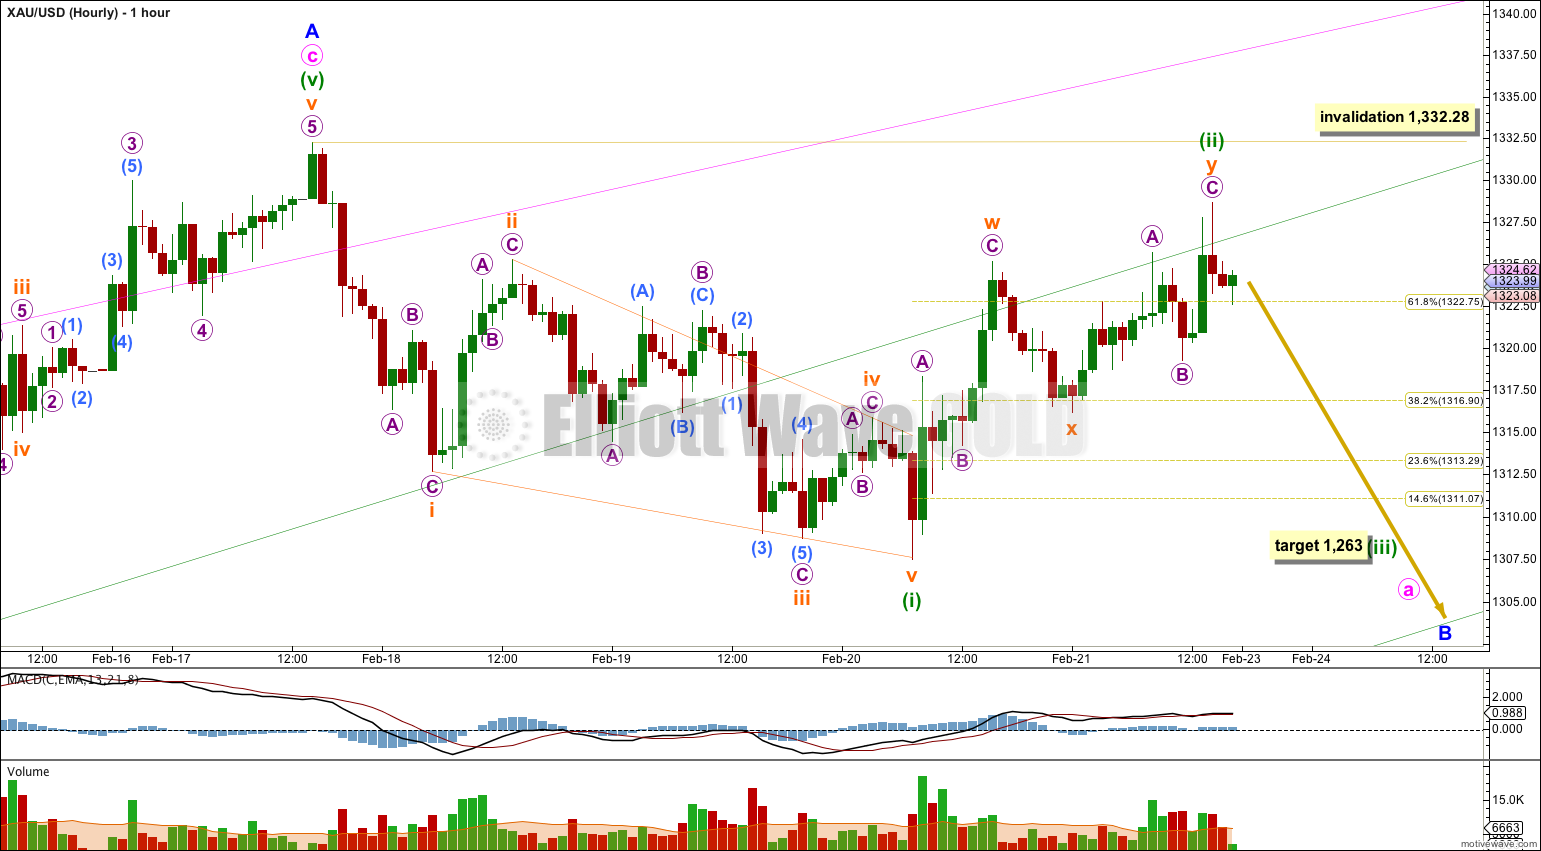
Draw a channel about minute wave c (squish the hourly chart up to do this). Draw the first trend line from the highs of minuette waves (i) to (iii), then place a parallel copy upon the low of minuette wave (ii) (you can see these points on the daily chart). Expand the chart again and watch for price to find support and resistance about these green trend lines, and also the pink trend lines copied over from the daily chart.
Minuette wave (i) is a complete leading contracting diagonal. Leading diagonals in first wave positions are commonly followed by deep second wave corrections. Minuette wave (ii) is a deep 85% double zigzag correction of minuette wave (i). Minuette wave (i) lasted 60 hours, minuette wave (ii) has so far lasted 30 hours. They look nicely in proportion. There is almost no room left for minuette wave (ii) to move into though, so it is extremely likely to be over now.
Because minuette wave (ii) is so deep the target for minuette wave (iii) is calculated at 2.618 the length of minuette wave (i). This would be reached at 1,263. This target may be met by the end of next week or shortly after.
When the lower edge of the green channel is clearly breached by downwards movement at that stage we would have trend channel confirmation that minute wave c is over. This would provide confidence in a trend change at 1,332.28. Prior to this channel breach there is a slim possibility that minute wave c may yet continue higher.
Minuette wave (ii) may not move beyond the start of minuette wave (i). This wave count is invalidated with movement above 1,332.28.
Alternate Daily Wave Count – Triangle.
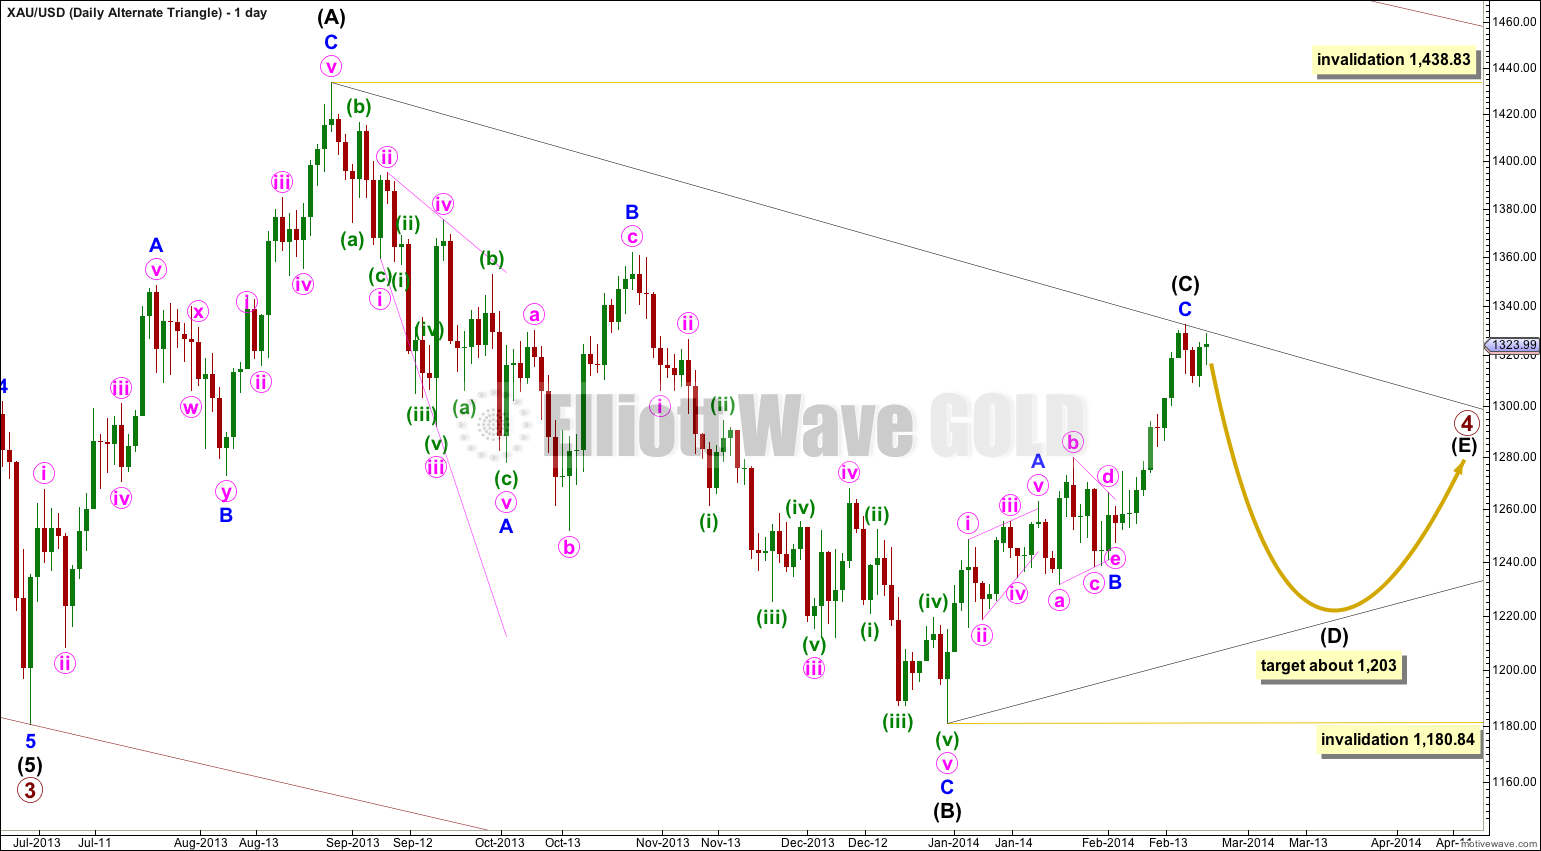
It is also possible that primary wave 4 may continue as a regular contracting (or barrier) triangle.
However, at this stage this triangle scenario looks less likely. It is my experience that the subwaves of contracting triangles are often about 80% to 85% the length of the prior subwave. In this case intermediate wave (C) is only 60% of intermediate wave (B). It looks too short, giving this possible triangle a slightly unusual look overall.
I will keep this possibility charted for you, but at this stage I judge it to have a decreased probability.
Triangles take up time and move price sideways. If primary wave 4 unfolds as a triangle then I would expect it to last months rather than weeks.
They are separate markets. They do not have to move together. Expecting that they must is a fundamental analysis approach, which is mutually exclusive to Elliott Wave.
Then A does not subdivide as a five. It does not work.
Nice point though.
Hi Lara
On your daily chart. If you use the B at the top of the triangle (1279.80) as the end of A. A will equal C at approx. 1337.00. Just a thought.
Hi Lara,
Is bear wavecount invalid now? Are we still going higher for wave C (or) any other wave count? Please update
The updated analysis is published.
hi…. In all fundamental news of Dollar this week Dollar is getting Weaker……So if dollar gets weak how it is possible That Gold goes Down…